

Key Insights
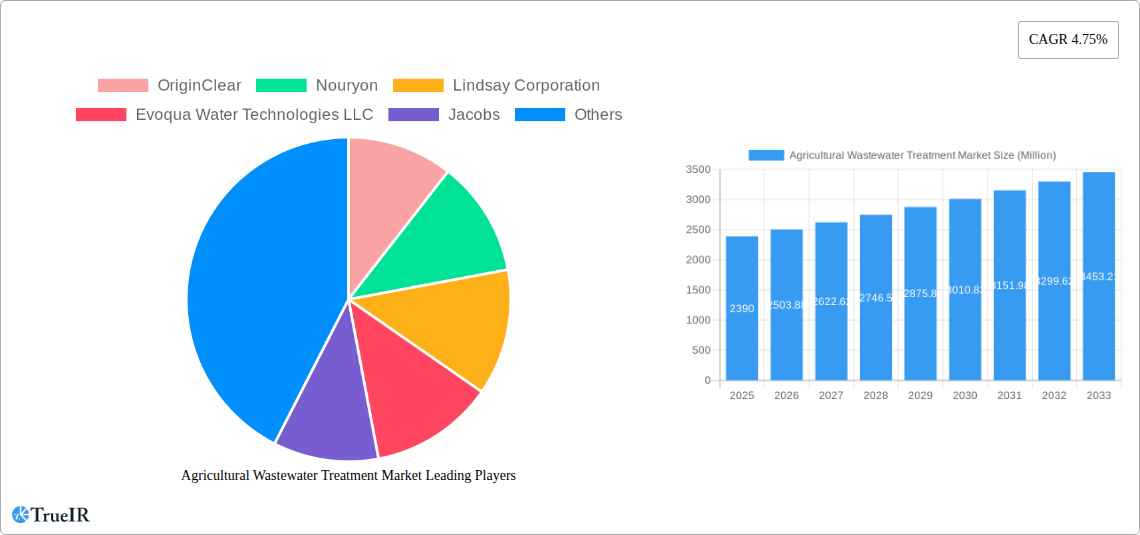
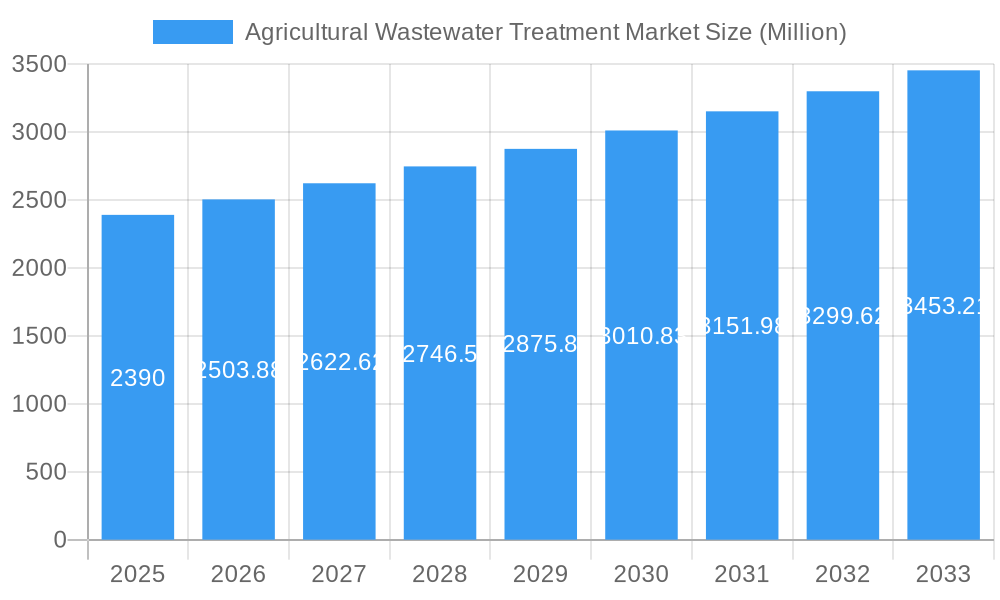
The global agricultural wastewater treatment market, valued at $2.39 billion in 2025, is poised for robust growth, exhibiting a Compound Annual Growth Rate (CAGR) of 4.75% from 2025 to 2033. This expansion is driven by several key factors. Increasing awareness of water scarcity and stricter environmental regulations globally are compelling agricultural businesses to adopt more sustainable wastewater management practices. The rising demand for high-quality agricultural produce and the need to minimize environmental impact are further fueling market growth. Technological advancements in treatment solutions, such as the development of more efficient and cost-effective physical, chemical, and biological treatment methods, are also contributing to market expansion. The segment breakdown reveals a diverse market landscape, with physical solutions currently dominating, followed by chemical and biological solutions. Point source treatment is more prevalent than non-point source treatment currently, though the latter is expected to witness faster growth due to the increasing awareness and adoption of best management practices across large agricultural areas. The application segment is led by crop cultivation, given the large volumes of wastewater generated. Finally, the regional landscape shows a strong presence across North America, Europe, and the Asia-Pacific region, with China and India representing significant growth opportunities in the latter.
Agricultural Wastewater Treatment Market Market Size (In Billion)
The competitive landscape is characterized by a mix of large multinational corporations and specialized smaller companies. Key players such as OriginClear, Nouryon, Lindsay Corporation, Evoqua Water Technologies, and others are actively investing in research and development to improve existing technologies and introduce innovative solutions. Strategic partnerships and mergers and acquisitions are expected to intensify as companies strive to expand their market share and geographic reach. Despite the optimistic outlook, the market faces some challenges. High initial investment costs for wastewater treatment facilities can be a barrier to entry for smaller farms, particularly in developing countries. Furthermore, lack of awareness and insufficient technological infrastructure in some regions hinder widespread adoption. However, government initiatives promoting sustainable agriculture and providing financial incentives for wastewater treatment are expected to mitigate these challenges and support further market growth.
Agricultural Wastewater Treatment Market Company Market Share
Agricultural Wastewater Treatment Market: A Comprehensive Report (2019-2033)
This dynamic report provides a thorough analysis of the Agricultural Wastewater Treatment Market, offering invaluable insights for investors, industry professionals, and researchers. Leveraging extensive data from 2019-2024 (historical period) and projecting to 2033 (forecast period, with 2025 as the base and estimated year), this report unveils market trends, opportunities, and challenges within this crucial sector. The study period covers 2019-2033.
Agricultural Wastewater Treatment Market Structure & Competitive Landscape
The Agricultural Wastewater Treatment Market is characterized by a moderately concentrated landscape, with several multinational corporations and specialized firms vying for market share. Market concentration ratios (xx) reveal a mix of established players and emerging innovators, fostering both collaborative and competitive dynamics. Innovation is driven by the need for sustainable and cost-effective solutions to address increasing water scarcity and stringent environmental regulations. Regulatory pressures, especially concerning nutrient discharge limits and water quality standards, significantly influence technological advancements and market strategies.
Product substitutes, including traditional land application methods, are facing increasing scrutiny due to their environmental impact. End-user segmentation predominantly includes agricultural operations (crop and non-crop), with varying requirements based on scale, location, and regulatory environment. Mergers and acquisitions (M&A) activity (xx Million USD in 2024) indicates a trend of consolidation, with larger companies seeking to expand their technological portfolios and geographical reach. Key M&A trends include acquisitions of smaller, specialized technology providers by larger engineering and construction companies.
- High Market Concentration: xx% of market share held by top 5 players.
- Innovation Drivers: Stringent environmental regulations, water scarcity, and increasing demand for sustainable agricultural practices.
- Regulatory Impacts: Significant influence on technology adoption and operational costs.
- Product Substitutes: Traditional land application methods facing increasing pressure.
- End-User Segmentation: Crop and non-crop agricultural operations.
- M&A Trends: Consolidation through acquisitions of smaller technology providers.
Agricultural Wastewater Treatment Market Trends & Opportunities
The Agricultural Wastewater Treatment Market exhibits robust growth, driven by escalating global agricultural output and heightened environmental awareness. The market size is projected to reach xx Million USD by 2025, growing at a CAGR of xx% during the forecast period (2025-2033). This growth is fueled by technological advancements in water treatment technologies, leading to more efficient and cost-effective solutions. Consumer preferences are shifting towards sustainable practices, encouraging adoption of advanced wastewater treatment systems.
Competitive dynamics are intensifying, with companies focusing on product differentiation, geographical expansion, and strategic partnerships. Market penetration rates for advanced technologies are increasing steadily, driven by government incentives and rising environmental concerns. Technological shifts toward automated, data-driven systems and the integration of renewable energy sources are gaining traction, promising enhanced efficiency and reduced operational costs. The growing demand for precision agriculture and sustainable intensification further contributes to the market’s upward trajectory.
Dominant Markets & Segments in Agricultural Wastewater Treatment Market
While data on precise market dominance requires deeper analysis, preliminary estimations point to North America and Europe as leading regions, followed by Asia-Pacific, driven by rapid industrialization and stringent environmental regulations in these regions. Within the segments:
Technology: Biological solutions are gaining popularity due to their environmental benefits and cost-effectiveness in treating specific pollutants. Chemical solutions continue to hold a significant market share due to established technologies and reliability. Physical solutions are seeing innovation in membrane filtration and other advanced separation techniques.
Pollutant Source: Point-source pollution treatment remains a significant market segment due to the ease of monitoring and regulating discharge from centralized facilities. Non-point source pollution management presents significant challenges and technological opportunities.
Application: Crop-related applications account for the majority of market demand, due to the large volume of wastewater generated by intensive agricultural practices. Non-crop applications are a niche market, representing waste treatment in aquaculture, horticulture, and other sectors.
Key Growth Drivers:
- Government Regulations and Incentives: Stringent environmental regulations and financial incentives promote the adoption of efficient wastewater treatment systems.
- Technological Advancements: Development of cost-effective and efficient treatment technologies are boosting market adoption.
- Water Scarcity and Resource Management: Growing awareness of water scarcity drives the adoption of water recycling and reuse technologies.
- Infrastructure Development: Investments in wastewater treatment infrastructure are contributing to market expansion.
Agricultural Wastewater Treatment Market Product Analysis
Technological advancements are shaping the product landscape, with a shift towards modular, automated systems and the integration of data analytics for optimized treatment processes. New products emphasize energy efficiency, reduced sludge production, and improved nutrient recovery, addressing both environmental and economic concerns. Competitive advantages are based on technological innovation, operational efficiency, cost-effectiveness, and the ability to offer comprehensive solutions tailored to specific agricultural needs and regulatory requirements.
Key Drivers, Barriers & Challenges in Agricultural Wastewater Treatment Market
Key Drivers:
- Rising Environmental Concerns: Growing awareness of water pollution from agricultural activities drives the demand for effective wastewater treatment solutions.
- Government Regulations: Stringent regulations regarding wastewater discharge are propelling market growth.
- Technological Advancements: Innovations in water treatment technologies offer enhanced efficiency and cost-effectiveness.
Challenges and Restraints:
- High Initial Investment Costs: The substantial upfront investment required for installing wastewater treatment systems can be a barrier for small-scale farmers.
- Operational Costs: Ongoing operation and maintenance costs can be significant, particularly for advanced treatment technologies.
- Lack of Awareness: Limited awareness among farmers about the benefits of wastewater treatment can hinder market adoption in certain regions.
- Regulatory Complexity: Varied and evolving regulations can make it difficult for companies to navigate compliance requirements across different jurisdictions. This complexity leads to increased operational costs and potential legal issues. The impact is estimated to reduce overall market growth by approximately xx% annually.
Growth Drivers in the Agricultural Wastewater Treatment Market Market
Stringent environmental regulations globally, growing awareness of water scarcity, and technological advancements in cost-effective and energy-efficient treatment solutions are key drivers. Government support through incentives, subsidies, and grants further fuels market growth. Increasing demand from large-scale agricultural operations and advancements in nutrient recovery contribute to market expansion.
Challenges Impacting Agricultural Wastewater Treatment Market Growth
High upfront investment costs, complex regulatory frameworks, and the need for skilled operation and maintenance personnel pose major challenges. Supply chain disruptions can cause delays and cost increases. Competition from traditional, less environmentally friendly methods, and a lack of awareness among smallholder farmers also impede market penetration.
Key Players Shaping the Agricultural Wastewater Treatment Market Market
- OriginClear
- Nouryon
- Lindsay Corporation
- Evoqua Water Technologies LLC
- Jacobs
- Aquatech International LLC
- BASF SE
- IDE
- SUEZ
- DuPont
- Organo Corporation
- Veolia
- AECOM
- Louis Berger International
Significant Agricultural Wastewater Treatment Market Industry Milestones
September 2022: Lanxess commissioned a new wastewater treatment plant in Belgium, investing USD 12.65 Million and demonstrating commitment to sustainable practices. This highlights the growing investment in advanced treatment facilities by large industrial players.
June 2022: AECOM’s completion of the North Shore wastewater treatment plant design signifies a substantial investment in addressing wastewater management needs. This underscores the growing market demand for engineering and construction services within the sector.
Future Outlook for Agricultural Wastewater Treatment Market Market
The Agricultural Wastewater Treatment Market is poised for sustained growth, driven by ongoing technological innovation, increasing regulatory pressure, and heightened environmental awareness. Strategic partnerships between technology providers and agricultural businesses will be vital. Opportunities exist in developing cost-effective solutions tailored to the needs of small-scale farmers, expanding into emerging markets, and integrating renewable energy sources into treatment processes. The market holds significant potential for growth, particularly in regions with intensive agricultural practices and water scarcity issues.
Agricultural Wastewater Treatment Market Segmentation
-
1. Technology
- 1.1. Physical Solutions
- 1.2. Chemical Solutions
- 1.3. Biological Solutions
-
2. Pollutant Source
- 2.1. Point Source
- 2.2. Nonpoint Source
-
3. Application
- 3.1. Crop
- 3.2. Non-Crop
Agricultural Wastewater Treatment Market Segmentation By Geography
-
1. Asia Pacific
- 1.1. China
- 1.2. India
- 1.3. Japan
- 1.4. South Korea
- 1.5. Rest of Asia Pacific
-
2. North America
- 2.1. United States
- 2.2. Canada
- 2.3. Mexico
-
3. Europe
- 3.1. Germany
- 3.2. United Kingdom
- 3.3. France
- 3.4. Italy
- 3.5. Rest of Europe
-
4. South America
- 4.1. Brazil
- 4.2. Argentina
- 4.3. Rest of South America
-
5. Middle East and Africa
- 5.1. Saudi Arabia
- 5.2. South Africa
- 5.3. Rest of Middle East and Africa
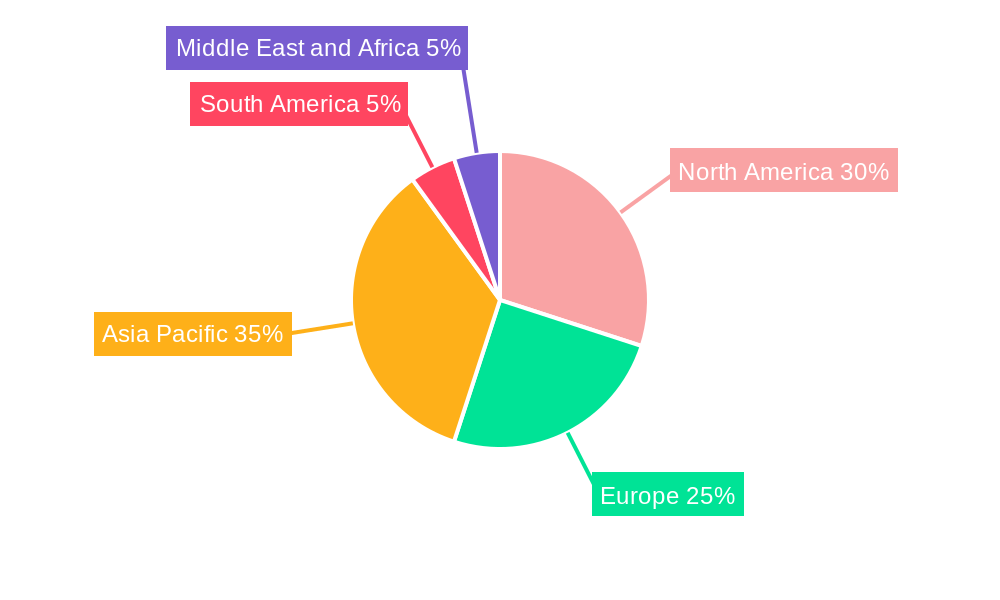
Agricultural Wastewater Treatment Market Regional Market Share
Geographic Coverage of Agricultural Wastewater Treatment Market
Agricultural Wastewater Treatment Market REPORT HIGHLIGHTS
| Aspects | Details |
|---|---|
| Study Period | 2020-2034 |
| Base Year | 2025 |
| Estimated Year | 2026 |
| Forecast Period | 2026-2034 |
| Historical Period | 2020-2025 |
| Growth Rate | CAGR of 4.75% from 2020-2034 |
| Segmentation |
|
Table of Contents
- 1. Introduction
- 1.1. Research Scope
- 1.2. Market Segmentation
- 1.3. Research Objective
- 1.4. Definitions and Assumptions
- 2. Executive Summary
- 2.1. Market Snapshot
- 3. Market Dynamics
- 3.1. Market Drivers
- 3.2. Market Restrains
- 3.3. Market Trends
- 3.4. Market Opportunities
- 4. Market Factor Analysis
- 4.1. Porters Five Forces
- 4.1.1. Bargaining Power of Suppliers
- 4.1.2. Bargaining Power of Buyers
- 4.1.3. Threat of New Entrants
- 4.1.4. Threat of Substitutes
- 4.1.5. Competitive Rivalry
- 4.2. PESTEL analysis
- 4.3. BCG Analysis
- 4.3.1. Stars (High Growth, High Market Share)
- 4.3.2. Cash Cows (Low Growth, High Market Share)
- 4.3.3. Question Mark (High Growth, Low Market Share)
- 4.3.4. Dogs (Low Growth, Low Market Share)
- 4.4. Ansoff Matrix Analysis
- 4.5. Supply Chain Analysis
- 4.6. Regulatory Landscape
- 4.7. Current Market Potential and Opportunity Assessment (TAM–SAM–SOM Framework)
- 4.8. TIR Analyst Note
- 4.1. Porters Five Forces
- 5. Market Analysis, Insights and Forecast 2021-2033
- 5.1. Market Analysis, Insights and Forecast - by Technology
- 5.1.1. Physical Solutions
- 5.1.2. Chemical Solutions
- 5.1.3. Biological Solutions
- 5.2. Market Analysis, Insights and Forecast - by Pollutant Source
- 5.2.1. Point Source
- 5.2.2. Nonpoint Source
- 5.3. Market Analysis, Insights and Forecast - by Application
- 5.3.1. Crop
- 5.3.2. Non-Crop
- 5.4. Market Analysis, Insights and Forecast - by Region
- 5.4.1. Asia Pacific
- 5.4.2. North America
- 5.4.3. Europe
- 5.4.4. South America
- 5.4.5. Middle East and Africa
- 5.1. Market Analysis, Insights and Forecast - by Technology
- 6. Global Agricultural Wastewater Treatment Market Analysis, Insights and Forecast, 2021-2033
- 6.1. Market Analysis, Insights and Forecast - by Technology
- 6.1.1. Physical Solutions
- 6.1.2. Chemical Solutions
- 6.1.3. Biological Solutions
- 6.2. Market Analysis, Insights and Forecast - by Pollutant Source
- 6.2.1. Point Source
- 6.2.2. Nonpoint Source
- 6.3. Market Analysis, Insights and Forecast - by Application
- 6.3.1. Crop
- 6.3.2. Non-Crop
- 6.1. Market Analysis, Insights and Forecast - by Technology
- 7. Asia Pacific Agricultural Wastewater Treatment Market Analysis, Insights and Forecast, 2020-2032
- 7.1. Market Analysis, Insights and Forecast - by Technology
- 7.1.1. Physical Solutions
- 7.1.2. Chemical Solutions
- 7.1.3. Biological Solutions
- 7.2. Market Analysis, Insights and Forecast - by Pollutant Source
- 7.2.1. Point Source
- 7.2.2. Nonpoint Source
- 7.3. Market Analysis, Insights and Forecast - by Application
- 7.3.1. Crop
- 7.3.2. Non-Crop
- 7.1. Market Analysis, Insights and Forecast - by Technology
- 8. North America Agricultural Wastewater Treatment Market Analysis, Insights and Forecast, 2020-2032
- 8.1. Market Analysis, Insights and Forecast - by Technology
- 8.1.1. Physical Solutions
- 8.1.2. Chemical Solutions
- 8.1.3. Biological Solutions
- 8.2. Market Analysis, Insights and Forecast - by Pollutant Source
- 8.2.1. Point Source
- 8.2.2. Nonpoint Source
- 8.3. Market Analysis, Insights and Forecast - by Application
- 8.3.1. Crop
- 8.3.2. Non-Crop
- 8.1. Market Analysis, Insights and Forecast - by Technology
- 9. Europe Agricultural Wastewater Treatment Market Analysis, Insights and Forecast, 2020-2032
- 9.1. Market Analysis, Insights and Forecast - by Technology
- 9.1.1. Physical Solutions
- 9.1.2. Chemical Solutions
- 9.1.3. Biological Solutions
- 9.2. Market Analysis, Insights and Forecast - by Pollutant Source
- 9.2.1. Point Source
- 9.2.2. Nonpoint Source
- 9.3. Market Analysis, Insights and Forecast - by Application
- 9.3.1. Crop
- 9.3.2. Non-Crop
- 9.1. Market Analysis, Insights and Forecast - by Technology
- 10. South America Agricultural Wastewater Treatment Market Analysis, Insights and Forecast, 2020-2032
- 10.1. Market Analysis, Insights and Forecast - by Technology
- 10.1.1. Physical Solutions
- 10.1.2. Chemical Solutions
- 10.1.3. Biological Solutions
- 10.2. Market Analysis, Insights and Forecast - by Pollutant Source
- 10.2.1. Point Source
- 10.2.2. Nonpoint Source
- 10.3. Market Analysis, Insights and Forecast - by Application
- 10.3.1. Crop
- 10.3.2. Non-Crop
- 10.1. Market Analysis, Insights and Forecast - by Technology
- 11. Middle East and Africa Agricultural Wastewater Treatment Market Analysis, Insights and Forecast, 2020-2032
- 11.1. Market Analysis, Insights and Forecast - by Technology
- 11.1.1. Physical Solutions
- 11.1.2. Chemical Solutions
- 11.1.3. Biological Solutions
- 11.2. Market Analysis, Insights and Forecast - by Pollutant Source
- 11.2.1. Point Source
- 11.2.2. Nonpoint Source
- 11.3. Market Analysis, Insights and Forecast - by Application
- 11.3.1. Crop
- 11.3.2. Non-Crop
- 11.1. Market Analysis, Insights and Forecast - by Technology
- 12. Competitive Analysis
- 12.1. Company Profiles
- 12.1.1 OriginClear
- 12.1.1.1. Company Overview
- 12.1.1.2. Products
- 12.1.1.3. Company Financials
- 12.1.1.4. SWOT Analysis
- 12.1.2 Nouryon
- 12.1.2.1. Company Overview
- 12.1.2.2. Products
- 12.1.2.3. Company Financials
- 12.1.2.4. SWOT Analysis
- 12.1.3 Lindsay Corporation
- 12.1.3.1. Company Overview
- 12.1.3.2. Products
- 12.1.3.3. Company Financials
- 12.1.3.4. SWOT Analysis
- 12.1.4 Evoqua Water Technologies LLC
- 12.1.4.1. Company Overview
- 12.1.4.2. Products
- 12.1.4.3. Company Financials
- 12.1.4.4. SWOT Analysis
- 12.1.5 Jacobs
- 12.1.5.1. Company Overview
- 12.1.5.2. Products
- 12.1.5.3. Company Financials
- 12.1.5.4. SWOT Analysis
- 12.1.6 Aquatech International LLC
- 12.1.6.1. Company Overview
- 12.1.6.2. Products
- 12.1.6.3. Company Financials
- 12.1.6.4. SWOT Analysis
- 12.1.7 BASF SE
- 12.1.7.1. Company Overview
- 12.1.7.2. Products
- 12.1.7.3. Company Financials
- 12.1.7.4. SWOT Analysis
- 12.1.8 IDE
- 12.1.8.1. Company Overview
- 12.1.8.2. Products
- 12.1.8.3. Company Financials
- 12.1.8.4. SWOT Analysis
- 12.1.9 SUEZ
- 12.1.9.1. Company Overview
- 12.1.9.2. Products
- 12.1.9.3. Company Financials
- 12.1.9.4. SWOT Analysis
- 12.1.10 DuPont
- 12.1.10.1. Company Overview
- 12.1.10.2. Products
- 12.1.10.3. Company Financials
- 12.1.10.4. SWOT Analysis
- 12.1.11 Organo Corporation
- 12.1.11.1. Company Overview
- 12.1.11.2. Products
- 12.1.11.3. Company Financials
- 12.1.11.4. SWOT Analysis
- 12.1.12 Veolia*List Not Exhaustive
- 12.1.12.1. Company Overview
- 12.1.12.2. Products
- 12.1.12.3. Company Financials
- 12.1.12.4. SWOT Analysis
- 12.1.13 AECOM
- 12.1.13.1. Company Overview
- 12.1.13.2. Products
- 12.1.13.3. Company Financials
- 12.1.13.4. SWOT Analysis
- 12.1.14 Louis Berger International
- 12.1.14.1. Company Overview
- 12.1.14.2. Products
- 12.1.14.3. Company Financials
- 12.1.14.4. SWOT Analysis
- 12.1.1 OriginClear
- 12.2. Market Entropy
- 12.2.1 Company's Key Areas Served
- 12.2.2 Recent Developments
- 12.3. Company Market Share Analysis 2025
- 12.3.1 Top 5 Companies Market Share Analysis
- 12.3.2 Top 3 Companies Market Share Analysis
- 12.4. List of Potential Customers
- 13. Research Methodology
List of Figures
- Figure 1: Global Agricultural Wastewater Treatment Market Revenue Breakdown (Million, %) by Region 2025 & 2033
- Figure 2: Asia Pacific Agricultural Wastewater Treatment Market Revenue (Million), by Technology 2025 & 2033
- Figure 3: Asia Pacific Agricultural Wastewater Treatment Market Revenue Share (%), by Technology 2025 & 2033
- Figure 4: Asia Pacific Agricultural Wastewater Treatment Market Revenue (Million), by Pollutant Source 2025 & 2033
- Figure 5: Asia Pacific Agricultural Wastewater Treatment Market Revenue Share (%), by Pollutant Source 2025 & 2033
- Figure 6: Asia Pacific Agricultural Wastewater Treatment Market Revenue (Million), by Application 2025 & 2033
- Figure 7: Asia Pacific Agricultural Wastewater Treatment Market Revenue Share (%), by Application 2025 & 2033
- Figure 8: Asia Pacific Agricultural Wastewater Treatment Market Revenue (Million), by Country 2025 & 2033
- Figure 9: Asia Pacific Agricultural Wastewater Treatment Market Revenue Share (%), by Country 2025 & 2033
- Figure 10: North America Agricultural Wastewater Treatment Market Revenue (Million), by Technology 2025 & 2033
- Figure 11: North America Agricultural Wastewater Treatment Market Revenue Share (%), by Technology 2025 & 2033
- Figure 12: North America Agricultural Wastewater Treatment Market Revenue (Million), by Pollutant Source 2025 & 2033
- Figure 13: North America Agricultural Wastewater Treatment Market Revenue Share (%), by Pollutant Source 2025 & 2033
- Figure 14: North America Agricultural Wastewater Treatment Market Revenue (Million), by Application 2025 & 2033
- Figure 15: North America Agricultural Wastewater Treatment Market Revenue Share (%), by Application 2025 & 2033
- Figure 16: North America Agricultural Wastewater Treatment Market Revenue (Million), by Country 2025 & 2033
- Figure 17: North America Agricultural Wastewater Treatment Market Revenue Share (%), by Country 2025 & 2033
- Figure 18: Europe Agricultural Wastewater Treatment Market Revenue (Million), by Technology 2025 & 2033
- Figure 19: Europe Agricultural Wastewater Treatment Market Revenue Share (%), by Technology 2025 & 2033
- Figure 20: Europe Agricultural Wastewater Treatment Market Revenue (Million), by Pollutant Source 2025 & 2033
- Figure 21: Europe Agricultural Wastewater Treatment Market Revenue Share (%), by Pollutant Source 2025 & 2033
- Figure 22: Europe Agricultural Wastewater Treatment Market Revenue (Million), by Application 2025 & 2033
- Figure 23: Europe Agricultural Wastewater Treatment Market Revenue Share (%), by Application 2025 & 2033
- Figure 24: Europe Agricultural Wastewater Treatment Market Revenue (Million), by Country 2025 & 2033
- Figure 25: Europe Agricultural Wastewater Treatment Market Revenue Share (%), by Country 2025 & 2033
- Figure 26: South America Agricultural Wastewater Treatment Market Revenue (Million), by Technology 2025 & 2033
- Figure 27: South America Agricultural Wastewater Treatment Market Revenue Share (%), by Technology 2025 & 2033
- Figure 28: South America Agricultural Wastewater Treatment Market Revenue (Million), by Pollutant Source 2025 & 2033
- Figure 29: South America Agricultural Wastewater Treatment Market Revenue Share (%), by Pollutant Source 2025 & 2033
- Figure 30: South America Agricultural Wastewater Treatment Market Revenue (Million), by Application 2025 & 2033
- Figure 31: South America Agricultural Wastewater Treatment Market Revenue Share (%), by Application 2025 & 2033
- Figure 32: South America Agricultural Wastewater Treatment Market Revenue (Million), by Country 2025 & 2033
- Figure 33: South America Agricultural Wastewater Treatment Market Revenue Share (%), by Country 2025 & 2033
- Figure 34: Middle East and Africa Agricultural Wastewater Treatment Market Revenue (Million), by Technology 2025 & 2033
- Figure 35: Middle East and Africa Agricultural Wastewater Treatment Market Revenue Share (%), by Technology 2025 & 2033
- Figure 36: Middle East and Africa Agricultural Wastewater Treatment Market Revenue (Million), by Pollutant Source 2025 & 2033
- Figure 37: Middle East and Africa Agricultural Wastewater Treatment Market Revenue Share (%), by Pollutant Source 2025 & 2033
- Figure 38: Middle East and Africa Agricultural Wastewater Treatment Market Revenue (Million), by Application 2025 & 2033
- Figure 39: Middle East and Africa Agricultural Wastewater Treatment Market Revenue Share (%), by Application 2025 & 2033
- Figure 40: Middle East and Africa Agricultural Wastewater Treatment Market Revenue (Million), by Country 2025 & 2033
- Figure 41: Middle East and Africa Agricultural Wastewater Treatment Market Revenue Share (%), by Country 2025 & 2033
List of Tables
- Table 1: Global Agricultural Wastewater Treatment Market Revenue Million Forecast, by Technology 2020 & 2033
- Table 2: Global Agricultural Wastewater Treatment Market Revenue Million Forecast, by Pollutant Source 2020 & 2033
- Table 3: Global Agricultural Wastewater Treatment Market Revenue Million Forecast, by Application 2020 & 2033
- Table 4: Global Agricultural Wastewater Treatment Market Revenue Million Forecast, by Region 2020 & 2033
- Table 5: Global Agricultural Wastewater Treatment Market Revenue Million Forecast, by Technology 2020 & 2033
- Table 6: Global Agricultural Wastewater Treatment Market Revenue Million Forecast, by Pollutant Source 2020 & 2033
- Table 7: Global Agricultural Wastewater Treatment Market Revenue Million Forecast, by Application 2020 & 2033
- Table 8: Global Agricultural Wastewater Treatment Market Revenue Million Forecast, by Country 2020 & 2033
- Table 9: China Agricultural Wastewater Treatment Market Revenue (Million) Forecast, by Application 2020 & 2033
- Table 10: India Agricultural Wastewater Treatment Market Revenue (Million) Forecast, by Application 2020 & 2033
- Table 11: Japan Agricultural Wastewater Treatment Market Revenue (Million) Forecast, by Application 2020 & 2033
- Table 12: South Korea Agricultural Wastewater Treatment Market Revenue (Million) Forecast, by Application 2020 & 2033
- Table 13: Rest of Asia Pacific Agricultural Wastewater Treatment Market Revenue (Million) Forecast, by Application 2020 & 2033
- Table 14: Global Agricultural Wastewater Treatment Market Revenue Million Forecast, by Technology 2020 & 2033
- Table 15: Global Agricultural Wastewater Treatment Market Revenue Million Forecast, by Pollutant Source 2020 & 2033
- Table 16: Global Agricultural Wastewater Treatment Market Revenue Million Forecast, by Application 2020 & 2033
- Table 17: Global Agricultural Wastewater Treatment Market Revenue Million Forecast, by Country 2020 & 2033
- Table 18: United States Agricultural Wastewater Treatment Market Revenue (Million) Forecast, by Application 2020 & 2033
- Table 19: Canada Agricultural Wastewater Treatment Market Revenue (Million) Forecast, by Application 2020 & 2033
- Table 20: Mexico Agricultural Wastewater Treatment Market Revenue (Million) Forecast, by Application 2020 & 2033
- Table 21: Global Agricultural Wastewater Treatment Market Revenue Million Forecast, by Technology 2020 & 2033
- Table 22: Global Agricultural Wastewater Treatment Market Revenue Million Forecast, by Pollutant Source 2020 & 2033
- Table 23: Global Agricultural Wastewater Treatment Market Revenue Million Forecast, by Application 2020 & 2033
- Table 24: Global Agricultural Wastewater Treatment Market Revenue Million Forecast, by Country 2020 & 2033
- Table 25: Germany Agricultural Wastewater Treatment Market Revenue (Million) Forecast, by Application 2020 & 2033
- Table 26: United Kingdom Agricultural Wastewater Treatment Market Revenue (Million) Forecast, by Application 2020 & 2033
- Table 27: France Agricultural Wastewater Treatment Market Revenue (Million) Forecast, by Application 2020 & 2033
- Table 28: Italy Agricultural Wastewater Treatment Market Revenue (Million) Forecast, by Application 2020 & 2033
- Table 29: Rest of Europe Agricultural Wastewater Treatment Market Revenue (Million) Forecast, by Application 2020 & 2033
- Table 30: Global Agricultural Wastewater Treatment Market Revenue Million Forecast, by Technology 2020 & 2033
- Table 31: Global Agricultural Wastewater Treatment Market Revenue Million Forecast, by Pollutant Source 2020 & 2033
- Table 32: Global Agricultural Wastewater Treatment Market Revenue Million Forecast, by Application 2020 & 2033
- Table 33: Global Agricultural Wastewater Treatment Market Revenue Million Forecast, by Country 2020 & 2033
- Table 34: Brazil Agricultural Wastewater Treatment Market Revenue (Million) Forecast, by Application 2020 & 2033
- Table 35: Argentina Agricultural Wastewater Treatment Market Revenue (Million) Forecast, by Application 2020 & 2033
- Table 36: Rest of South America Agricultural Wastewater Treatment Market Revenue (Million) Forecast, by Application 2020 & 2033
- Table 37: Global Agricultural Wastewater Treatment Market Revenue Million Forecast, by Technology 2020 & 2033
- Table 38: Global Agricultural Wastewater Treatment Market Revenue Million Forecast, by Pollutant Source 2020 & 2033
- Table 39: Global Agricultural Wastewater Treatment Market Revenue Million Forecast, by Application 2020 & 2033
- Table 40: Global Agricultural Wastewater Treatment Market Revenue Million Forecast, by Country 2020 & 2033
- Table 41: Saudi Arabia Agricultural Wastewater Treatment Market Revenue (Million) Forecast, by Application 2020 & 2033
- Table 42: South Africa Agricultural Wastewater Treatment Market Revenue (Million) Forecast, by Application 2020 & 2033
- Table 43: Rest of Middle East and Africa Agricultural Wastewater Treatment Market Revenue (Million) Forecast, by Application 2020 & 2033
Frequently Asked Questions
1. What is the projected Compound Annual Growth Rate (CAGR) of the Agricultural Wastewater Treatment Market?
The projected CAGR is approximately 4.75%.
2. Which companies are prominent players in the Agricultural Wastewater Treatment Market?
Key companies in the market include OriginClear, Nouryon, Lindsay Corporation, Evoqua Water Technologies LLC, Jacobs, Aquatech International LLC, BASF SE, IDE, SUEZ, DuPont, Organo Corporation, Veolia*List Not Exhaustive, AECOM, Louis Berger International.
3. What are the main segments of the Agricultural Wastewater Treatment Market?
The market segments include Technology, Pollutant Source, Application.
4. Can you provide details about the market size?
The market size is estimated to be USD 2.39 Million as of 2022.
5. What are some drivers contributing to market growth?
Rapidly Diminishing Fresh Water Resources; Rising Agricultural Water Demand; Other Drivers.
6. What are the notable trends driving market growth?
Non-Crop Segment to Dominate the Market.
7. Are there any restraints impacting market growth?
Dearth of Awareness regarding Agriculture Wastewater Treatment; Other Restraints.
8. Can you provide examples of recent developments in the market?
September 2022: Lanxess commissioned a new wastewater treatment plant at its Belgium Kallo/Antwerp site. The company invested around EUR 12 million (USD 12.65 million) in the plant, having a treatment capacity of around 260,000 liters of wastewater per hour.
9. What pricing options are available for accessing the report?
Pricing options include single-user, multi-user, and enterprise licenses priced at USD 4750, USD 5250, and USD 8750 respectively.
10. Is the market size provided in terms of value or volume?
The market size is provided in terms of value, measured in Million.
11. Are there any specific market keywords associated with the report?
Yes, the market keyword associated with the report is "Agricultural Wastewater Treatment Market," which aids in identifying and referencing the specific market segment covered.
12. How do I determine which pricing option suits my needs best?
The pricing options vary based on user requirements and access needs. Individual users may opt for single-user licenses, while businesses requiring broader access may choose multi-user or enterprise licenses for cost-effective access to the report.
13. Are there any additional resources or data provided in the Agricultural Wastewater Treatment Market report?
While the report offers comprehensive insights, it's advisable to review the specific contents or supplementary materials provided to ascertain if additional resources or data are available.
14. How can I stay updated on further developments or reports in the Agricultural Wastewater Treatment Market?
To stay informed about further developments, trends, and reports in the Agricultural Wastewater Treatment Market, consider subscribing to industry newsletters, following relevant companies and organizations, or regularly checking reputable industry news sources and publications.
Methodology
Step 1 - Identification of Relevant Samples Size from Population Database


Step 2 - Approaches for Defining Global Market Size (Value, Volume* & Price*)

Note*: In applicable scenarios
Step 3 - Data Sources
Primary Research
- Web Analytics
- Survey Reports
- Research Institute
- Latest Research Reports
- Opinion Leaders
Secondary Research
- Annual Reports
- White Paper
- Latest Press Release
- Industry Association
- Paid Database
- Investor Presentations

Step 4 - Data Triangulation
Involves using different sources of information in order to increase the validity of a study
These sources are likely to be stakeholders in a program - participants, other researchers, program staff, other community members, and so on.
Then we put all data in single framework & apply various statistical tools to find out the dynamic on the market.
During the analysis stage, feedback from the stakeholder groups would be compared to determine areas of agreement as well as areas of divergence