

Key Insights
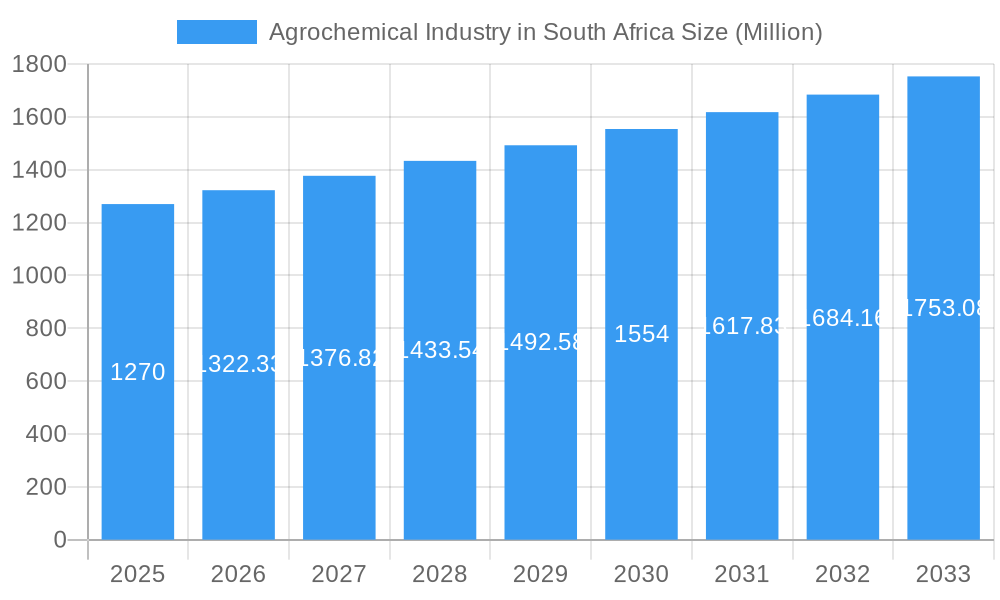
The South African agrochemical market, valued at approximately $1.27 billion in 2025, is projected to experience steady growth, driven by factors such as increasing agricultural production to meet food security needs, the rising adoption of modern farming techniques, and government initiatives supporting agricultural development. The market's Compound Annual Growth Rate (CAGR) of 3.90% from 2025 to 2033 indicates a consistent expansion, although this rate may be influenced by various factors including climate change impacts on yields, fluctuating commodity prices, and the availability of credit for farmers. Key segments within the market include fertilizers, pesticides, and plant growth regulators, with crop-based applications dominating. Significant growth is anticipated in the fruit and vegetable segment, fueled by increasing consumer demand for fresh produce and the expansion of export markets. However, challenges such as water scarcity, soil degradation, and the rising cost of inputs pose potential restraints on market expansion. Competition is intense, with both international giants like BASF, Syngenta, and Bayer, and local players vying for market share. The market's future trajectory will depend on successful strategies to mitigate these challenges, while continuing to invest in research and development of sustainable and high-yield agricultural practices. South Africa's strategic location and commitment to agricultural development makes it a key market within the African continent, attracting further investment and growth in the agrochemical sector.
Agrochemical Industry in South Africa Market Size (In Billion)
The competitive landscape is characterized by a mix of multinational corporations and local distributors. Multinationals possess advanced technologies and strong distribution networks, while local companies often have a deeper understanding of the local market and specific needs. Future market growth will hinge on the ability of companies to adapt to changing regulatory environments, address sustainability concerns, and offer innovative products that cater to the evolving needs of South African farmers. Factors such as climate change adaptation strategies, government regulations related to pesticide use, and the adoption of precision agriculture technologies will significantly impact the future trajectory of the South African agrochemical market. Specific growth drivers within sub-segments will likely be influenced by government support for specific crops, consumer preferences shifting towards certain produce, and advancements in agricultural technology leading to improved yield and quality.
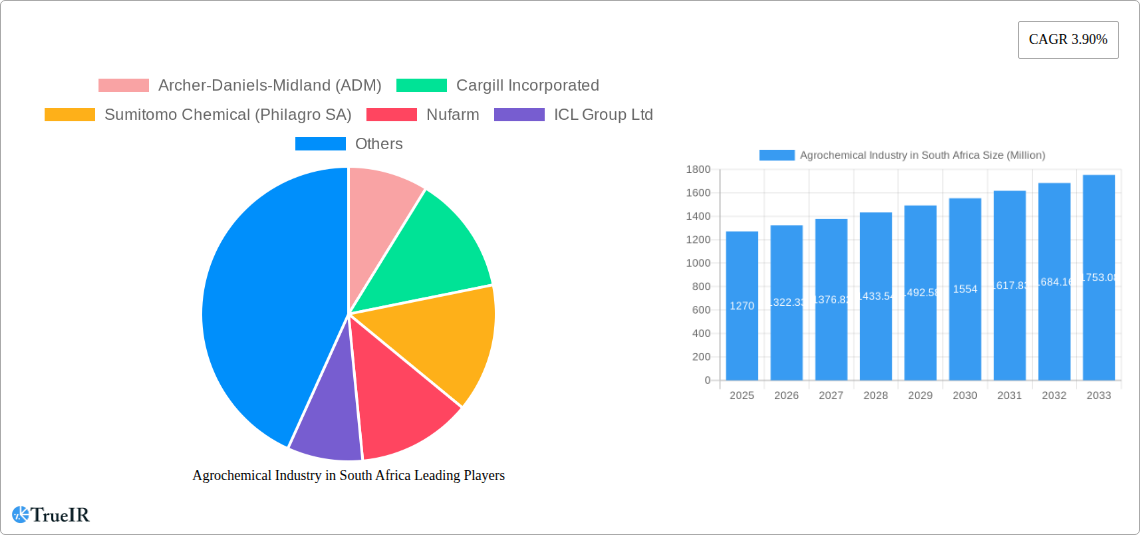
Agrochemical Industry in South Africa Company Market Share
South Africa's Agrochemical Industry: A Comprehensive Market Report (2019-2033)
This dynamic report provides a detailed analysis of the South African agrochemical market, projecting robust growth from 2025 to 2033. It covers market size, key players, segment performance, and future opportunities, offering invaluable insights for businesses, investors, and policymakers. The report uses a robust methodology, integrating historical data (2019-2024), current estimates (2025), and future projections (2025-2033) to deliver a comprehensive overview of this vital sector. Keywords: South Africa Agrochemicals, Fertilizer Market South Africa, Pesticide Market South Africa, Agrochemical Industry South Africa, South Africa Agricultural Chemicals, Agrochemical Market Size South Africa, South Africa Crop Protection.
Agrochemical Industry in South Africa Market Structure & Competitive Landscape
The South African agrochemical market exhibits a moderately concentrated structure, with a Herfindahl-Hirschman Index (HHI) estimated at xx in 2025. Key players like Archer-Daniels-Midland (ADM), Cargill Incorporated, and Sumitomo Chemical (Philagro SA) hold significant market shares, driving innovation and competition. However, the market also accommodates numerous smaller, specialized firms.
- Market Concentration: The HHI suggests a moderately concentrated market, with potential for both consolidation and niche player growth.
- Innovation Drivers: The need for higher yields, pest resistance, and sustainable farming practices pushes innovation in pesticide formulations, fertilizer technologies, and precision application methods.
- Regulatory Impacts: South African regulations on agrochemical registration and usage significantly influence market dynamics, affecting product availability and adoption rates.
- Product Substitutes: The increasing interest in organic farming and biopesticides presents a growing challenge to traditional agrochemicals.
- End-User Segmentation: The market is segmented by farm size, crop type (e.g., maize, sugarcane, fruits), and application method, influencing product demand and pricing strategies.
- M&A Trends: The xx Million in M&A activity recorded between 2019 and 2024 indicates a dynamic market with ongoing consolidation. Future M&A activity is expected to reach xx Million during the forecast period.
Agrochemical Industry in South Africa Market Trends & Opportunities
The South African agrochemical market is projected to experience a Compound Annual Growth Rate (CAGR) of xx% during 2025-2033, driven by several factors. Increasing agricultural production to meet growing food demands, coupled with the adoption of advanced farming techniques, will significantly boost market growth. Furthermore, favorable government policies promoting agricultural modernization and investments in irrigation infrastructure are contributing to this upward trend. Technological advancements such as precision agriculture and the development of environmentally friendly agrochemicals are also creating new opportunities for market expansion. Market penetration rates for specialized products like biopesticides are expected to increase significantly, reaching xx% by 2033. Competitive dynamics are characterized by both intense competition among established players and the emergence of new entrants offering innovative solutions. Consumer preferences are shifting towards sustainable and environmentally responsible agrochemical products, posing both a challenge and an opportunity for businesses to adapt their product portfolios.
Dominant Markets & Segments in Agrochemical Industry in South Africa
The South African agrochemical market is geographically diverse, with xx region/province leading the market due to favorable climatic conditions and high agricultural output.
- Type: Fertilizers represent the largest segment, holding xx% market share in 2025, driven by the demand for enhanced crop yields. Pesticides constitute the second largest segment with xx% market share followed by Adjuvants and Plant Growth Regulators which will reach xx% market share by 2033.
- Application: Crop-based applications dominate the market due to the extensive area under cultivation. However, the non-crop segment including Fruits and Vegetables, Turf and Ornamental Grass is expanding rapidly, reaching xx% of the market share by 2033.
- Key Growth Drivers:
- Favorable government policies: Subsidies and support programs for farmers encourage increased agrochemical usage.
- Expanding agricultural land under irrigation: This increases productivity and demand for agrochemicals.
- Technological advancements: Precise application techniques improve efficiency and reduce environmental impact.
Agrochemical Industry in South Africa Product Analysis
Recent product innovations focus on the development of more efficient and sustainable agrochemicals, such as biological controls, targeted pesticides, and slow-release fertilizers. These advancements contribute to improved crop yields, reduced environmental impact and increased profitability for farmers. The competitive advantage in the South African market hinges on a combination of product efficacy, cost-effectiveness, and environmental compatibility.
Key Drivers, Barriers & Challenges in Agrochemical Industry in South Africa
Key Drivers: Technological advancements in precision farming, coupled with supportive government policies aimed at boosting agricultural productivity, are key drivers. The growing demand for food security in a rapidly expanding population also pushes market growth.
Key Challenges & Restraints: Supply chain disruptions, stringent regulatory approvals, and intense competition from both domestic and international players pose significant challenges. Fluctuations in raw material prices and the environmental impact of agrochemicals further impact the market. The estimated cost of regulatory compliance is approximately xx Million annually, impacting smaller players disproportionately.
Growth Drivers in the Agrochemical Industry in South Africa Market
Technological advancements in precision agriculture, favorable government policies, rising food demands, and expanding irrigation infrastructure are primary growth drivers for the South African agrochemical market.
Challenges Impacting Agrochemical Industry in South Africa Growth
Stringent regulatory compliance costs, supply chain vulnerabilities, and intense competition from both local and international firms pose significant barriers to market growth. Furthermore, environmental concerns related to agrochemical usage are increasingly influencing market dynamics.
Key Players Shaping the Agrochemical Industry in South Africa Market
- Archer-Daniels-Midland (ADM)
- Cargill Incorporated
- Sumitomo Chemical (Philagro SA)
- Nufarm
- ICL Group Ltd
- UPL Limited
- BASF SE
- FMC Corporation
- Sociedad Química y Minera de Chile (SQM)
- Belaruskali
- Sasol Limited
- K+S AG
- ADAMA Ltd
- Uralkal
- CF Industries Holdings
- OCP Group
- Land O' Lakes (Villa Crop Protection (Pty) Ltd)
- Yara International ASA
- Syngenta AG
- Nutrien Ltd
- Corteva Agriscience
- Bayer CropScience AG
Significant Agrochemical Industry in South Africa Industry Milestones
- 2020: Introduction of new regulations regarding pesticide usage.
- 2022: Launch of a new biopesticide by a major player.
- 2023: Acquisition of a smaller agrochemical firm by a multinational company. (Further milestones to be added based on available data).
Future Outlook for Agrochemical Industry in South Africa Market
The South African agrochemical market is poised for continued growth, driven by technological advancements, increased agricultural investment, and government support. Strategic opportunities exist for companies to develop and market sustainable and environmentally friendly agrochemical solutions, catering to the growing demand for responsible agricultural practices. The market's future potential is significant, offering substantial returns for investors and contributing to enhanced food security in the country.
Agrochemical Industry in South Africa Segmentation
- 1. Production Analysis
- 2. Consumption Analysis
- 3. Import Market Analysis (Value & Volume)
- 4. Export Market Analysis (Value & Volume)
- 5. Price Trend Analysis
Agrochemical Industry in South Africa Segmentation By Geography
-
1. North America
- 1.1. United States
- 1.2. Canada
- 1.3. Mexico
-
2. South America
- 2.1. Brazil
- 2.2. Argentina
- 2.3. Rest of South America
-
3. Europe
- 3.1. United Kingdom
- 3.2. Germany
- 3.3. France
- 3.4. Italy
- 3.5. Spain
- 3.6. Russia
- 3.7. Benelux
- 3.8. Nordics
- 3.9. Rest of Europe
-
4. Middle East & Africa
- 4.1. Turkey
- 4.2. Israel
- 4.3. GCC
- 4.4. North Africa
- 4.5. South Africa
- 4.6. Rest of Middle East & Africa
-
5. Asia Pacific
- 5.1. China
- 5.2. India
- 5.3. Japan
- 5.4. South Korea
- 5.5. ASEAN
- 5.6. Oceania
- 5.7. Rest of Asia Pacific
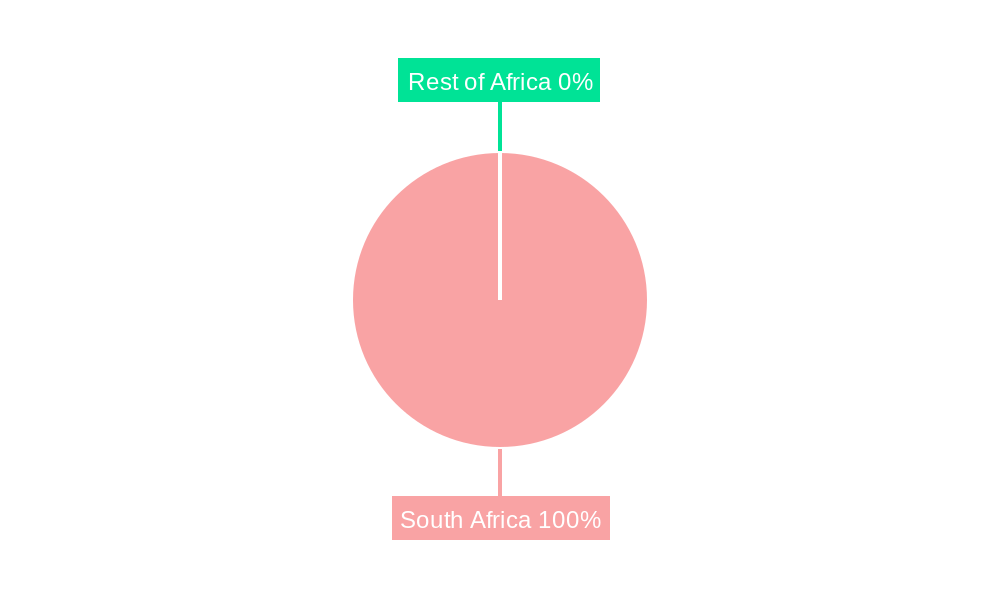
Agrochemical Industry in South Africa Regional Market Share
Geographic Coverage of Agrochemical Industry in South Africa
Agrochemical Industry in South Africa REPORT HIGHLIGHTS
| Aspects | Details |
|---|---|
| Study Period | 2020-2034 |
| Base Year | 2025 |
| Estimated Year | 2026 |
| Forecast Period | 2026-2034 |
| Historical Period | 2020-2025 |
| Growth Rate | CAGR of 3.90% from 2020-2034 |
| Segmentation |
|
Table of Contents
- 1. Introduction
- 1.1. Research Scope
- 1.2. Market Segmentation
- 1.3. Research Methodology
- 1.4. Definitions and Assumptions
- 2. Executive Summary
- 2.1. Introduction
- 3. Market Dynamics
- 3.1. Introduction
- 3.2. Market Drivers
- 3.2.1. Adoption of Organic and Eco-friendly Farming Practices; Declining Area of Arable Land and Rising Food Security Concerns
- 3.3. Market Restrains
- 3.3.1. High Demand for Conventional and Synthetic Products; Lack of Awareness and Other Factors Limiting the Adoption of Agricultural Inoculants
- 3.4. Market Trends
- 3.4.1. Increasing Adoption of Bio-based Agrochemicals
- 4. Market Factor Analysis
- 4.1. Porters Five Forces
- 4.2. Supply/Value Chain
- 4.3. PESTEL analysis
- 4.4. Market Entropy
- 4.5. Patent/Trademark Analysis
- 5. Global Agrochemical Industry in South Africa Analysis, Insights and Forecast, 2020-2032
- 5.1. Market Analysis, Insights and Forecast - by Production Analysis
- 5.2. Market Analysis, Insights and Forecast - by Consumption Analysis
- 5.3. Market Analysis, Insights and Forecast - by Import Market Analysis (Value & Volume)
- 5.4. Market Analysis, Insights and Forecast - by Export Market Analysis (Value & Volume)
- 5.5. Market Analysis, Insights and Forecast - by Price Trend Analysis
- 5.6. Market Analysis, Insights and Forecast - by Region
- 5.6.1. North America
- 5.6.2. South America
- 5.6.3. Europe
- 5.6.4. Middle East & Africa
- 5.6.5. Asia Pacific
- 5.1. Market Analysis, Insights and Forecast - by Production Analysis
- 6. North America Agrochemical Industry in South Africa Analysis, Insights and Forecast, 2020-2032
- 6.1. Market Analysis, Insights and Forecast - by Production Analysis
- 6.2. Market Analysis, Insights and Forecast - by Consumption Analysis
- 6.3. Market Analysis, Insights and Forecast - by Import Market Analysis (Value & Volume)
- 6.4. Market Analysis, Insights and Forecast - by Export Market Analysis (Value & Volume)
- 6.5. Market Analysis, Insights and Forecast - by Price Trend Analysis
- 6.1. Market Analysis, Insights and Forecast - by Production Analysis
- 7. South America Agrochemical Industry in South Africa Analysis, Insights and Forecast, 2020-2032
- 7.1. Market Analysis, Insights and Forecast - by Production Analysis
- 7.2. Market Analysis, Insights and Forecast - by Consumption Analysis
- 7.3. Market Analysis, Insights and Forecast - by Import Market Analysis (Value & Volume)
- 7.4. Market Analysis, Insights and Forecast - by Export Market Analysis (Value & Volume)
- 7.5. Market Analysis, Insights and Forecast - by Price Trend Analysis
- 7.1. Market Analysis, Insights and Forecast - by Production Analysis
- 8. Europe Agrochemical Industry in South Africa Analysis, Insights and Forecast, 2020-2032
- 8.1. Market Analysis, Insights and Forecast - by Production Analysis
- 8.2. Market Analysis, Insights and Forecast - by Consumption Analysis
- 8.3. Market Analysis, Insights and Forecast - by Import Market Analysis (Value & Volume)
- 8.4. Market Analysis, Insights and Forecast - by Export Market Analysis (Value & Volume)
- 8.5. Market Analysis, Insights and Forecast - by Price Trend Analysis
- 8.1. Market Analysis, Insights and Forecast - by Production Analysis
- 9. Middle East & Africa Agrochemical Industry in South Africa Analysis, Insights and Forecast, 2020-2032
- 9.1. Market Analysis, Insights and Forecast - by Production Analysis
- 9.2. Market Analysis, Insights and Forecast - by Consumption Analysis
- 9.3. Market Analysis, Insights and Forecast - by Import Market Analysis (Value & Volume)
- 9.4. Market Analysis, Insights and Forecast - by Export Market Analysis (Value & Volume)
- 9.5. Market Analysis, Insights and Forecast - by Price Trend Analysis
- 9.1. Market Analysis, Insights and Forecast - by Production Analysis
- 10. Asia Pacific Agrochemical Industry in South Africa Analysis, Insights and Forecast, 2020-2032
- 10.1. Market Analysis, Insights and Forecast - by Production Analysis
- 10.2. Market Analysis, Insights and Forecast - by Consumption Analysis
- 10.3. Market Analysis, Insights and Forecast - by Import Market Analysis (Value & Volume)
- 10.4. Market Analysis, Insights and Forecast - by Export Market Analysis (Value & Volume)
- 10.5. Market Analysis, Insights and Forecast - by Price Trend Analysis
- 10.1. Market Analysis, Insights and Forecast - by Production Analysis
- 11. Competitive Analysis
- 11.1. Global Market Share Analysis 2025
- 11.2. Company Profiles
- 11.2.1 Archer-Daniels-Midland (ADM)
- 11.2.1.1. Overview
- 11.2.1.2. Products
- 11.2.1.3. SWOT Analysis
- 11.2.1.4. Recent Developments
- 11.2.1.5. Financials (Based on Availability)
- 11.2.2 Cargill Incorporated
- 11.2.2.1. Overview
- 11.2.2.2. Products
- 11.2.2.3. SWOT Analysis
- 11.2.2.4. Recent Developments
- 11.2.2.5. Financials (Based on Availability)
- 11.2.3 Sumitomo Chemical (Philagro SA)
- 11.2.3.1. Overview
- 11.2.3.2. Products
- 11.2.3.3. SWOT Analysis
- 11.2.3.4. Recent Developments
- 11.2.3.5. Financials (Based on Availability)
- 11.2.4 Nufarm
- 11.2.4.1. Overview
- 11.2.4.2. Products
- 11.2.4.3. SWOT Analysis
- 11.2.4.4. Recent Developments
- 11.2.4.5. Financials (Based on Availability)
- 11.2.5 ICL Group Ltd
- 11.2.5.1. Overview
- 11.2.5.2. Products
- 11.2.5.3. SWOT Analysis
- 11.2.5.4. Recent Developments
- 11.2.5.5. Financials (Based on Availability)
- 11.2.6 UPL Limited
- 11.2.6.1. Overview
- 11.2.6.2. Products
- 11.2.6.3. SWOT Analysis
- 11.2.6.4. Recent Developments
- 11.2.6.5. Financials (Based on Availability)
- 11.2.7 BASF SE
- 11.2.7.1. Overview
- 11.2.7.2. Products
- 11.2.7.3. SWOT Analysis
- 11.2.7.4. Recent Developments
- 11.2.7.5. Financials (Based on Availability)
- 11.2.8 FMC Corporation
- 11.2.8.1. Overview
- 11.2.8.2. Products
- 11.2.8.3. SWOT Analysis
- 11.2.8.4. Recent Developments
- 11.2.8.5. Financials (Based on Availability)
- 11.2.9 Sociedad Química y Minera de Chile (SQM)
- 11.2.9.1. Overview
- 11.2.9.2. Products
- 11.2.9.3. SWOT Analysis
- 11.2.9.4. Recent Developments
- 11.2.9.5. Financials (Based on Availability)
- 11.2.10 Belaruskali
- 11.2.10.1. Overview
- 11.2.10.2. Products
- 11.2.10.3. SWOT Analysis
- 11.2.10.4. Recent Developments
- 11.2.10.5. Financials (Based on Availability)
- 11.2.11 Sasol Limited
- 11.2.11.1. Overview
- 11.2.11.2. Products
- 11.2.11.3. SWOT Analysis
- 11.2.11.4. Recent Developments
- 11.2.11.5. Financials (Based on Availability)
- 11.2.12 K+S AG
- 11.2.12.1. Overview
- 11.2.12.2. Products
- 11.2.12.3. SWOT Analysis
- 11.2.12.4. Recent Developments
- 11.2.12.5. Financials (Based on Availability)
- 11.2.13 ADAMA Ltd
- 11.2.13.1. Overview
- 11.2.13.2. Products
- 11.2.13.3. SWOT Analysis
- 11.2.13.4. Recent Developments
- 11.2.13.5. Financials (Based on Availability)
- 11.2.14 Uralkal
- 11.2.14.1. Overview
- 11.2.14.2. Products
- 11.2.14.3. SWOT Analysis
- 11.2.14.4. Recent Developments
- 11.2.14.5. Financials (Based on Availability)
- 11.2.15 CF Industries Holdings
- 11.2.15.1. Overview
- 11.2.15.2. Products
- 11.2.15.3. SWOT Analysis
- 11.2.15.4. Recent Developments
- 11.2.15.5. Financials (Based on Availability)
- 11.2.16 OCP Group
- 11.2.16.1. Overview
- 11.2.16.2. Products
- 11.2.16.3. SWOT Analysis
- 11.2.16.4. Recent Developments
- 11.2.16.5. Financials (Based on Availability)
- 11.2.17 Land O' Lakes (Villa Crop Protection (Pty) Ltd
- 11.2.17.1. Overview
- 11.2.17.2. Products
- 11.2.17.3. SWOT Analysis
- 11.2.17.4. Recent Developments
- 11.2.17.5. Financials (Based on Availability)
- 11.2.18 Yara International ASA
- 11.2.18.1. Overview
- 11.2.18.2. Products
- 11.2.18.3. SWOT Analysis
- 11.2.18.4. Recent Developments
- 11.2.18.5. Financials (Based on Availability)
- 11.2.19 Syngenta AG
- 11.2.19.1. Overview
- 11.2.19.2. Products
- 11.2.19.3. SWOT Analysis
- 11.2.19.4. Recent Developments
- 11.2.19.5. Financials (Based on Availability)
- 11.2.20 Nutrien Ltd
- 11.2.20.1. Overview
- 11.2.20.2. Products
- 11.2.20.3. SWOT Analysis
- 11.2.20.4. Recent Developments
- 11.2.20.5. Financials (Based on Availability)
- 11.2.21 Corteva Agriscience
- 11.2.21.1. Overview
- 11.2.21.2. Products
- 11.2.21.3. SWOT Analysis
- 11.2.21.4. Recent Developments
- 11.2.21.5. Financials (Based on Availability)
- 11.2.22 Bayer CropScience AG
- 11.2.22.1. Overview
- 11.2.22.2. Products
- 11.2.22.3. SWOT Analysis
- 11.2.22.4. Recent Developments
- 11.2.22.5. Financials (Based on Availability)
- 11.2.1 Archer-Daniels-Midland (ADM)
List of Figures
- Figure 1: Global Agrochemical Industry in South Africa Revenue Breakdown (Million, %) by Region 2025 & 2033
- Figure 2: North America Agrochemical Industry in South Africa Revenue (Million), by Production Analysis 2025 & 2033
- Figure 3: North America Agrochemical Industry in South Africa Revenue Share (%), by Production Analysis 2025 & 2033
- Figure 4: North America Agrochemical Industry in South Africa Revenue (Million), by Consumption Analysis 2025 & 2033
- Figure 5: North America Agrochemical Industry in South Africa Revenue Share (%), by Consumption Analysis 2025 & 2033
- Figure 6: North America Agrochemical Industry in South Africa Revenue (Million), by Import Market Analysis (Value & Volume) 2025 & 2033
- Figure 7: North America Agrochemical Industry in South Africa Revenue Share (%), by Import Market Analysis (Value & Volume) 2025 & 2033
- Figure 8: North America Agrochemical Industry in South Africa Revenue (Million), by Export Market Analysis (Value & Volume) 2025 & 2033
- Figure 9: North America Agrochemical Industry in South Africa Revenue Share (%), by Export Market Analysis (Value & Volume) 2025 & 2033
- Figure 10: North America Agrochemical Industry in South Africa Revenue (Million), by Price Trend Analysis 2025 & 2033
- Figure 11: North America Agrochemical Industry in South Africa Revenue Share (%), by Price Trend Analysis 2025 & 2033
- Figure 12: North America Agrochemical Industry in South Africa Revenue (Million), by Country 2025 & 2033
- Figure 13: North America Agrochemical Industry in South Africa Revenue Share (%), by Country 2025 & 2033
- Figure 14: South America Agrochemical Industry in South Africa Revenue (Million), by Production Analysis 2025 & 2033
- Figure 15: South America Agrochemical Industry in South Africa Revenue Share (%), by Production Analysis 2025 & 2033
- Figure 16: South America Agrochemical Industry in South Africa Revenue (Million), by Consumption Analysis 2025 & 2033
- Figure 17: South America Agrochemical Industry in South Africa Revenue Share (%), by Consumption Analysis 2025 & 2033
- Figure 18: South America Agrochemical Industry in South Africa Revenue (Million), by Import Market Analysis (Value & Volume) 2025 & 2033
- Figure 19: South America Agrochemical Industry in South Africa Revenue Share (%), by Import Market Analysis (Value & Volume) 2025 & 2033
- Figure 20: South America Agrochemical Industry in South Africa Revenue (Million), by Export Market Analysis (Value & Volume) 2025 & 2033
- Figure 21: South America Agrochemical Industry in South Africa Revenue Share (%), by Export Market Analysis (Value & Volume) 2025 & 2033
- Figure 22: South America Agrochemical Industry in South Africa Revenue (Million), by Price Trend Analysis 2025 & 2033
- Figure 23: South America Agrochemical Industry in South Africa Revenue Share (%), by Price Trend Analysis 2025 & 2033
- Figure 24: South America Agrochemical Industry in South Africa Revenue (Million), by Country 2025 & 2033
- Figure 25: South America Agrochemical Industry in South Africa Revenue Share (%), by Country 2025 & 2033
- Figure 26: Europe Agrochemical Industry in South Africa Revenue (Million), by Production Analysis 2025 & 2033
- Figure 27: Europe Agrochemical Industry in South Africa Revenue Share (%), by Production Analysis 2025 & 2033
- Figure 28: Europe Agrochemical Industry in South Africa Revenue (Million), by Consumption Analysis 2025 & 2033
- Figure 29: Europe Agrochemical Industry in South Africa Revenue Share (%), by Consumption Analysis 2025 & 2033
- Figure 30: Europe Agrochemical Industry in South Africa Revenue (Million), by Import Market Analysis (Value & Volume) 2025 & 2033
- Figure 31: Europe Agrochemical Industry in South Africa Revenue Share (%), by Import Market Analysis (Value & Volume) 2025 & 2033
- Figure 32: Europe Agrochemical Industry in South Africa Revenue (Million), by Export Market Analysis (Value & Volume) 2025 & 2033
- Figure 33: Europe Agrochemical Industry in South Africa Revenue Share (%), by Export Market Analysis (Value & Volume) 2025 & 2033
- Figure 34: Europe Agrochemical Industry in South Africa Revenue (Million), by Price Trend Analysis 2025 & 2033
- Figure 35: Europe Agrochemical Industry in South Africa Revenue Share (%), by Price Trend Analysis 2025 & 2033
- Figure 36: Europe Agrochemical Industry in South Africa Revenue (Million), by Country 2025 & 2033
- Figure 37: Europe Agrochemical Industry in South Africa Revenue Share (%), by Country 2025 & 2033
- Figure 38: Middle East & Africa Agrochemical Industry in South Africa Revenue (Million), by Production Analysis 2025 & 2033
- Figure 39: Middle East & Africa Agrochemical Industry in South Africa Revenue Share (%), by Production Analysis 2025 & 2033
- Figure 40: Middle East & Africa Agrochemical Industry in South Africa Revenue (Million), by Consumption Analysis 2025 & 2033
- Figure 41: Middle East & Africa Agrochemical Industry in South Africa Revenue Share (%), by Consumption Analysis 2025 & 2033
- Figure 42: Middle East & Africa Agrochemical Industry in South Africa Revenue (Million), by Import Market Analysis (Value & Volume) 2025 & 2033
- Figure 43: Middle East & Africa Agrochemical Industry in South Africa Revenue Share (%), by Import Market Analysis (Value & Volume) 2025 & 2033
- Figure 44: Middle East & Africa Agrochemical Industry in South Africa Revenue (Million), by Export Market Analysis (Value & Volume) 2025 & 2033
- Figure 45: Middle East & Africa Agrochemical Industry in South Africa Revenue Share (%), by Export Market Analysis (Value & Volume) 2025 & 2033
- Figure 46: Middle East & Africa Agrochemical Industry in South Africa Revenue (Million), by Price Trend Analysis 2025 & 2033
- Figure 47: Middle East & Africa Agrochemical Industry in South Africa Revenue Share (%), by Price Trend Analysis 2025 & 2033
- Figure 48: Middle East & Africa Agrochemical Industry in South Africa Revenue (Million), by Country 2025 & 2033
- Figure 49: Middle East & Africa Agrochemical Industry in South Africa Revenue Share (%), by Country 2025 & 2033
- Figure 50: Asia Pacific Agrochemical Industry in South Africa Revenue (Million), by Production Analysis 2025 & 2033
- Figure 51: Asia Pacific Agrochemical Industry in South Africa Revenue Share (%), by Production Analysis 2025 & 2033
- Figure 52: Asia Pacific Agrochemical Industry in South Africa Revenue (Million), by Consumption Analysis 2025 & 2033
- Figure 53: Asia Pacific Agrochemical Industry in South Africa Revenue Share (%), by Consumption Analysis 2025 & 2033
- Figure 54: Asia Pacific Agrochemical Industry in South Africa Revenue (Million), by Import Market Analysis (Value & Volume) 2025 & 2033
- Figure 55: Asia Pacific Agrochemical Industry in South Africa Revenue Share (%), by Import Market Analysis (Value & Volume) 2025 & 2033
- Figure 56: Asia Pacific Agrochemical Industry in South Africa Revenue (Million), by Export Market Analysis (Value & Volume) 2025 & 2033
- Figure 57: Asia Pacific Agrochemical Industry in South Africa Revenue Share (%), by Export Market Analysis (Value & Volume) 2025 & 2033
- Figure 58: Asia Pacific Agrochemical Industry in South Africa Revenue (Million), by Price Trend Analysis 2025 & 2033
- Figure 59: Asia Pacific Agrochemical Industry in South Africa Revenue Share (%), by Price Trend Analysis 2025 & 2033
- Figure 60: Asia Pacific Agrochemical Industry in South Africa Revenue (Million), by Country 2025 & 2033
- Figure 61: Asia Pacific Agrochemical Industry in South Africa Revenue Share (%), by Country 2025 & 2033
List of Tables
- Table 1: Global Agrochemical Industry in South Africa Revenue Million Forecast, by Production Analysis 2020 & 2033
- Table 2: Global Agrochemical Industry in South Africa Revenue Million Forecast, by Consumption Analysis 2020 & 2033
- Table 3: Global Agrochemical Industry in South Africa Revenue Million Forecast, by Import Market Analysis (Value & Volume) 2020 & 2033
- Table 4: Global Agrochemical Industry in South Africa Revenue Million Forecast, by Export Market Analysis (Value & Volume) 2020 & 2033
- Table 5: Global Agrochemical Industry in South Africa Revenue Million Forecast, by Price Trend Analysis 2020 & 2033
- Table 6: Global Agrochemical Industry in South Africa Revenue Million Forecast, by Region 2020 & 2033
- Table 7: Global Agrochemical Industry in South Africa Revenue Million Forecast, by Production Analysis 2020 & 2033
- Table 8: Global Agrochemical Industry in South Africa Revenue Million Forecast, by Consumption Analysis 2020 & 2033
- Table 9: Global Agrochemical Industry in South Africa Revenue Million Forecast, by Import Market Analysis (Value & Volume) 2020 & 2033
- Table 10: Global Agrochemical Industry in South Africa Revenue Million Forecast, by Export Market Analysis (Value & Volume) 2020 & 2033
- Table 11: Global Agrochemical Industry in South Africa Revenue Million Forecast, by Price Trend Analysis 2020 & 2033
- Table 12: Global Agrochemical Industry in South Africa Revenue Million Forecast, by Country 2020 & 2033
- Table 13: United States Agrochemical Industry in South Africa Revenue (Million) Forecast, by Application 2020 & 2033
- Table 14: Canada Agrochemical Industry in South Africa Revenue (Million) Forecast, by Application 2020 & 2033
- Table 15: Mexico Agrochemical Industry in South Africa Revenue (Million) Forecast, by Application 2020 & 2033
- Table 16: Global Agrochemical Industry in South Africa Revenue Million Forecast, by Production Analysis 2020 & 2033
- Table 17: Global Agrochemical Industry in South Africa Revenue Million Forecast, by Consumption Analysis 2020 & 2033
- Table 18: Global Agrochemical Industry in South Africa Revenue Million Forecast, by Import Market Analysis (Value & Volume) 2020 & 2033
- Table 19: Global Agrochemical Industry in South Africa Revenue Million Forecast, by Export Market Analysis (Value & Volume) 2020 & 2033
- Table 20: Global Agrochemical Industry in South Africa Revenue Million Forecast, by Price Trend Analysis 2020 & 2033
- Table 21: Global Agrochemical Industry in South Africa Revenue Million Forecast, by Country 2020 & 2033
- Table 22: Brazil Agrochemical Industry in South Africa Revenue (Million) Forecast, by Application 2020 & 2033
- Table 23: Argentina Agrochemical Industry in South Africa Revenue (Million) Forecast, by Application 2020 & 2033
- Table 24: Rest of South America Agrochemical Industry in South Africa Revenue (Million) Forecast, by Application 2020 & 2033
- Table 25: Global Agrochemical Industry in South Africa Revenue Million Forecast, by Production Analysis 2020 & 2033
- Table 26: Global Agrochemical Industry in South Africa Revenue Million Forecast, by Consumption Analysis 2020 & 2033
- Table 27: Global Agrochemical Industry in South Africa Revenue Million Forecast, by Import Market Analysis (Value & Volume) 2020 & 2033
- Table 28: Global Agrochemical Industry in South Africa Revenue Million Forecast, by Export Market Analysis (Value & Volume) 2020 & 2033
- Table 29: Global Agrochemical Industry in South Africa Revenue Million Forecast, by Price Trend Analysis 2020 & 2033
- Table 30: Global Agrochemical Industry in South Africa Revenue Million Forecast, by Country 2020 & 2033
- Table 31: United Kingdom Agrochemical Industry in South Africa Revenue (Million) Forecast, by Application 2020 & 2033
- Table 32: Germany Agrochemical Industry in South Africa Revenue (Million) Forecast, by Application 2020 & 2033
- Table 33: France Agrochemical Industry in South Africa Revenue (Million) Forecast, by Application 2020 & 2033
- Table 34: Italy Agrochemical Industry in South Africa Revenue (Million) Forecast, by Application 2020 & 2033
- Table 35: Spain Agrochemical Industry in South Africa Revenue (Million) Forecast, by Application 2020 & 2033
- Table 36: Russia Agrochemical Industry in South Africa Revenue (Million) Forecast, by Application 2020 & 2033
- Table 37: Benelux Agrochemical Industry in South Africa Revenue (Million) Forecast, by Application 2020 & 2033
- Table 38: Nordics Agrochemical Industry in South Africa Revenue (Million) Forecast, by Application 2020 & 2033
- Table 39: Rest of Europe Agrochemical Industry in South Africa Revenue (Million) Forecast, by Application 2020 & 2033
- Table 40: Global Agrochemical Industry in South Africa Revenue Million Forecast, by Production Analysis 2020 & 2033
- Table 41: Global Agrochemical Industry in South Africa Revenue Million Forecast, by Consumption Analysis 2020 & 2033
- Table 42: Global Agrochemical Industry in South Africa Revenue Million Forecast, by Import Market Analysis (Value & Volume) 2020 & 2033
- Table 43: Global Agrochemical Industry in South Africa Revenue Million Forecast, by Export Market Analysis (Value & Volume) 2020 & 2033
- Table 44: Global Agrochemical Industry in South Africa Revenue Million Forecast, by Price Trend Analysis 2020 & 2033
- Table 45: Global Agrochemical Industry in South Africa Revenue Million Forecast, by Country 2020 & 2033
- Table 46: Turkey Agrochemical Industry in South Africa Revenue (Million) Forecast, by Application 2020 & 2033
- Table 47: Israel Agrochemical Industry in South Africa Revenue (Million) Forecast, by Application 2020 & 2033
- Table 48: GCC Agrochemical Industry in South Africa Revenue (Million) Forecast, by Application 2020 & 2033
- Table 49: North Africa Agrochemical Industry in South Africa Revenue (Million) Forecast, by Application 2020 & 2033
- Table 50: South Africa Agrochemical Industry in South Africa Revenue (Million) Forecast, by Application 2020 & 2033
- Table 51: Rest of Middle East & Africa Agrochemical Industry in South Africa Revenue (Million) Forecast, by Application 2020 & 2033
- Table 52: Global Agrochemical Industry in South Africa Revenue Million Forecast, by Production Analysis 2020 & 2033
- Table 53: Global Agrochemical Industry in South Africa Revenue Million Forecast, by Consumption Analysis 2020 & 2033
- Table 54: Global Agrochemical Industry in South Africa Revenue Million Forecast, by Import Market Analysis (Value & Volume) 2020 & 2033
- Table 55: Global Agrochemical Industry in South Africa Revenue Million Forecast, by Export Market Analysis (Value & Volume) 2020 & 2033
- Table 56: Global Agrochemical Industry in South Africa Revenue Million Forecast, by Price Trend Analysis 2020 & 2033
- Table 57: Global Agrochemical Industry in South Africa Revenue Million Forecast, by Country 2020 & 2033
- Table 58: China Agrochemical Industry in South Africa Revenue (Million) Forecast, by Application 2020 & 2033
- Table 59: India Agrochemical Industry in South Africa Revenue (Million) Forecast, by Application 2020 & 2033
- Table 60: Japan Agrochemical Industry in South Africa Revenue (Million) Forecast, by Application 2020 & 2033
- Table 61: South Korea Agrochemical Industry in South Africa Revenue (Million) Forecast, by Application 2020 & 2033
- Table 62: ASEAN Agrochemical Industry in South Africa Revenue (Million) Forecast, by Application 2020 & 2033
- Table 63: Oceania Agrochemical Industry in South Africa Revenue (Million) Forecast, by Application 2020 & 2033
- Table 64: Rest of Asia Pacific Agrochemical Industry in South Africa Revenue (Million) Forecast, by Application 2020 & 2033
Frequently Asked Questions
1. What is the projected Compound Annual Growth Rate (CAGR) of the Agrochemical Industry in South Africa?
The projected CAGR is approximately 3.90%.
2. Which companies are prominent players in the Agrochemical Industry in South Africa?
Key companies in the market include Archer-Daniels-Midland (ADM), Cargill Incorporated, Sumitomo Chemical (Philagro SA), Nufarm, ICL Group Ltd, UPL Limited, BASF SE, FMC Corporation, Sociedad Química y Minera de Chile (SQM), Belaruskali, Sasol Limited, K+S AG, ADAMA Ltd, Uralkal, CF Industries Holdings, OCP Group, Land O' Lakes (Villa Crop Protection (Pty) Ltd, Yara International ASA, Syngenta AG, Nutrien Ltd, Corteva Agriscience, Bayer CropScience AG.
3. What are the main segments of the Agrochemical Industry in South Africa?
The market segments include Production Analysis, Consumption Analysis, Import Market Analysis (Value & Volume), Export Market Analysis (Value & Volume), Price Trend Analysis.
4. Can you provide details about the market size?
The market size is estimated to be USD 1.27 Million as of 2022.
5. What are some drivers contributing to market growth?
Adoption of Organic and Eco-friendly Farming Practices; Declining Area of Arable Land and Rising Food Security Concerns.
6. What are the notable trends driving market growth?
Increasing Adoption of Bio-based Agrochemicals.
7. Are there any restraints impacting market growth?
High Demand for Conventional and Synthetic Products; Lack of Awareness and Other Factors Limiting the Adoption of Agricultural Inoculants.
8. Can you provide examples of recent developments in the market?
N/A
9. What pricing options are available for accessing the report?
Pricing options include single-user, multi-user, and enterprise licenses priced at USD 3800, USD 4500, and USD 5800 respectively.
10. Is the market size provided in terms of value or volume?
The market size is provided in terms of value, measured in Million.
11. Are there any specific market keywords associated with the report?
Yes, the market keyword associated with the report is "Agrochemical Industry in South Africa," which aids in identifying and referencing the specific market segment covered.
12. How do I determine which pricing option suits my needs best?
The pricing options vary based on user requirements and access needs. Individual users may opt for single-user licenses, while businesses requiring broader access may choose multi-user or enterprise licenses for cost-effective access to the report.
13. Are there any additional resources or data provided in the Agrochemical Industry in South Africa report?
While the report offers comprehensive insights, it's advisable to review the specific contents or supplementary materials provided to ascertain if additional resources or data are available.
14. How can I stay updated on further developments or reports in the Agrochemical Industry in South Africa?
To stay informed about further developments, trends, and reports in the Agrochemical Industry in South Africa, consider subscribing to industry newsletters, following relevant companies and organizations, or regularly checking reputable industry news sources and publications.
Methodology
Step 1 - Identification of Relevant Samples Size from Population Database


Step 2 - Approaches for Defining Global Market Size (Value, Volume* & Price*)

Note*: In applicable scenarios
Step 3 - Data Sources
Primary Research
- Web Analytics
- Survey Reports
- Research Institute
- Latest Research Reports
- Opinion Leaders
Secondary Research
- Annual Reports
- White Paper
- Latest Press Release
- Industry Association
- Paid Database
- Investor Presentations

Step 4 - Data Triangulation
Involves using different sources of information in order to increase the validity of a study
These sources are likely to be stakeholders in a program - participants, other researchers, program staff, other community members, and so on.
Then we put all data in single framework & apply various statistical tools to find out the dynamic on the market.
During the analysis stage, feedback from the stakeholder groups would be compared to determine areas of agreement as well as areas of divergence