

Key Insights
The global ammonia market, projected to reach 68840 million in 2025, is forecast to grow at a compound annual growth rate (CAGR) of 1.2% from 2025 to 2033. This expansion is propelled by robust demand from the agricultural sector, driven by increasing global food requirements. The fertilizer industry's substantial reliance on ammonia as a primary nitrogen source is a key growth catalyst. Furthermore, expanding industrial applications across textiles, refrigeration, and water treatment sectors contribute to market vitality. Innovations in production efficiency and environmental impact reduction are shaping market dynamics. However, volatility in feedstock prices, particularly natural gas, and stringent environmental regulations present notable challenges. The market is segmented by type (liquid, gas) and end-user industry (agriculture, textiles, mining, pharmaceutical, refrigeration, and others). Key market participants like BASF, Yara, and CF Industries are instrumental in shaping the competitive environment through strategic investments and technological advancements. The Asia-Pacific and North America regions are anticipated to lead market dominance owing to their significant agricultural bases and industrial infrastructure.
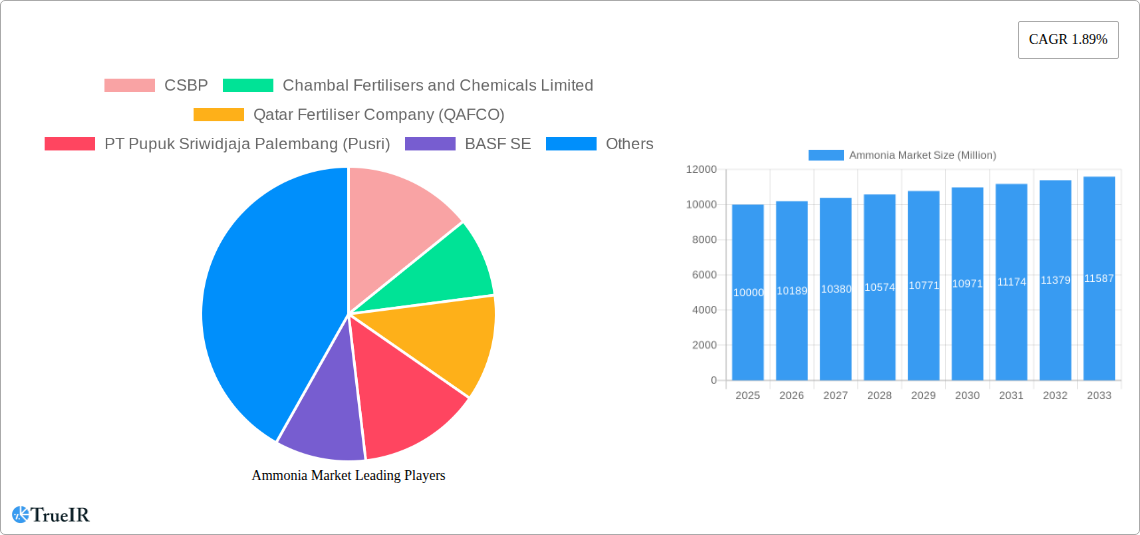
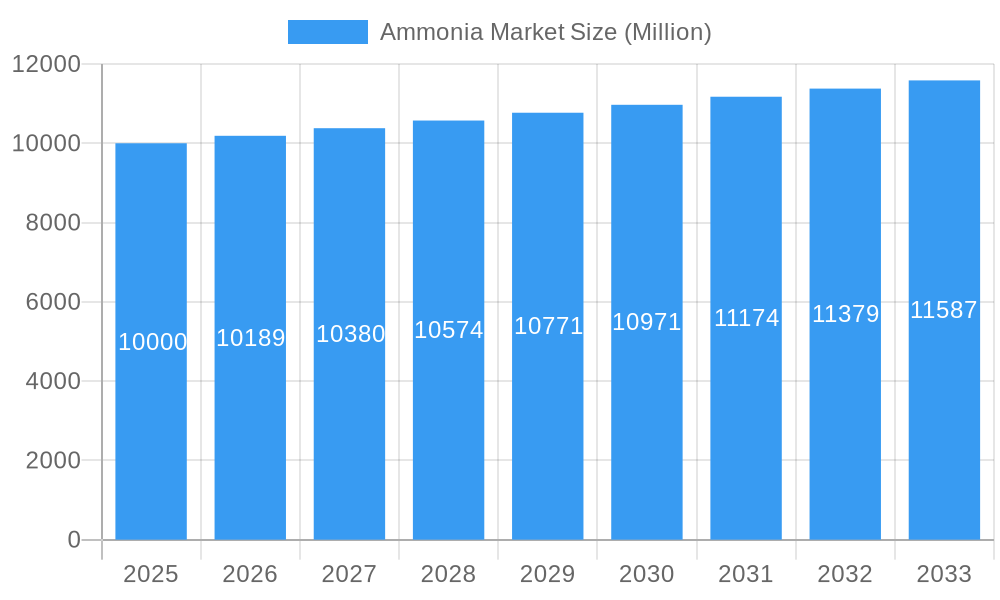
Ammonia Market Market Size (In Billion)
The forecast period (2025-2033) anticipates sustained market growth, influenced by global economic trends and governmental policies concerning fertilizer subsidies and environmental mandates. A growing emphasis on sustainable ammonia production, including green ammonia, is expected to define the industry's future, addressing environmental concerns and ensuring long-term viability. The competitive landscape will remain dynamic, characterized by technological innovation, strategic mergers and acquisitions, and partnerships aimed at securing competitive advantages. Geographical expansion into emerging markets with escalating agricultural demands will be a crucial strategy for market players seeking to enhance their market share.
Ammonia Market Company Market Share
Ammonia Market Report: A Comprehensive Analysis (2019-2033)
This dynamic report provides a comprehensive analysis of the Ammonia Market, covering the period 2019-2033, with a focus on market trends, competitive dynamics, and future growth prospects. Leveraging extensive data and insights, this report is an essential resource for industry professionals, investors, and stakeholders seeking a deep understanding of this crucial market.
Ammonia Market Structure & Competitive Landscape
The ammonia market is characterized by a moderately concentrated structure, with several major players controlling a significant portion of global production. The Herfindahl-Hirschman Index (HHI) for the market in 2024 is estimated at xx, indicating a moderately concentrated market. Innovation is a key driver, with companies continuously investing in improving production efficiency, reducing carbon emissions, and developing new applications for ammonia. Stringent environmental regulations, particularly those focused on reducing greenhouse gas emissions, significantly impact the industry, pushing companies to adopt sustainable production methods. The market also faces pressure from potential substitutes, such as urea and other nitrogen-based fertilizers, but ammonia retains its dominant position due to its cost-effectiveness and wide range of applications. The end-user segmentation is diverse, with agriculture dominating the market share (estimated at xx Million tons in 2024), followed by industrial applications (xx Million tons).
Mergers and acquisitions (M&A) activity has been robust in recent years, with a total M&A volume of approximately xx Billion USD recorded between 2019 and 2024, reflecting the consolidation trend within the industry. Key M&A activities include the December 2023 acquisition of Incitec Pivot Limited's Waggaman facility by CF Industries, significantly expanding CF Industries' production capacity. This dynamic landscape is further shaped by factors such as geopolitical events, fluctuating energy prices, and evolving technological advancements.
- Market Concentration: Moderately concentrated, HHI estimated at xx in 2024.
- Innovation Drivers: Efficiency improvements, reduced emissions, new applications.
- Regulatory Impacts: Stringent environmental regulations drive sustainable practices.
- Product Substitutes: Urea and other nitrogen-based fertilizers pose a competitive threat.
- End-User Segmentation: Agriculture (xx Million tons in 2024), Industrial (xx Million tons in 2024), and others.
- M&A Trends: Significant activity, xx Billion USD in volume (2019-2024).
Ammonia Market Trends & Opportunities
The global ammonia market exhibits robust growth, with an estimated market size of xx Million tons in 2025 and a projected Compound Annual Growth Rate (CAGR) of xx% during the forecast period (2025-2033). This growth is fueled by increasing demand from the agricultural sector, driven by rising global population and the need for enhanced food production. Technological advancements in ammonia production, such as the development of more efficient and sustainable processes, are further accelerating market growth. The shift towards renewable ammonia production, exemplified by Yara's collaboration with Acme Cleantech, represents a significant opportunity for market expansion. Furthermore, the increasing adoption of ammonia in industrial applications, particularly in the production of fertilizers, textiles, and other chemicals, is contributing to market expansion. Competitive dynamics remain intense, with major players focusing on strategic partnerships, capacity expansions, and technological innovation to gain a competitive edge. Market penetration rates for specific applications vary significantly, with agriculture maintaining its dominance, but other sectors gradually increasing their adoption of ammonia.
Dominant Markets & Segments in Ammonia Market
The agriculture sector overwhelmingly dominates ammonia consumption, accounting for approximately xx% of total global demand in 2024. Geographically, Asia-Pacific is the leading region for ammonia consumption, driven by strong growth in agricultural activities and robust industrial development. Within the product types, liquid ammonia holds a larger market share compared to gaseous ammonia due to its ease of transportation and storage.
- Key Growth Drivers (Asia-Pacific):
- Rapid growth in agricultural production.
- Significant industrial development, including fertilizer manufacturing.
- Government support for agricultural modernization.
- Market Dominance Analysis:
- Agriculture: Predominant end-user segment due to its extensive use in fertilizer production.
- Asia-Pacific: Leading region in consumption due to agricultural and industrial growth.
- Liquid Ammonia: Higher market share compared to gaseous ammonia due to its ease of handling.
Ammonia Market Product Analysis
Ammonia products are primarily categorized into liquid and gaseous forms. Technological advancements focus on improving production efficiency, reducing energy consumption, and mitigating environmental impact. Key competitive advantages include cost-effectiveness, ease of transportation and handling (especially liquid ammonia), and versatility across diverse applications. The market is witnessing a gradual shift towards more sustainable and green ammonia production methods, aiming to reduce the overall carbon footprint. The successful integration of renewable energy sources into the ammonia production process is a crucial factor in driving market growth and attracting environmentally conscious customers.
Key Drivers, Barriers & Challenges in Ammonia Market
Key Drivers:
- Rising Global Food Demand: The increasing global population drives demand for nitrogen-based fertilizers, where ammonia is a primary input.
- Industrial Applications: Growth in diverse industries, including textiles, refrigeration, and water treatment, boosts ammonia demand.
- Technological Advancements: Improved production efficiency and sustainable practices enhance market attractiveness.
Challenges and Restraints:
- Price Volatility: Fluctuating energy prices and raw material costs impact ammonia production costs and profitability.
- Environmental Concerns: Ammonia production generates greenhouse gases, leading to stringent environmental regulations.
- Supply Chain Disruptions: Geopolitical instability and logistical challenges can disrupt ammonia supply chains.
Growth Drivers in the Ammonia Market
The primary growth drivers include escalating global food demand, expansion of industrial applications, technological innovations in production, and government support for sustainable ammonia production. The development of renewable ammonia production methods offers significant opportunities for sustainable growth.
Challenges Impacting Ammonia Market Growth
Key challenges include volatile raw material and energy prices, stringent environmental regulations, potential supply chain disruptions, and competition from substitute products. Overcoming these challenges requires investment in sustainable production technologies and robust supply chain management.
Key Players Shaping the Ammonia Market
- CSBP
- Chambal Fertilisers and Chemicals Limited
- Qatar Fertiliser Company (QAFCO)
- PT Pupuk Sriwidjaja Palembang (Pusri)
- BASF SE
- OCI
- Group DF (Ostchem)
- SABIC
- Eurochem Group
- Koch Fertilizer LLC
- Rashtriya Chemicals And Fertilizers Limited
- CF Industries Holdings Inc
- IFFCO
- Jsc Togliattiazot
- Nutrien Ltd
- Yara *List Not Exhaustive
Significant Ammonia Market Industry Milestones
- December 2023: CF Industries Holdings Inc. acquired Incitec Pivot Limited’s Waggaman ammonia production facility for USD 1.675 Billion, adding 880,000 tons of annual production capacity.
- March 2024: Yara partnered with GHC SAOC (Acme Cleantech) to source 100,000 tons per annum of renewable ammonia with reduced CO2 emissions.
Future Outlook for Ammonia Market
The ammonia market is poised for continued growth, driven by sustained demand from agriculture and expanding industrial applications. Strategic investments in sustainable production technologies and innovative applications will play a crucial role in shaping future market dynamics. The increasing focus on reducing carbon emissions presents both opportunities and challenges, requiring companies to adapt to evolving regulatory landscapes and consumer preferences. The market's future success will hinge on the ability of key players to embrace innovation, sustainable practices, and effective supply chain management.
Ammonia Market Segmentation
-
1. Type
- 1.1. Liquid
- 1.2. Gas
-
2. End-user Industry
- 2.1. Agriculture
- 2.2. Textiles
- 2.3. Mining
- 2.4. Pharmaceutical
- 2.5. Refrigeration
- 2.6. Other En
Ammonia Market Segmentation By Geography
-
1. Asia Pacific
- 1.1. China
- 1.2. India
- 1.3. Japan
- 1.4. South Korea
- 1.5. Rest of Asia Pacific
-
2. North America
- 2.1. United States
- 2.2. Canada
- 2.3. Mexico
-
3. Europe
- 3.1. Germany
- 3.2. United Kingdom
- 3.3. France
- 3.4. Italy
- 3.5. Rest of Europe
-
4. South America
- 4.1. Brazil
- 4.2. Argentina
- 4.3. Rest of South America
-
5. Middle East and Africa
- 5.1. Saudi Arabia
- 5.2. South Africa
- 5.3. Rest of Middle East and Africa
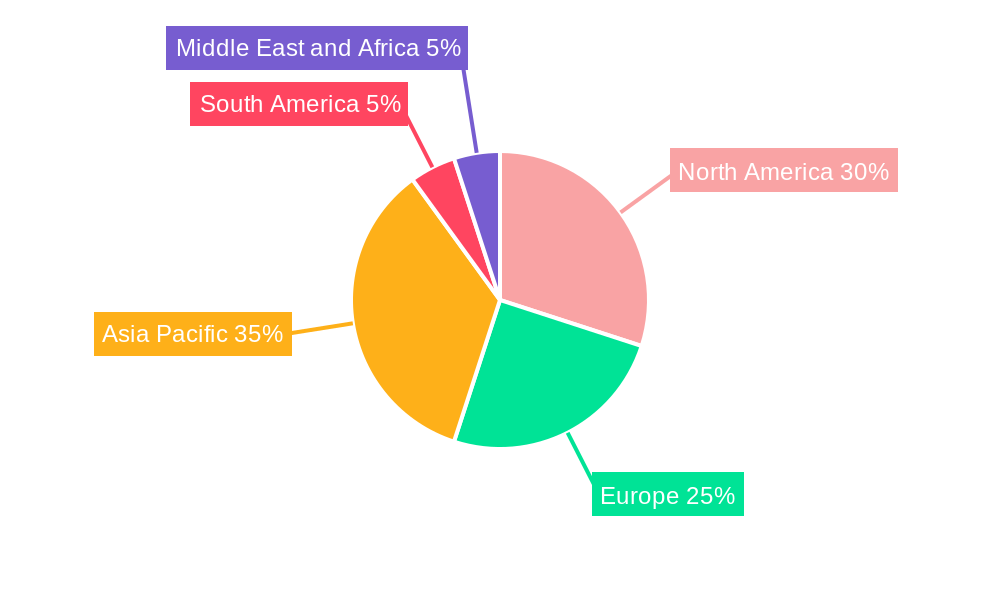
Ammonia Market Regional Market Share
Geographic Coverage of Ammonia Market
Ammonia Market REPORT HIGHLIGHTS
| Aspects | Details |
|---|---|
| Study Period | 2020-2034 |
| Base Year | 2025 |
| Estimated Year | 2026 |
| Forecast Period | 2026-2034 |
| Historical Period | 2020-2025 |
| Growth Rate | CAGR of 1.2% from 2020-2034 |
| Segmentation |
|
Table of Contents
- 1. Introduction
- 1.1. Research Scope
- 1.2. Market Segmentation
- 1.3. Research Objective
- 1.4. Definitions and Assumptions
- 2. Executive Summary
- 2.1. Market Snapshot
- 3. Market Dynamics
- 3.1. Market Drivers
- 3.2. Market Restrains
- 3.3. Market Trends
- 3.4. Market Opportunities
- 4. Market Factor Analysis
- 4.1. Porters Five Forces
- 4.1.1. Bargaining Power of Suppliers
- 4.1.2. Bargaining Power of Buyers
- 4.1.3. Threat of New Entrants
- 4.1.4. Threat of Substitutes
- 4.1.5. Competitive Rivalry
- 4.2. PESTEL analysis
- 4.3. BCG Analysis
- 4.3.1. Stars (High Growth, High Market Share)
- 4.3.2. Cash Cows (Low Growth, High Market Share)
- 4.3.3. Question Mark (High Growth, Low Market Share)
- 4.3.4. Dogs (Low Growth, Low Market Share)
- 4.4. Ansoff Matrix Analysis
- 4.5. Supply Chain Analysis
- 4.6. Regulatory Landscape
- 4.7. Current Market Potential and Opportunity Assessment (TAM–SAM–SOM Framework)
- 4.8. TIR Analyst Note
- 4.1. Porters Five Forces
- 5. Market Analysis, Insights and Forecast 2021-2033
- 5.1. Market Analysis, Insights and Forecast - by Type
- 5.1.1. Liquid
- 5.1.2. Gas
- 5.2. Market Analysis, Insights and Forecast - by End-user Industry
- 5.2.1. Agriculture
- 5.2.2. Textiles
- 5.2.3. Mining
- 5.2.4. Pharmaceutical
- 5.2.5. Refrigeration
- 5.2.6. Other En
- 5.3. Market Analysis, Insights and Forecast - by Region
- 5.3.1. Asia Pacific
- 5.3.2. North America
- 5.3.3. Europe
- 5.3.4. South America
- 5.3.5. Middle East and Africa
- 5.1. Market Analysis, Insights and Forecast - by Type
- 6. Global Ammonia Market Analysis, Insights and Forecast, 2021-2033
- 6.1. Market Analysis, Insights and Forecast - by Type
- 6.1.1. Liquid
- 6.1.2. Gas
- 6.2. Market Analysis, Insights and Forecast - by End-user Industry
- 6.2.1. Agriculture
- 6.2.2. Textiles
- 6.2.3. Mining
- 6.2.4. Pharmaceutical
- 6.2.5. Refrigeration
- 6.2.6. Other En
- 6.1. Market Analysis, Insights and Forecast - by Type
- 7. Asia Pacific Ammonia Market Analysis, Insights and Forecast, 2020-2032
- 7.1. Market Analysis, Insights and Forecast - by Type
- 7.1.1. Liquid
- 7.1.2. Gas
- 7.2. Market Analysis, Insights and Forecast - by End-user Industry
- 7.2.1. Agriculture
- 7.2.2. Textiles
- 7.2.3. Mining
- 7.2.4. Pharmaceutical
- 7.2.5. Refrigeration
- 7.2.6. Other En
- 7.1. Market Analysis, Insights and Forecast - by Type
- 8. North America Ammonia Market Analysis, Insights and Forecast, 2020-2032
- 8.1. Market Analysis, Insights and Forecast - by Type
- 8.1.1. Liquid
- 8.1.2. Gas
- 8.2. Market Analysis, Insights and Forecast - by End-user Industry
- 8.2.1. Agriculture
- 8.2.2. Textiles
- 8.2.3. Mining
- 8.2.4. Pharmaceutical
- 8.2.5. Refrigeration
- 8.2.6. Other En
- 8.1. Market Analysis, Insights and Forecast - by Type
- 9. Europe Ammonia Market Analysis, Insights and Forecast, 2020-2032
- 9.1. Market Analysis, Insights and Forecast - by Type
- 9.1.1. Liquid
- 9.1.2. Gas
- 9.2. Market Analysis, Insights and Forecast - by End-user Industry
- 9.2.1. Agriculture
- 9.2.2. Textiles
- 9.2.3. Mining
- 9.2.4. Pharmaceutical
- 9.2.5. Refrigeration
- 9.2.6. Other En
- 9.1. Market Analysis, Insights and Forecast - by Type
- 10. South America Ammonia Market Analysis, Insights and Forecast, 2020-2032
- 10.1. Market Analysis, Insights and Forecast - by Type
- 10.1.1. Liquid
- 10.1.2. Gas
- 10.2. Market Analysis, Insights and Forecast - by End-user Industry
- 10.2.1. Agriculture
- 10.2.2. Textiles
- 10.2.3. Mining
- 10.2.4. Pharmaceutical
- 10.2.5. Refrigeration
- 10.2.6. Other En
- 10.1. Market Analysis, Insights and Forecast - by Type
- 11. Middle East and Africa Ammonia Market Analysis, Insights and Forecast, 2020-2032
- 11.1. Market Analysis, Insights and Forecast - by Type
- 11.1.1. Liquid
- 11.1.2. Gas
- 11.2. Market Analysis, Insights and Forecast - by End-user Industry
- 11.2.1. Agriculture
- 11.2.2. Textiles
- 11.2.3. Mining
- 11.2.4. Pharmaceutical
- 11.2.5. Refrigeration
- 11.2.6. Other En
- 11.1. Market Analysis, Insights and Forecast - by Type
- 12. Competitive Analysis
- 12.1. Company Profiles
- 12.1.1 CSBP
- 12.1.1.1. Company Overview
- 12.1.1.2. Products
- 12.1.1.3. Company Financials
- 12.1.1.4. SWOT Analysis
- 12.1.2 Chambal Fertilisers and Chemicals Limited
- 12.1.2.1. Company Overview
- 12.1.2.2. Products
- 12.1.2.3. Company Financials
- 12.1.2.4. SWOT Analysis
- 12.1.3 Qatar Fertiliser Company (QAFCO)
- 12.1.3.1. Company Overview
- 12.1.3.2. Products
- 12.1.3.3. Company Financials
- 12.1.3.4. SWOT Analysis
- 12.1.4 PT Pupuk Sriwidjaja Palembang (Pusri)
- 12.1.4.1. Company Overview
- 12.1.4.2. Products
- 12.1.4.3. Company Financials
- 12.1.4.4. SWOT Analysis
- 12.1.5 BASF SE
- 12.1.5.1. Company Overview
- 12.1.5.2. Products
- 12.1.5.3. Company Financials
- 12.1.5.4. SWOT Analysis
- 12.1.6 OCI
- 12.1.6.1. Company Overview
- 12.1.6.2. Products
- 12.1.6.3. Company Financials
- 12.1.6.4. SWOT Analysis
- 12.1.7 Group DF (Ostchem)
- 12.1.7.1. Company Overview
- 12.1.7.2. Products
- 12.1.7.3. Company Financials
- 12.1.7.4. SWOT Analysis
- 12.1.8 SABIC
- 12.1.8.1. Company Overview
- 12.1.8.2. Products
- 12.1.8.3. Company Financials
- 12.1.8.4. SWOT Analysis
- 12.1.9 Eurochem Group
- 12.1.9.1. Company Overview
- 12.1.9.2. Products
- 12.1.9.3. Company Financials
- 12.1.9.4. SWOT Analysis
- 12.1.10 Koch Fertilizer LLC
- 12.1.10.1. Company Overview
- 12.1.10.2. Products
- 12.1.10.3. Company Financials
- 12.1.10.4. SWOT Analysis
- 12.1.11 Rashtriya Chemicals And Fertilizers Limited
- 12.1.11.1. Company Overview
- 12.1.11.2. Products
- 12.1.11.3. Company Financials
- 12.1.11.4. SWOT Analysis
- 12.1.12 CF Industries Holdings Inc
- 12.1.12.1. Company Overview
- 12.1.12.2. Products
- 12.1.12.3. Company Financials
- 12.1.12.4. SWOT Analysis
- 12.1.13 IFFCO
- 12.1.13.1. Company Overview
- 12.1.13.2. Products
- 12.1.13.3. Company Financials
- 12.1.13.4. SWOT Analysis
- 12.1.14 Jsc Togliattiazot
- 12.1.14.1. Company Overview
- 12.1.14.2. Products
- 12.1.14.3. Company Financials
- 12.1.14.4. SWOT Analysis
- 12.1.15 Nutrien Ltd
- 12.1.15.1. Company Overview
- 12.1.15.2. Products
- 12.1.15.3. Company Financials
- 12.1.15.4. SWOT Analysis
- 12.1.16 Yara*List Not Exhaustive
- 12.1.16.1. Company Overview
- 12.1.16.2. Products
- 12.1.16.3. Company Financials
- 12.1.16.4. SWOT Analysis
- 12.1.1 CSBP
- 12.2. Market Entropy
- 12.2.1 Company's Key Areas Served
- 12.2.2 Recent Developments
- 12.3. Company Market Share Analysis 2025
- 12.3.1 Top 5 Companies Market Share Analysis
- 12.3.2 Top 3 Companies Market Share Analysis
- 12.4. List of Potential Customers
- 13. Research Methodology
List of Figures
- Figure 1: Global Ammonia Market Revenue Breakdown (million, %) by Region 2025 & 2033
- Figure 2: Global Ammonia Market Volume Breakdown (Million, %) by Region 2025 & 2033
- Figure 3: Asia Pacific Ammonia Market Revenue (million), by Type 2025 & 2033
- Figure 4: Asia Pacific Ammonia Market Volume (Million), by Type 2025 & 2033
- Figure 5: Asia Pacific Ammonia Market Revenue Share (%), by Type 2025 & 2033
- Figure 6: Asia Pacific Ammonia Market Volume Share (%), by Type 2025 & 2033
- Figure 7: Asia Pacific Ammonia Market Revenue (million), by End-user Industry 2025 & 2033
- Figure 8: Asia Pacific Ammonia Market Volume (Million), by End-user Industry 2025 & 2033
- Figure 9: Asia Pacific Ammonia Market Revenue Share (%), by End-user Industry 2025 & 2033
- Figure 10: Asia Pacific Ammonia Market Volume Share (%), by End-user Industry 2025 & 2033
- Figure 11: Asia Pacific Ammonia Market Revenue (million), by Country 2025 & 2033
- Figure 12: Asia Pacific Ammonia Market Volume (Million), by Country 2025 & 2033
- Figure 13: Asia Pacific Ammonia Market Revenue Share (%), by Country 2025 & 2033
- Figure 14: Asia Pacific Ammonia Market Volume Share (%), by Country 2025 & 2033
- Figure 15: North America Ammonia Market Revenue (million), by Type 2025 & 2033
- Figure 16: North America Ammonia Market Volume (Million), by Type 2025 & 2033
- Figure 17: North America Ammonia Market Revenue Share (%), by Type 2025 & 2033
- Figure 18: North America Ammonia Market Volume Share (%), by Type 2025 & 2033
- Figure 19: North America Ammonia Market Revenue (million), by End-user Industry 2025 & 2033
- Figure 20: North America Ammonia Market Volume (Million), by End-user Industry 2025 & 2033
- Figure 21: North America Ammonia Market Revenue Share (%), by End-user Industry 2025 & 2033
- Figure 22: North America Ammonia Market Volume Share (%), by End-user Industry 2025 & 2033
- Figure 23: North America Ammonia Market Revenue (million), by Country 2025 & 2033
- Figure 24: North America Ammonia Market Volume (Million), by Country 2025 & 2033
- Figure 25: North America Ammonia Market Revenue Share (%), by Country 2025 & 2033
- Figure 26: North America Ammonia Market Volume Share (%), by Country 2025 & 2033
- Figure 27: Europe Ammonia Market Revenue (million), by Type 2025 & 2033
- Figure 28: Europe Ammonia Market Volume (Million), by Type 2025 & 2033
- Figure 29: Europe Ammonia Market Revenue Share (%), by Type 2025 & 2033
- Figure 30: Europe Ammonia Market Volume Share (%), by Type 2025 & 2033
- Figure 31: Europe Ammonia Market Revenue (million), by End-user Industry 2025 & 2033
- Figure 32: Europe Ammonia Market Volume (Million), by End-user Industry 2025 & 2033
- Figure 33: Europe Ammonia Market Revenue Share (%), by End-user Industry 2025 & 2033
- Figure 34: Europe Ammonia Market Volume Share (%), by End-user Industry 2025 & 2033
- Figure 35: Europe Ammonia Market Revenue (million), by Country 2025 & 2033
- Figure 36: Europe Ammonia Market Volume (Million), by Country 2025 & 2033
- Figure 37: Europe Ammonia Market Revenue Share (%), by Country 2025 & 2033
- Figure 38: Europe Ammonia Market Volume Share (%), by Country 2025 & 2033
- Figure 39: South America Ammonia Market Revenue (million), by Type 2025 & 2033
- Figure 40: South America Ammonia Market Volume (Million), by Type 2025 & 2033
- Figure 41: South America Ammonia Market Revenue Share (%), by Type 2025 & 2033
- Figure 42: South America Ammonia Market Volume Share (%), by Type 2025 & 2033
- Figure 43: South America Ammonia Market Revenue (million), by End-user Industry 2025 & 2033
- Figure 44: South America Ammonia Market Volume (Million), by End-user Industry 2025 & 2033
- Figure 45: South America Ammonia Market Revenue Share (%), by End-user Industry 2025 & 2033
- Figure 46: South America Ammonia Market Volume Share (%), by End-user Industry 2025 & 2033
- Figure 47: South America Ammonia Market Revenue (million), by Country 2025 & 2033
- Figure 48: South America Ammonia Market Volume (Million), by Country 2025 & 2033
- Figure 49: South America Ammonia Market Revenue Share (%), by Country 2025 & 2033
- Figure 50: South America Ammonia Market Volume Share (%), by Country 2025 & 2033
- Figure 51: Middle East and Africa Ammonia Market Revenue (million), by Type 2025 & 2033
- Figure 52: Middle East and Africa Ammonia Market Volume (Million), by Type 2025 & 2033
- Figure 53: Middle East and Africa Ammonia Market Revenue Share (%), by Type 2025 & 2033
- Figure 54: Middle East and Africa Ammonia Market Volume Share (%), by Type 2025 & 2033
- Figure 55: Middle East and Africa Ammonia Market Revenue (million), by End-user Industry 2025 & 2033
- Figure 56: Middle East and Africa Ammonia Market Volume (Million), by End-user Industry 2025 & 2033
- Figure 57: Middle East and Africa Ammonia Market Revenue Share (%), by End-user Industry 2025 & 2033
- Figure 58: Middle East and Africa Ammonia Market Volume Share (%), by End-user Industry 2025 & 2033
- Figure 59: Middle East and Africa Ammonia Market Revenue (million), by Country 2025 & 2033
- Figure 60: Middle East and Africa Ammonia Market Volume (Million), by Country 2025 & 2033
- Figure 61: Middle East and Africa Ammonia Market Revenue Share (%), by Country 2025 & 2033
- Figure 62: Middle East and Africa Ammonia Market Volume Share (%), by Country 2025 & 2033
List of Tables
- Table 1: Global Ammonia Market Revenue million Forecast, by Type 2020 & 2033
- Table 2: Global Ammonia Market Volume Million Forecast, by Type 2020 & 2033
- Table 3: Global Ammonia Market Revenue million Forecast, by End-user Industry 2020 & 2033
- Table 4: Global Ammonia Market Volume Million Forecast, by End-user Industry 2020 & 2033
- Table 5: Global Ammonia Market Revenue million Forecast, by Region 2020 & 2033
- Table 6: Global Ammonia Market Volume Million Forecast, by Region 2020 & 2033
- Table 7: Global Ammonia Market Revenue million Forecast, by Type 2020 & 2033
- Table 8: Global Ammonia Market Volume Million Forecast, by Type 2020 & 2033
- Table 9: Global Ammonia Market Revenue million Forecast, by End-user Industry 2020 & 2033
- Table 10: Global Ammonia Market Volume Million Forecast, by End-user Industry 2020 & 2033
- Table 11: Global Ammonia Market Revenue million Forecast, by Country 2020 & 2033
- Table 12: Global Ammonia Market Volume Million Forecast, by Country 2020 & 2033
- Table 13: China Ammonia Market Revenue (million) Forecast, by Application 2020 & 2033
- Table 14: China Ammonia Market Volume (Million) Forecast, by Application 2020 & 2033
- Table 15: India Ammonia Market Revenue (million) Forecast, by Application 2020 & 2033
- Table 16: India Ammonia Market Volume (Million) Forecast, by Application 2020 & 2033
- Table 17: Japan Ammonia Market Revenue (million) Forecast, by Application 2020 & 2033
- Table 18: Japan Ammonia Market Volume (Million) Forecast, by Application 2020 & 2033
- Table 19: South Korea Ammonia Market Revenue (million) Forecast, by Application 2020 & 2033
- Table 20: South Korea Ammonia Market Volume (Million) Forecast, by Application 2020 & 2033
- Table 21: Rest of Asia Pacific Ammonia Market Revenue (million) Forecast, by Application 2020 & 2033
- Table 22: Rest of Asia Pacific Ammonia Market Volume (Million) Forecast, by Application 2020 & 2033
- Table 23: Global Ammonia Market Revenue million Forecast, by Type 2020 & 2033
- Table 24: Global Ammonia Market Volume Million Forecast, by Type 2020 & 2033
- Table 25: Global Ammonia Market Revenue million Forecast, by End-user Industry 2020 & 2033
- Table 26: Global Ammonia Market Volume Million Forecast, by End-user Industry 2020 & 2033
- Table 27: Global Ammonia Market Revenue million Forecast, by Country 2020 & 2033
- Table 28: Global Ammonia Market Volume Million Forecast, by Country 2020 & 2033
- Table 29: United States Ammonia Market Revenue (million) Forecast, by Application 2020 & 2033
- Table 30: United States Ammonia Market Volume (Million) Forecast, by Application 2020 & 2033
- Table 31: Canada Ammonia Market Revenue (million) Forecast, by Application 2020 & 2033
- Table 32: Canada Ammonia Market Volume (Million) Forecast, by Application 2020 & 2033
- Table 33: Mexico Ammonia Market Revenue (million) Forecast, by Application 2020 & 2033
- Table 34: Mexico Ammonia Market Volume (Million) Forecast, by Application 2020 & 2033
- Table 35: Global Ammonia Market Revenue million Forecast, by Type 2020 & 2033
- Table 36: Global Ammonia Market Volume Million Forecast, by Type 2020 & 2033
- Table 37: Global Ammonia Market Revenue million Forecast, by End-user Industry 2020 & 2033
- Table 38: Global Ammonia Market Volume Million Forecast, by End-user Industry 2020 & 2033
- Table 39: Global Ammonia Market Revenue million Forecast, by Country 2020 & 2033
- Table 40: Global Ammonia Market Volume Million Forecast, by Country 2020 & 2033
- Table 41: Germany Ammonia Market Revenue (million) Forecast, by Application 2020 & 2033
- Table 42: Germany Ammonia Market Volume (Million) Forecast, by Application 2020 & 2033
- Table 43: United Kingdom Ammonia Market Revenue (million) Forecast, by Application 2020 & 2033
- Table 44: United Kingdom Ammonia Market Volume (Million) Forecast, by Application 2020 & 2033
- Table 45: France Ammonia Market Revenue (million) Forecast, by Application 2020 & 2033
- Table 46: France Ammonia Market Volume (Million) Forecast, by Application 2020 & 2033
- Table 47: Italy Ammonia Market Revenue (million) Forecast, by Application 2020 & 2033
- Table 48: Italy Ammonia Market Volume (Million) Forecast, by Application 2020 & 2033
- Table 49: Rest of Europe Ammonia Market Revenue (million) Forecast, by Application 2020 & 2033
- Table 50: Rest of Europe Ammonia Market Volume (Million) Forecast, by Application 2020 & 2033
- Table 51: Global Ammonia Market Revenue million Forecast, by Type 2020 & 2033
- Table 52: Global Ammonia Market Volume Million Forecast, by Type 2020 & 2033
- Table 53: Global Ammonia Market Revenue million Forecast, by End-user Industry 2020 & 2033
- Table 54: Global Ammonia Market Volume Million Forecast, by End-user Industry 2020 & 2033
- Table 55: Global Ammonia Market Revenue million Forecast, by Country 2020 & 2033
- Table 56: Global Ammonia Market Volume Million Forecast, by Country 2020 & 2033
- Table 57: Brazil Ammonia Market Revenue (million) Forecast, by Application 2020 & 2033
- Table 58: Brazil Ammonia Market Volume (Million) Forecast, by Application 2020 & 2033
- Table 59: Argentina Ammonia Market Revenue (million) Forecast, by Application 2020 & 2033
- Table 60: Argentina Ammonia Market Volume (Million) Forecast, by Application 2020 & 2033
- Table 61: Rest of South America Ammonia Market Revenue (million) Forecast, by Application 2020 & 2033
- Table 62: Rest of South America Ammonia Market Volume (Million) Forecast, by Application 2020 & 2033
- Table 63: Global Ammonia Market Revenue million Forecast, by Type 2020 & 2033
- Table 64: Global Ammonia Market Volume Million Forecast, by Type 2020 & 2033
- Table 65: Global Ammonia Market Revenue million Forecast, by End-user Industry 2020 & 2033
- Table 66: Global Ammonia Market Volume Million Forecast, by End-user Industry 2020 & 2033
- Table 67: Global Ammonia Market Revenue million Forecast, by Country 2020 & 2033
- Table 68: Global Ammonia Market Volume Million Forecast, by Country 2020 & 2033
- Table 69: Saudi Arabia Ammonia Market Revenue (million) Forecast, by Application 2020 & 2033
- Table 70: Saudi Arabia Ammonia Market Volume (Million) Forecast, by Application 2020 & 2033
- Table 71: South Africa Ammonia Market Revenue (million) Forecast, by Application 2020 & 2033
- Table 72: South Africa Ammonia Market Volume (Million) Forecast, by Application 2020 & 2033
- Table 73: Rest of Middle East and Africa Ammonia Market Revenue (million) Forecast, by Application 2020 & 2033
- Table 74: Rest of Middle East and Africa Ammonia Market Volume (Million) Forecast, by Application 2020 & 2033
Frequently Asked Questions
1. What is the projected Compound Annual Growth Rate (CAGR) of the Ammonia Market?
The projected CAGR is approximately 1.2%.
2. Which companies are prominent players in the Ammonia Market?
Key companies in the market include CSBP, Chambal Fertilisers and Chemicals Limited, Qatar Fertiliser Company (QAFCO), PT Pupuk Sriwidjaja Palembang (Pusri), BASF SE, OCI, Group DF (Ostchem), SABIC, Eurochem Group, Koch Fertilizer LLC, Rashtriya Chemicals And Fertilizers Limited, CF Industries Holdings Inc, IFFCO, Jsc Togliattiazot, Nutrien Ltd, Yara*List Not Exhaustive.
3. What are the main segments of the Ammonia Market?
The market segments include Type, End-user Industry.
4. Can you provide details about the market size?
The market size is estimated to be USD 68840 million as of 2022.
5. What are some drivers contributing to market growth?
Abundant Use in the Fertilizer Industry; Increasing Usage to Produce Explosives.
6. What are the notable trends driving market growth?
The Agriculture Industry is Expected to Dominate the Market.
7. Are there any restraints impacting market growth?
Hazardous Effects in its Concentrated Form.
8. Can you provide examples of recent developments in the market?
March 2024: Yara collaborated with GHC SAOC, a wholly-owned subsidiary of Acme Cleantech. Under this collaboration, ACME will provide YARA with ammonia with reduced CO2 emissions. This collaboration covers the supply of 100,000 tons per annum of renewable ammonia.
9. What pricing options are available for accessing the report?
Pricing options include single-user, multi-user, and enterprise licenses priced at USD 4750, USD 5250, and USD 8750 respectively.
10. Is the market size provided in terms of value or volume?
The market size is provided in terms of value, measured in million and volume, measured in Million.
11. Are there any specific market keywords associated with the report?
Yes, the market keyword associated with the report is "Ammonia Market," which aids in identifying and referencing the specific market segment covered.
12. How do I determine which pricing option suits my needs best?
The pricing options vary based on user requirements and access needs. Individual users may opt for single-user licenses, while businesses requiring broader access may choose multi-user or enterprise licenses for cost-effective access to the report.
13. Are there any additional resources or data provided in the Ammonia Market report?
While the report offers comprehensive insights, it's advisable to review the specific contents or supplementary materials provided to ascertain if additional resources or data are available.
14. How can I stay updated on further developments or reports in the Ammonia Market?
To stay informed about further developments, trends, and reports in the Ammonia Market, consider subscribing to industry newsletters, following relevant companies and organizations, or regularly checking reputable industry news sources and publications.
Methodology
Step 1 - Identification of Relevant Samples Size from Population Database


Step 2 - Approaches for Defining Global Market Size (Value, Volume* & Price*)

Note*: In applicable scenarios
Step 3 - Data Sources
Primary Research
- Web Analytics
- Survey Reports
- Research Institute
- Latest Research Reports
- Opinion Leaders
Secondary Research
- Annual Reports
- White Paper
- Latest Press Release
- Industry Association
- Paid Database
- Investor Presentations

Step 4 - Data Triangulation
Involves using different sources of information in order to increase the validity of a study
These sources are likely to be stakeholders in a program - participants, other researchers, program staff, other community members, and so on.
Then we put all data in single framework & apply various statistical tools to find out the dynamic on the market.
During the analysis stage, feedback from the stakeholder groups would be compared to determine areas of agreement as well as areas of divergence