

Key Insights
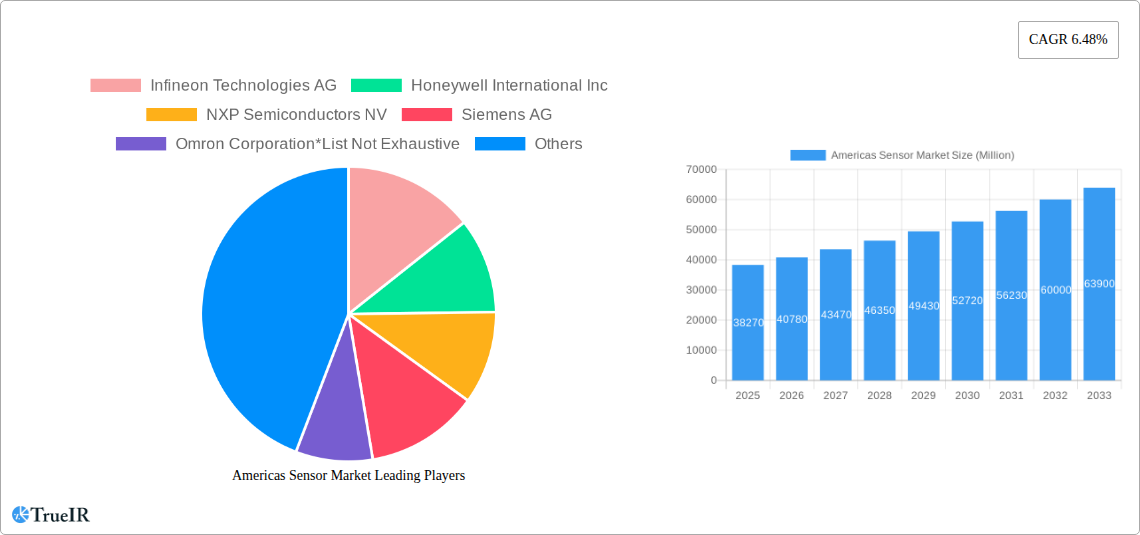
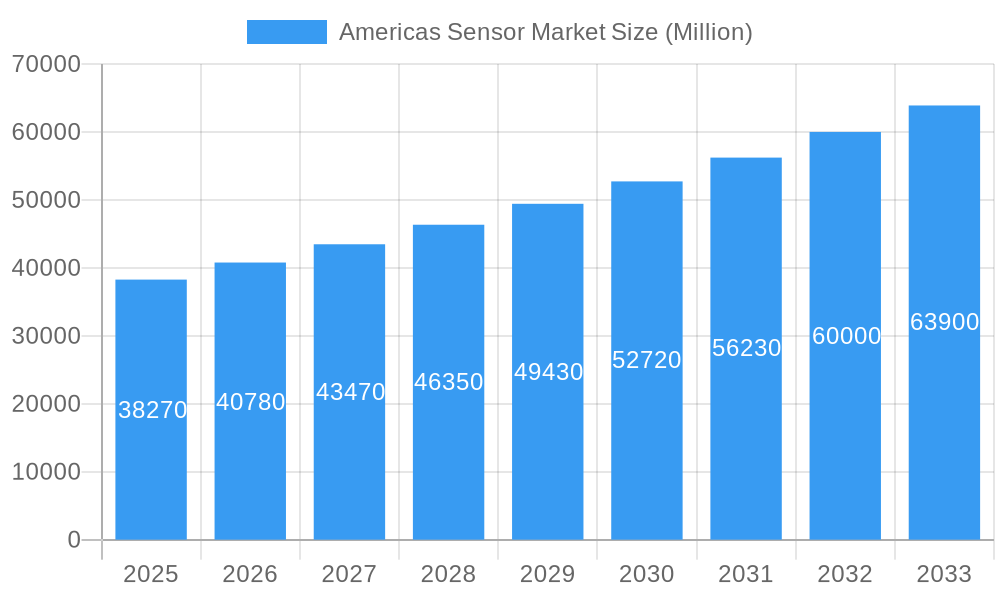
The Americas sensor market, valued at $38.27 billion in 2025, is projected to experience robust growth, driven by a Compound Annual Growth Rate (CAGR) of 6.48% from 2025 to 2033. This expansion is fueled by several key factors. The automotive industry's increasing reliance on advanced driver-assistance systems (ADAS) and autonomous driving technologies significantly boosts demand for sensors across various parameters like pressure, temperature, and proximity. Simultaneously, the burgeoning consumer electronics sector, particularly the growth of smart home devices and wearables, fuels demand for miniaturized, high-performance sensors. Furthermore, the healthcare sector's adoption of advanced medical equipment and remote patient monitoring systems contributes to market growth. Industrial automation, with its increasing integration of sensors for process optimization and predictive maintenance, also presents a significant opportunity. Growth is further bolstered by government initiatives promoting technological advancements and smart infrastructure development across North and South America.
Americas Sensor Market Market Size (In Billion)
Regional variations within the Americas are expected. North America, driven by strong technological innovation and high adoption rates in automotive and consumer electronics, will likely dominate the market share. However, South America, particularly Brazil, is poised for substantial growth due to increased industrialization and government investment in infrastructure projects. Specific sensor types, such as optical sensors and image sensors, are likely to exhibit higher growth rates compared to other modalities due to their applications in advanced imaging systems and automotive safety features. While challenges like high initial investment costs and sensor reliability issues exist, the overall market outlook remains positive, driven by consistent technological advancements and increasing demand across various end-user industries.
Americas Sensor Market Company Market Share
Americas Sensor Market: A Comprehensive Market Report (2019-2033)
This dynamic report provides a detailed analysis of the Americas sensor market, offering invaluable insights for industry stakeholders. With a study period spanning 2019-2033, a base year of 2025, and a forecast period of 2025-2033, this report leverages extensive market research to provide a comprehensive overview of market trends, growth drivers, challenges, and competitive landscapes. The market is valued at xx Million in 2025 and is projected to reach xx Million by 2033, exhibiting a CAGR of xx%.
Americas Sensor Market Market Structure & Competitive Landscape
The Americas sensor market is characterized by a moderately concentrated structure, with several key players holding significant market share. The Herfindahl-Hirschman Index (HHI) for 2025 is estimated at xx, indicating a moderately consolidated market. However, the market is also highly dynamic, fueled by continuous technological advancements and increasing demand across diverse end-user industries.
Key Market Characteristics:
- Innovation Drivers: Miniaturization, enhanced accuracy, improved power efficiency, and the integration of advanced functionalities like AI and machine learning are key drivers of innovation.
- Regulatory Impacts: Stringent safety and environmental regulations, particularly in sectors like automotive and medical, influence sensor design and adoption. Compliance costs and evolving standards create both challenges and opportunities.
- Product Substitutes: The emergence of alternative technologies, such as MEMS (Microelectromechanical Systems) and nanotechnology-based sensors, is increasing competition.
- End-User Segmentation: The market is highly fragmented across various end-user segments, with significant growth potential in automotive, consumer electronics, industrial automation, and healthcare.
- M&A Trends: Strategic mergers and acquisitions (M&A) are prevalent in the sensor industry, with an estimated xx Million in M&A activity in 2024. These activities contribute to market consolidation and expansion into new segments.
Americas Sensor Market Market Trends & Opportunities
The Americas sensor market is experiencing robust growth, driven by increasing automation across industries, rising demand for smart devices, and advancements in IoT (Internet of Things) technologies. The market size is projected to expand significantly over the forecast period. This growth is fueled by several key trends:
- Technological Shifts: The adoption of advanced sensor technologies like LiDAR, radar, and image sensors is transforming various sectors. Miniaturization and improved sensor integration are key technological trends.
- Consumer Preferences: The rising demand for sophisticated and connected devices, particularly in consumer electronics, drives the adoption of high-performance sensors. Consumers increasingly prioritize features that enhance user experience and safety.
- Competitive Dynamics: Intense competition among sensor manufacturers fosters innovation and drives down prices, making sensors more accessible across various applications. The market is witnessing a significant increase in the number of players and product offerings.
Dominant Markets & Segments in Americas Sensor Market
The US currently dominates the Americas sensor market, driven by robust industrial automation, strong consumer electronics demand, and significant investments in R&D. Within the segment breakdown:
By Parameters Measured: Temperature sensors hold the largest market share, followed by pressure and proximity sensors. Growth in environmental and chemical sensors is also notable, driven by increasing environmental awareness and stringent regulations.
By Mode of Operation: Optical sensors dominate, followed by electrical resistance and capacitive sensors. The adoption of LiDAR and image sensors is rapidly growing, particularly in autonomous vehicles and advanced driver-assistance systems (ADAS).
By End-user Industry: The automotive sector is the leading end-user, driven by the proliferation of ADAS and the growing adoption of electric vehicles (EVs). Consumer electronics is another significant market segment, driven by the rising demand for smart wearables and home automation devices. The industrial and medical sectors also represent substantial growth opportunities.
- Key Growth Drivers (US Market):
- Strong industrial automation and manufacturing base.
- High adoption rates of smart technologies in consumer electronics.
- Significant government investments in R&D and infrastructure development.
- Stringent environmental and safety regulations, driving demand for monitoring solutions.
Americas Sensor Market Product Analysis
Recent product innovations showcase a trend towards miniaturization, higher accuracy, and improved power efficiency. New sensors are increasingly integrated with advanced functionalities, enabling seamless data processing and integration with IoT networks. These improvements enhance performance and expand application possibilities across diverse industries. Market fit is optimized by targeting specific application needs and offering customized solutions.
Key Drivers, Barriers & Challenges in Americas Sensor Market
Key Drivers:
- Technological advancements: Miniaturization, increased accuracy, and improved power efficiency.
- Rising demand from automation & IoT: Increased automation in manufacturing and the growth of smart devices.
- Government regulations & policies: Environmental regulations and safety standards drive sensor adoption.
Challenges:
- Supply chain disruptions: Global supply chain issues can impact sensor availability and pricing. Quantifiable impacts vary depending on the specific component and region.
- Regulatory hurdles: Meeting stringent safety and compliance requirements can be costly and time-consuming.
- Competitive pressure: Intense competition from established and emerging players leads to price pressure and a need for continuous innovation. The market share for the top 5 players is estimated at xx%.
Growth Drivers in the Americas Sensor Market Market
The market's growth is propelled by the increasing automation across various sectors, the proliferation of IoT devices, and the demand for advanced sensing technologies in applications such as autonomous vehicles and smart healthcare. Government initiatives promoting digital transformation and investments in infrastructure further contribute to the market’s expansion.
Challenges Impacting Americas Sensor Market Growth
Challenges include supply chain vulnerabilities, the complexity of complying with various regulations across different regions, and the intense competition from both established and emerging players. These factors can impact production timelines, costs, and market share.
Key Players Shaping the Americas Sensor Market Market
- Infineon Technologies AG
- Honeywell International Inc
- NXP Semiconductors NV
- Siemens AG
- Omron Corporation
- Omega Engineering Inc
- Sick AG
- BOSCH Sensortech GmbH
- TE Connectivity Ltd
- Texas Instruments Incorporated
- Rockwell Automation Inc
- ABB Limited
- AMS AG
Significant Americas Sensor Market Industry Milestones
- January 2023: OSRAM launched the Mira050, a high-sensitivity CMOS image sensor, enabling smaller and more power-efficient wearable and mobile devices. This enhances applications in 3D sensing, face recognition, and AR/VR/MR.
- February 2022: BOSCH introduced the BMP384, a rugged barometric pressure sensor with superior accuracy and water/dust resistance, improving the robustness of various OEM products.
Future Outlook for Americas Sensor Market Market
The Americas sensor market is poised for continued robust growth, driven by technological advancements, increasing automation, and the expansion of IoT applications. Strategic investments in R&D, coupled with the growing adoption of advanced sensors across various sectors, present significant opportunities for market expansion and innovation. The market's potential is substantial, with opportunities for both established players and new entrants.
Americas Sensor Market Segmentation
-
1. Parameters Measured
- 1.1. Temperature
- 1.2. Pessure
- 1.3. Level
- 1.4. Flow
- 1.5. Proximity
- 1.6. Environmental
- 1.7. Chemical
- 1.8. Inertial
- 1.9. Magnetic
- 1.10. Vibration
- 1.11. Other Parameters Measured
-
2. Mode of Operations
- 2.1. Optical
- 2.2. Electrical Resistance
- 2.3. Biosenser
- 2.4. Piezoresistive
- 2.5. Image
- 2.6. Capacitive
- 2.7. Piezoelectric
- 2.8. LiDAR
- 2.9. Radar
- 2.10. Other Modes of Operation
-
3. End-user Industry
- 3.1. Automotive
-
3.2. Consumer Electronics
- 3.2.1. Smartphones
- 3.2.2. Tablets, Laptops, and Computers
- 3.2.3. Wearable Devices
- 3.2.4. Smart Appliances or Devices
- 3.2.5. Other Consumer Electronics
- 3.3. Energy
- 3.4. Industrial and Other
- 3.5. Medical and Wellness
- 3.6. Construction, Agriculture, and Mining
- 3.7. Aerospace
- 3.8. Defense
-
4. Geography
-
4.1. Americas
- 4.1.1. United States
- 4.1.2. Canada
- 4.1.3. Brazil
-
4.1. Americas
Americas Sensor Market Segmentation By Geography
-
1. Americas
- 1.1. United States
- 1.2. Canada
- 1.3. Brazil
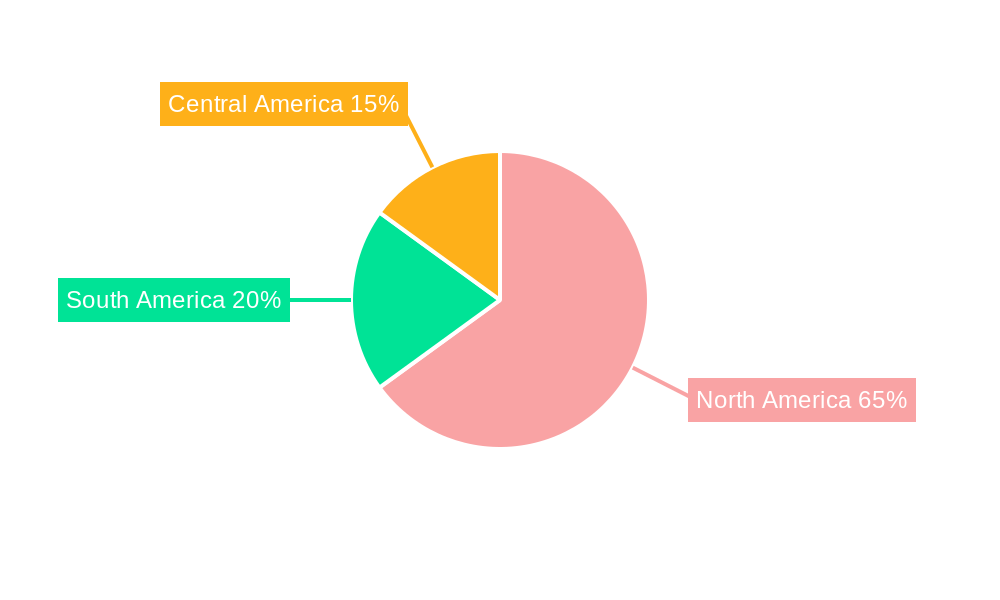
Americas Sensor Market Regional Market Share
Geographic Coverage of Americas Sensor Market
Americas Sensor Market REPORT HIGHLIGHTS
| Aspects | Details |
|---|---|
| Study Period | 2020-2034 |
| Base Year | 2025 |
| Estimated Year | 2026 |
| Forecast Period | 2026-2034 |
| Historical Period | 2020-2025 |
| Growth Rate | CAGR of 6.48% from 2020-2034 |
| Segmentation |
|
Table of Contents
- 1. Introduction
- 1.1. Research Scope
- 1.2. Market Segmentation
- 1.3. Research Objective
- 1.4. Definitions and Assumptions
- 2. Executive Summary
- 2.1. Market Snapshot
- 3. Market Dynamics
- 3.1. Market Drivers
- 3.2. Market Restrains
- 3.3. Market Trends
- 3.4. Market Opportunities
- 4. Market Factor Analysis
- 4.1. Porters Five Forces
- 4.1.1. Bargaining Power of Suppliers
- 4.1.2. Bargaining Power of Buyers
- 4.1.3. Threat of New Entrants
- 4.1.4. Threat of Substitutes
- 4.1.5. Competitive Rivalry
- 4.2. PESTEL analysis
- 4.3. BCG Analysis
- 4.3.1. Stars (High Growth, High Market Share)
- 4.3.2. Cash Cows (Low Growth, High Market Share)
- 4.3.3. Question Mark (High Growth, Low Market Share)
- 4.3.4. Dogs (Low Growth, Low Market Share)
- 4.4. Ansoff Matrix Analysis
- 4.5. Supply Chain Analysis
- 4.6. Regulatory Landscape
- 4.7. Current Market Potential and Opportunity Assessment (TAM–SAM–SOM Framework)
- 4.8. TIR Analyst Note
- 4.1. Porters Five Forces
- 5. Market Analysis, Insights and Forecast 2021-2033
- 5.1. Market Analysis, Insights and Forecast - by Parameters Measured
- 5.1.1. Temperature
- 5.1.2. Pessure
- 5.1.3. Level
- 5.1.4. Flow
- 5.1.5. Proximity
- 5.1.6. Environmental
- 5.1.7. Chemical
- 5.1.8. Inertial
- 5.1.9. Magnetic
- 5.1.10. Vibration
- 5.1.11. Other Parameters Measured
- 5.2. Market Analysis, Insights and Forecast - by Mode of Operations
- 5.2.1. Optical
- 5.2.2. Electrical Resistance
- 5.2.3. Biosenser
- 5.2.4. Piezoresistive
- 5.2.5. Image
- 5.2.6. Capacitive
- 5.2.7. Piezoelectric
- 5.2.8. LiDAR
- 5.2.9. Radar
- 5.2.10. Other Modes of Operation
- 5.3. Market Analysis, Insights and Forecast - by End-user Industry
- 5.3.1. Automotive
- 5.3.2. Consumer Electronics
- 5.3.2.1. Smartphones
- 5.3.2.2. Tablets, Laptops, and Computers
- 5.3.2.3. Wearable Devices
- 5.3.2.4. Smart Appliances or Devices
- 5.3.2.5. Other Consumer Electronics
- 5.3.3. Energy
- 5.3.4. Industrial and Other
- 5.3.5. Medical and Wellness
- 5.3.6. Construction, Agriculture, and Mining
- 5.3.7. Aerospace
- 5.3.8. Defense
- 5.4. Market Analysis, Insights and Forecast - by Geography
- 5.4.1. Americas
- 5.4.1.1. United States
- 5.4.1.2. Canada
- 5.4.1.3. Brazil
- 5.4.1. Americas
- 5.5. Market Analysis, Insights and Forecast - by Region
- 5.5.1. Americas
- 5.1. Market Analysis, Insights and Forecast - by Parameters Measured
- 6. Americas Sensor Market Analysis, Insights and Forecast, 2021-2033
- 6.1. Market Analysis, Insights and Forecast - by Parameters Measured
- 6.1.1. Temperature
- 6.1.2. Pessure
- 6.1.3. Level
- 6.1.4. Flow
- 6.1.5. Proximity
- 6.1.6. Environmental
- 6.1.7. Chemical
- 6.1.8. Inertial
- 6.1.9. Magnetic
- 6.1.10. Vibration
- 6.1.11. Other Parameters Measured
- 6.2. Market Analysis, Insights and Forecast - by Mode of Operations
- 6.2.1. Optical
- 6.2.2. Electrical Resistance
- 6.2.3. Biosenser
- 6.2.4. Piezoresistive
- 6.2.5. Image
- 6.2.6. Capacitive
- 6.2.7. Piezoelectric
- 6.2.8. LiDAR
- 6.2.9. Radar
- 6.2.10. Other Modes of Operation
- 6.3. Market Analysis, Insights and Forecast - by End-user Industry
- 6.3.1. Automotive
- 6.3.2. Consumer Electronics
- 6.3.2.1. Smartphones
- 6.3.2.2. Tablets, Laptops, and Computers
- 6.3.2.3. Wearable Devices
- 6.3.2.4. Smart Appliances or Devices
- 6.3.2.5. Other Consumer Electronics
- 6.3.3. Energy
- 6.3.4. Industrial and Other
- 6.3.5. Medical and Wellness
- 6.3.6. Construction, Agriculture, and Mining
- 6.3.7. Aerospace
- 6.3.8. Defense
- 6.4. Market Analysis, Insights and Forecast - by Geography
- 6.4.1. Americas
- 6.4.1.1. United States
- 6.4.1.2. Canada
- 6.4.1.3. Brazil
- 6.4.1. Americas
- 6.1. Market Analysis, Insights and Forecast - by Parameters Measured
- 7. Competitive Analysis
- 7.1. Company Profiles
- 7.1.1 Infineon Technologies AG
- 7.1.1.1. Company Overview
- 7.1.1.2. Products
- 7.1.1.3. Company Financials
- 7.1.1.4. SWOT Analysis
- 7.1.2 Honeywell International Inc
- 7.1.2.1. Company Overview
- 7.1.2.2. Products
- 7.1.2.3. Company Financials
- 7.1.2.4. SWOT Analysis
- 7.1.3 NXP Semiconductors NV
- 7.1.3.1. Company Overview
- 7.1.3.2. Products
- 7.1.3.3. Company Financials
- 7.1.3.4. SWOT Analysis
- 7.1.4 Siemens AG
- 7.1.4.1. Company Overview
- 7.1.4.2. Products
- 7.1.4.3. Company Financials
- 7.1.4.4. SWOT Analysis
- 7.1.5 Omron Corporation*List Not Exhaustive
- 7.1.5.1. Company Overview
- 7.1.5.2. Products
- 7.1.5.3. Company Financials
- 7.1.5.4. SWOT Analysis
- 7.1.6 Omega Engineering Inc
- 7.1.6.1. Company Overview
- 7.1.6.2. Products
- 7.1.6.3. Company Financials
- 7.1.6.4. SWOT Analysis
- 7.1.7 Sick AG
- 7.1.7.1. Company Overview
- 7.1.7.2. Products
- 7.1.7.3. Company Financials
- 7.1.7.4. SWOT Analysis
- 7.1.8 BOSCH Sensortech GmbH
- 7.1.8.1. Company Overview
- 7.1.8.2. Products
- 7.1.8.3. Company Financials
- 7.1.8.4. SWOT Analysis
- 7.1.9 TE Connectivity Ltd
- 7.1.9.1. Company Overview
- 7.1.9.2. Products
- 7.1.9.3. Company Financials
- 7.1.9.4. SWOT Analysis
- 7.1.10 Texas Instruments Incorporated
- 7.1.10.1. Company Overview
- 7.1.10.2. Products
- 7.1.10.3. Company Financials
- 7.1.10.4. SWOT Analysis
- 7.1.11 Rockwell Automation Inc
- 7.1.11.1. Company Overview
- 7.1.11.2. Products
- 7.1.11.3. Company Financials
- 7.1.11.4. SWOT Analysis
- 7.1.12 ABB Limited
- 7.1.12.1. Company Overview
- 7.1.12.2. Products
- 7.1.12.3. Company Financials
- 7.1.12.4. SWOT Analysis
- 7.1.13 AMS AG
- 7.1.13.1. Company Overview
- 7.1.13.2. Products
- 7.1.13.3. Company Financials
- 7.1.13.4. SWOT Analysis
- 7.1.1 Infineon Technologies AG
- 7.2. Market Entropy
- 7.2.1 Company's Key Areas Served
- 7.2.2 Recent Developments
- 7.3. Company Market Share Analysis 2025
- 7.3.1 Top 5 Companies Market Share Analysis
- 7.3.2 Top 3 Companies Market Share Analysis
- 7.4. List of Potential Customers
- 8. Research Methodology
List of Figures
- Figure 1: Americas Sensor Market Revenue Breakdown (Million, %) by Product 2025 & 2033
- Figure 2: Americas Sensor Market Share (%) by Company 2025
List of Tables
- Table 1: Americas Sensor Market Revenue Million Forecast, by Parameters Measured 2020 & 2033
- Table 2: Americas Sensor Market Revenue Million Forecast, by Mode of Operations 2020 & 2033
- Table 3: Americas Sensor Market Revenue Million Forecast, by End-user Industry 2020 & 2033
- Table 4: Americas Sensor Market Revenue Million Forecast, by Geography 2020 & 2033
- Table 5: Americas Sensor Market Revenue Million Forecast, by Region 2020 & 2033
- Table 6: Americas Sensor Market Revenue Million Forecast, by Parameters Measured 2020 & 2033
- Table 7: Americas Sensor Market Revenue Million Forecast, by Mode of Operations 2020 & 2033
- Table 8: Americas Sensor Market Revenue Million Forecast, by End-user Industry 2020 & 2033
- Table 9: Americas Sensor Market Revenue Million Forecast, by Geography 2020 & 2033
- Table 10: Americas Sensor Market Revenue Million Forecast, by Country 2020 & 2033
- Table 11: United States Americas Sensor Market Revenue (Million) Forecast, by Application 2020 & 2033
- Table 12: Canada Americas Sensor Market Revenue (Million) Forecast, by Application 2020 & 2033
- Table 13: Brazil Americas Sensor Market Revenue (Million) Forecast, by Application 2020 & 2033
Frequently Asked Questions
1. What is the projected Compound Annual Growth Rate (CAGR) of the Americas Sensor Market?
The projected CAGR is approximately 6.48%.
2. Which companies are prominent players in the Americas Sensor Market?
Key companies in the market include Infineon Technologies AG, Honeywell International Inc, NXP Semiconductors NV, Siemens AG, Omron Corporation*List Not Exhaustive, Omega Engineering Inc, Sick AG, BOSCH Sensortech GmbH, TE Connectivity Ltd, Texas Instruments Incorporated, Rockwell Automation Inc, ABB Limited, AMS AG.
3. What are the main segments of the Americas Sensor Market?
The market segments include Parameters Measured, Mode of Operations, End-user Industry, Geography.
4. Can you provide details about the market size?
The market size is estimated to be USD 38.27 Million as of 2022.
5. What are some drivers contributing to market growth?
Increasing Use of Smartphoes and Other Electronics Devices; Growing Advancement in Automation Sector.
6. What are the notable trends driving market growth?
Increasing Use of Smartphones and Other Electronic Devices to Bolster Market Growth.
7. Are there any restraints impacting market growth?
Design Complexity and Performance Limitations in High-power Applications.
8. Can you provide examples of recent developments in the market?
January 2023: OSRAM announced the launch of its new product, the Mira050, a 2.3 x 2.8 mm, 0.5 Mpixel pipelined, high-sensitivity, global shutter CMOS image sensor. Due to the Mira050's high sensitivity to visible and near-infrared (NIR) light, wearable and mobile devices' size and power consumption can be decreased. The Mira050 can be used for 3D depth sensing for face recognition in smart door locks, eye tracking, gesture tracking, and contextual awareness in AR/VR/MR headsets.
9. What pricing options are available for accessing the report?
Pricing options include single-user, multi-user, and enterprise licenses priced at USD 4750, USD 5250, and USD 8750 respectively.
10. Is the market size provided in terms of value or volume?
The market size is provided in terms of value, measured in Million.
11. Are there any specific market keywords associated with the report?
Yes, the market keyword associated with the report is "Americas Sensor Market," which aids in identifying and referencing the specific market segment covered.
12. How do I determine which pricing option suits my needs best?
The pricing options vary based on user requirements and access needs. Individual users may opt for single-user licenses, while businesses requiring broader access may choose multi-user or enterprise licenses for cost-effective access to the report.
13. Are there any additional resources or data provided in the Americas Sensor Market report?
While the report offers comprehensive insights, it's advisable to review the specific contents or supplementary materials provided to ascertain if additional resources or data are available.
14. How can I stay updated on further developments or reports in the Americas Sensor Market?
To stay informed about further developments, trends, and reports in the Americas Sensor Market, consider subscribing to industry newsletters, following relevant companies and organizations, or regularly checking reputable industry news sources and publications.
Methodology
Step 1 - Identification of Relevant Samples Size from Population Database


Step 2 - Approaches for Defining Global Market Size (Value, Volume* & Price*)

Note*: In applicable scenarios
Step 3 - Data Sources
Primary Research
- Web Analytics
- Survey Reports
- Research Institute
- Latest Research Reports
- Opinion Leaders
Secondary Research
- Annual Reports
- White Paper
- Latest Press Release
- Industry Association
- Paid Database
- Investor Presentations

Step 4 - Data Triangulation
Involves using different sources of information in order to increase the validity of a study
These sources are likely to be stakeholders in a program - participants, other researchers, program staff, other community members, and so on.
Then we put all data in single framework & apply various statistical tools to find out the dynamic on the market.
During the analysis stage, feedback from the stakeholder groups would be compared to determine areas of agreement as well as areas of divergence