

Key Insights
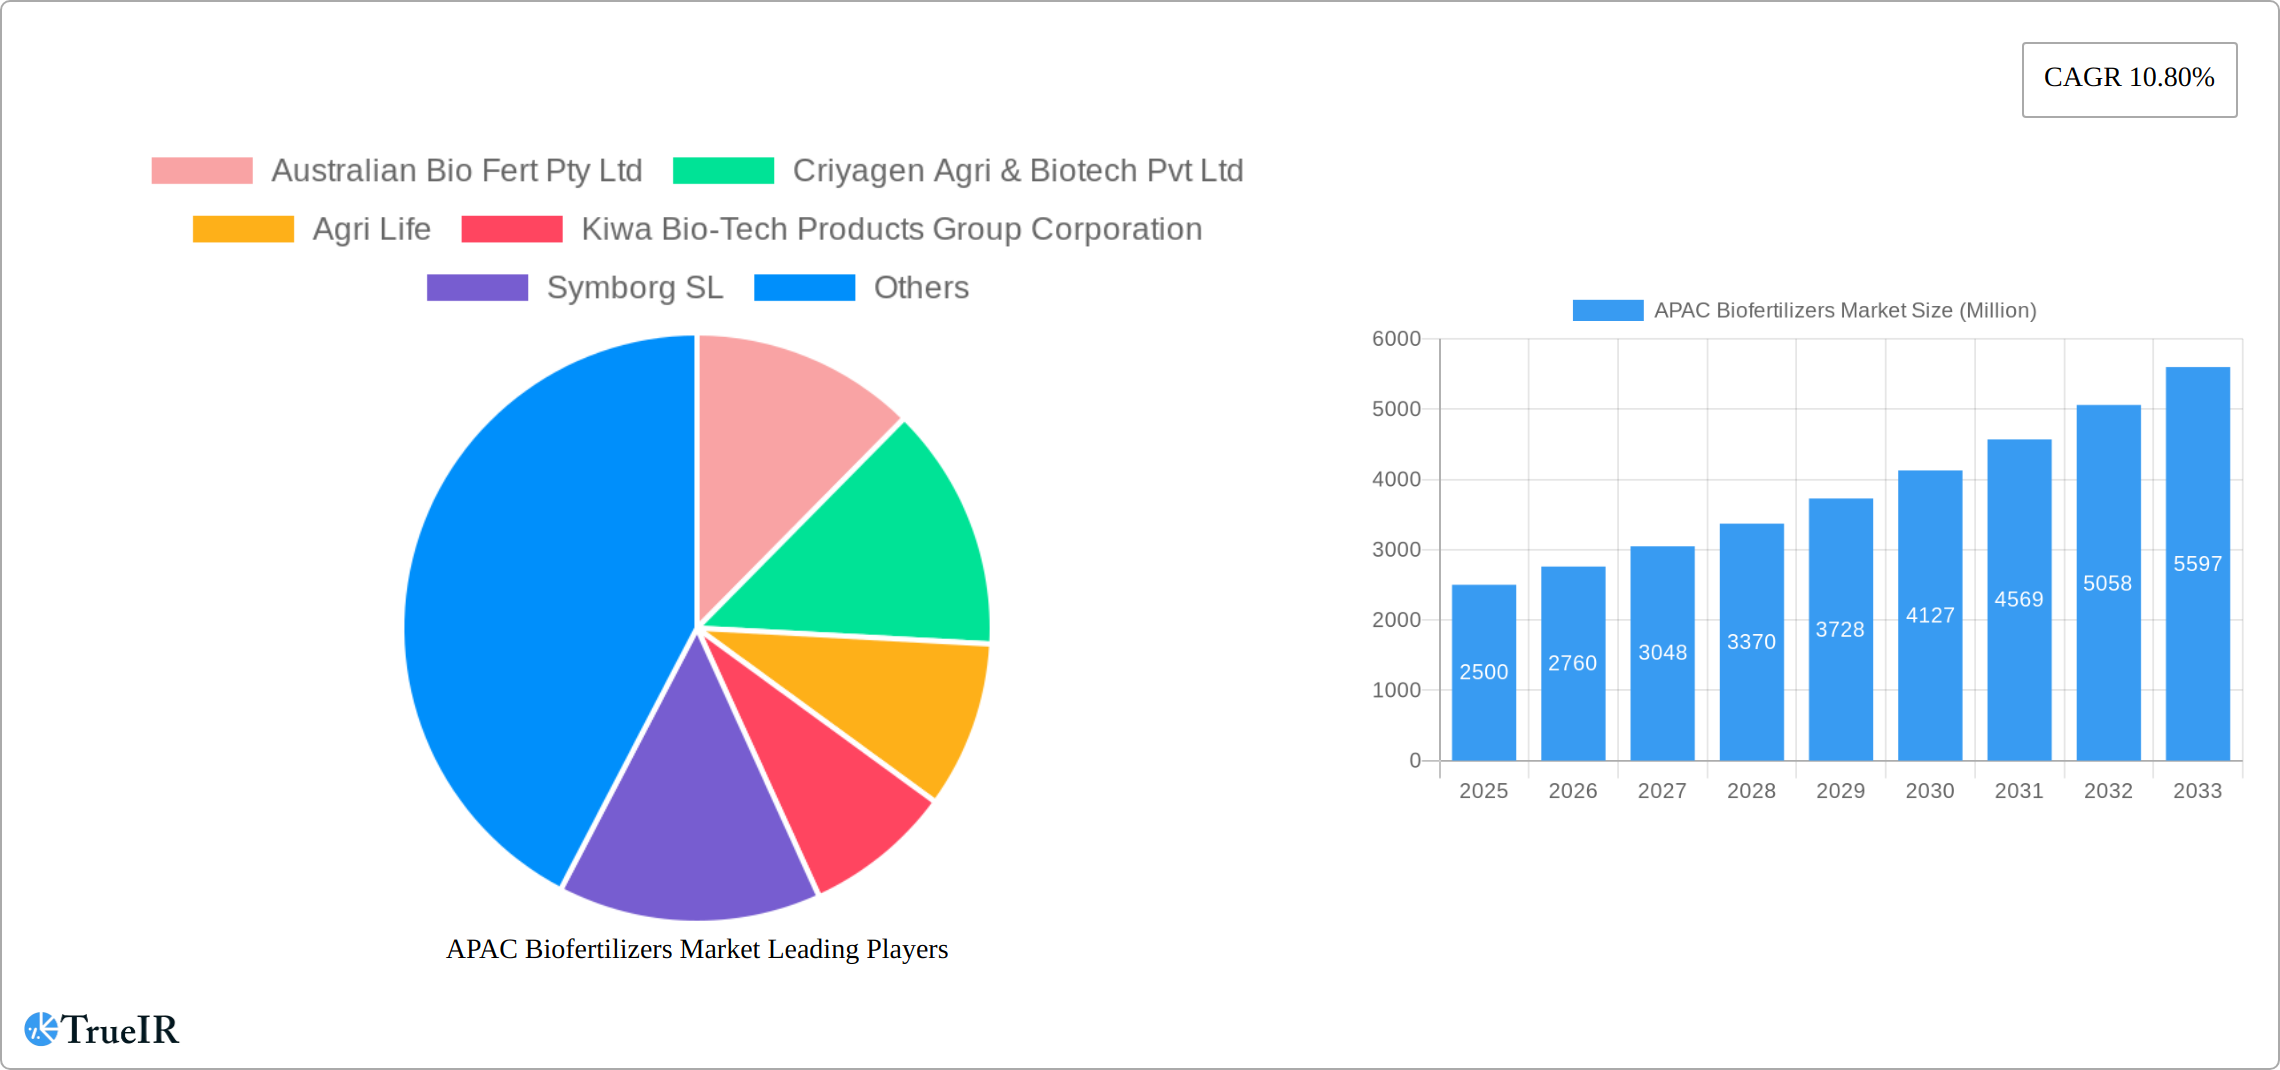
The Asia-Pacific (APAC) biofertilizers market is experiencing robust growth, driven by increasing demand for sustainable and eco-friendly agricultural practices. The region's large agricultural sector, coupled with rising concerns about chemical fertilizer overuse and its environmental impact, fuels the adoption of biofertilizers. A compound annual growth rate (CAGR) of 10.80% indicates significant market expansion. Specific drivers include government initiatives promoting sustainable agriculture, rising awareness among farmers about the benefits of biofertilizers (enhanced nutrient uptake, improved soil health, reduced environmental pollution), and increasing crop yields. The market is segmented by microorganism type (Rhizobium, Azospirillum, Azotobacter, Blue-Green Algae, Phosphate Solubilizing Bacteria, Mycorrhiza, and others) and application (grains & cereals, pulses & oilseeds, commercial crops, fruits & vegetables, and others). India and China, with their vast agricultural lands and growing populations, are major contributors to the regional market's growth. However, challenges remain, including a lack of awareness among smaller farmers, inconsistent product quality, and high initial investment costs. Despite these challenges, the market's overall trajectory remains positive, indicating a promising future for biofertilizers in the APAC region. Further growth will likely be fueled by technological advancements leading to improved efficacy and cost-effectiveness of biofertilizers, coupled with supportive government policies and increased farmer education.
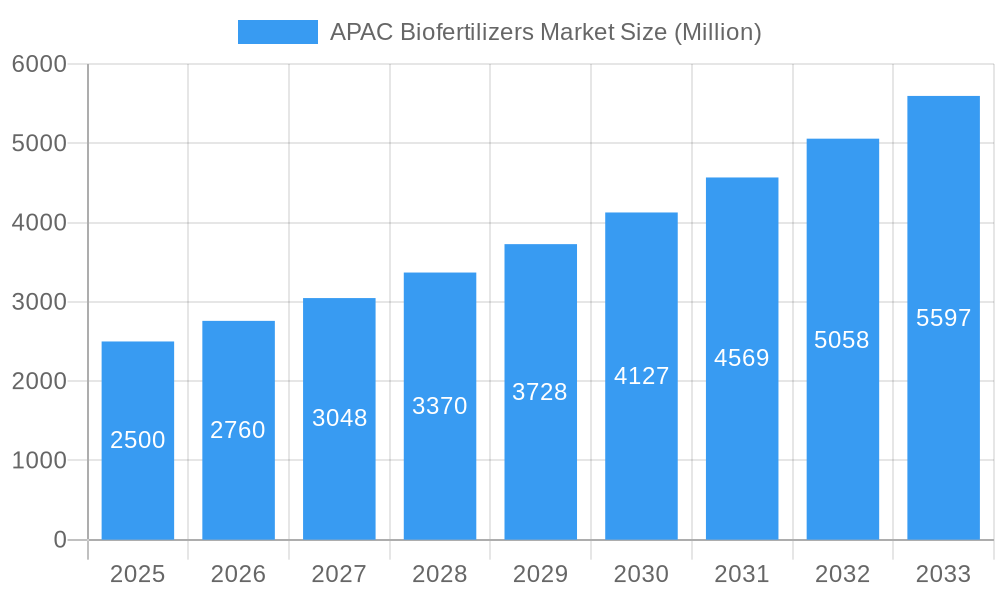
APAC Biofertilizers Market Market Size (In Billion)
The market's segmentation reveals specific opportunities. For instance, the demand for biofertilizers suited to specific crops like rice, wheat, and pulses is high in India, while China’s large commercial crop sector presents significant opportunities for specialized biofertilizer applications. The successful integration of biofertilizers with precision agriculture techniques can further boost market growth. Key players are focusing on research and development to create improved biofertilizer formulations, expanding their product portfolios to cater to diverse agricultural needs. Strategic partnerships with agricultural extension services and farmer cooperatives will be crucial for wider market penetration and increased adoption rates. The continuous rise in demand for organic and sustainable food products globally also supports the long-term growth outlook of the APAC biofertilizers market.
APAC Biofertilizers Market Company Market Share
APAC Biofertilizers Market: A Comprehensive Market Report (2019-2033)
This dynamic report provides a detailed analysis of the Asia-Pacific Biofertilizers Market, offering invaluable insights for stakeholders across the agricultural and biotechnology sectors. Leveraging extensive research and data spanning from 2019 to 2033, this report covers market size, segmentation, competitive landscape, growth drivers, challenges, and future outlook. The study period covers 2019–2033, with a base year of 2025 and a forecast period of 2025–2033. The historical period analyzed is 2019–2024. The report projects a significant market expansion, with expected values reaching xx Million by 2033. Keywords: APAC Biofertilizers Market, Biofertilizers, Rhizobium, Azospirillum, Azotobacter, Blue-Green Algae, Phosphate Solubilizing Bacteria, Mycorrhiza, Grains & Cereals, Pulses & Oilseeds, Commercial Crops, Fruits & Vegetables, Market Size, CAGR, Market Share, Competitive Landscape, Growth Drivers, Challenges, Australian Bio Fert Pty Ltd, Criyagen Agri & Biotech Pvt Ltd.
APAC Biofertilizers Market Structure & Competitive Landscape
The APAC biofertilizers market exhibits a moderately concentrated structure, with several key players holding significant market share. The Herfindahl-Hirschman Index (HHI) for 2024 is estimated at xx, indicating a moderately competitive landscape. However, the market is witnessing increasing innovation driven by the rising demand for sustainable agricultural practices and the growing awareness of environmental concerns. Stringent regulations regarding chemical fertilizer use are further bolstering the adoption of biofertilizers. Product substitutes, such as chemical fertilizers, pose a significant challenge but the increasing awareness of the environmental impact of chemical fertilizers is slowly shifting the market balance.
End-user segmentation is predominantly driven by the agriculture sector, with grains & cereals, pulses & oilseeds, and commercial crops comprising the largest segments. The market has observed a moderate level of mergers and acquisitions (M&A) activity in recent years, with xx M&A deals recorded between 2019 and 2024. These activities are primarily driven by companies seeking to expand their product portfolios and geographic reach. Further, the market is experiencing a push toward the development of advanced biofertilizer formulations, including those incorporating nanotechnology and other novel delivery systems.
APAC Biofertilizers Market Trends & Opportunities
The APAC biofertilizers market is experiencing robust growth, driven by factors such as increasing agricultural output, rising demand for sustainable agriculture, favorable government policies promoting organic farming, and growing awareness of the negative environmental impacts of chemical fertilizers. The market size was valued at xx Million in 2024 and is projected to reach xx Million by 2033, exhibiting a CAGR of xx% during the forecast period. This growth is further fueled by technological advancements leading to more efficient and effective biofertilizer formulations. Consumer preferences are shifting towards eco-friendly and sustainable agricultural practices, which is a significant driver of market growth. The market is also witnessing increased competition, with both established players and new entrants vying for market share. The market penetration rate for biofertilizers is expected to increase significantly over the forecast period, driven by rising awareness and government support.
Dominant Markets & Segments in APAC Biofertilizers Market
Leading Regions/Countries: India and China are currently the dominant markets in the APAC region, driven by factors such as large agricultural land areas, substantial government support for sustainable agriculture, and growing demand for food security. Other key markets include Indonesia, Thailand, and Vietnam.
Dominant Microorganism Segments: Rhizobium, Phosphate Solubilizing Bacteria, and Mycorrhiza are the leading segments within the microorganisms category. The high demand for these microorganisms is attributed to their effectiveness in enhancing nitrogen fixation, phosphate solubilization, and improved nutrient uptake by crops.
Dominant Application Segments: Grains & cereals, pulses & oilseeds, and commercial crops dominate the application segments. This is due to the significant area under these crops and the high potential for yield improvement using biofertilizers.
Key Growth Drivers:
- Favorable Government Policies: Numerous APAC countries are implementing policies promoting sustainable agriculture and reducing reliance on chemical fertilizers, significantly boosting the market for biofertilizers.
- Growing Awareness: Increased consumer awareness regarding the environmental benefits of biofertilizers is driving market adoption.
- Technological Advancements: Innovation in biofertilizer formulations, improving efficacy and ease of use, is expanding the market.
- Infrastructure Development: Improved agricultural infrastructure, including better irrigation systems and storage facilities, supports the widespread use of biofertilizers.
APAC Biofertilizers Market Product Analysis
Technological advancements are driving product innovation in the APAC biofertilizers market. This includes the development of improved formulations with enhanced shelf life and efficacy, as well as the use of nanotechnology to improve nutrient delivery to plants. These innovations cater to the rising demand for cost-effective, environment-friendly, and high-performing biofertilizers, which aligns well with the sustainability goals of the region. Competition among companies is driving the need for continuous innovation in formulation, packaging, and delivery systems.
Key Drivers, Barriers & Challenges in APAC Biofertilizers Market
Key Drivers:
- Growing awareness of environmental concerns related to chemical fertilizers.
- Increasing demand for sustainable and organic agricultural practices.
- Favorable government regulations and subsidies promoting biofertilizer usage.
- Technological advancements leading to improved product efficacy and cost-effectiveness.
Challenges and Restraints:
- High initial investment costs associated with biofertilizer production and distribution.
- Lack of awareness and understanding among farmers regarding the benefits of biofertilizers.
- Limited availability and accessibility of quality biofertilizers in certain regions.
- Competition from established chemical fertilizer manufacturers. The market share loss for chemical fertilizers is estimated at a -xx% CAGR over the next decade.
Growth Drivers in the APAC Biofertilizers Market
The APAC biofertilizers market is experiencing robust growth fueled by increasing government support for sustainable agriculture, rising consumer demand for organically produced food, and advancements in biofertilizer technology resulting in enhanced product efficacy. This is further accelerated by favorable government policies and initiatives aimed at reducing the environmental impact of traditional agriculture. The growing awareness of climate change and its effects on agriculture is also driving the adoption of biofertilizers as a sustainable alternative.
Challenges Impacting APAC Biofertilizers Market Growth
The APAC biofertilizers market faces several significant hurdles to widespread adoption. High upfront costs for farmers remain a major barrier, often outweighing perceived short-term benefits. This is compounded by a lack of widespread awareness and insufficient farmer education on the proper application and efficacy of biofertilizers. Inconsistent supply chains further exacerbate the problem, leading to unreliable product availability and impacting farmer confidence. Navigating the regulatory landscape also presents a challenge, with varying and sometimes complex regulations across different APAC countries adding to the complexity of market entry and expansion. Finally, established chemical fertilizer companies pose significant competition, though their market dominance is projected to decline by xx% by 2033, presenting an opportunity for biofertilizer providers to capture market share.
Key Players Shaping the APAC Biofertilizers Market
- Australian Bio Fert Pty Ltd
- Criyagen Agri & Biotech Pvt Ltd
- Agri Life
- Kiwa Bio-Tech Products Group Corporation
- Symborg SL
- CBF China Biofertilizers AG
- Biomax Naturals
- Agrinos AS
- BioAg Pty Ltd
- Camson Biotechnologies Limited
- National Fertilizer Ltd
Significant APAP Biofertilizers Market Industry Milestones
- 2020: Introduction of a new Rhizobium-based biofertilizer with enhanced nitrogen-fixing capabilities by Symborg SL.
- 2021: Government of India launches a large-scale biofertilizer promotion program.
- 2022: Merger of two key players in the Chinese biofertilizer market.
- 2023: Launch of a novel phosphate solubilizing bacteria formulation by Agrinos AS.
- 2024: Several key players invest heavily in R&D for advanced biofertilizer formulations.
Future Outlook for APAC Biofertilizers Market
Despite the challenges, the APAC biofertilizers market exhibits strong growth potential. This positive outlook is fueled by several key factors. The increasing global emphasis on sustainable agriculture, coupled with supportive government initiatives and policies promoting eco-friendly farming practices in many APAC nations, creates a favorable environment for biofertilizer adoption. Technological advancements are also playing a crucial role, resulting in more efficient and effective biofertilizer formulations with improved performance and application methods. The rising awareness of environmental concerns, the urgent need for enhanced food security in a rapidly growing population, and the increasing demand for organic and sustainably produced food are all powerful drivers of market expansion. Strategic partnerships, mergers and acquisitions, and substantial investments in research and development are expected to further stimulate innovation and accelerate the growth of this dynamic market, presenting significant opportunities for both established players and new entrants.
APAC Biofertilizers Market Segmentation
- 1. Production Analysis
- 2. Consumption Analysis
- 3. Import Market Analysis (Value & Volume)
- 4. Export Market Analysis (Value & Volume)
- 5. Price Trend Analysis
APAC Biofertilizers Market Segmentation By Geography
-
1. North America
- 1.1. United States
- 1.2. Canada
- 1.3. Mexico
-
2. South America
- 2.1. Brazil
- 2.2. Argentina
- 2.3. Rest of South America
-
3. Europe
- 3.1. United Kingdom
- 3.2. Germany
- 3.3. France
- 3.4. Italy
- 3.5. Spain
- 3.6. Russia
- 3.7. Benelux
- 3.8. Nordics
- 3.9. Rest of Europe
-
4. Middle East & Africa
- 4.1. Turkey
- 4.2. Israel
- 4.3. GCC
- 4.4. North Africa
- 4.5. South Africa
- 4.6. Rest of Middle East & Africa
-
5. Asia Pacific
- 5.1. China
- 5.2. India
- 5.3. Japan
- 5.4. South Korea
- 5.5. ASEAN
- 5.6. Oceania
- 5.7. Rest of Asia Pacific
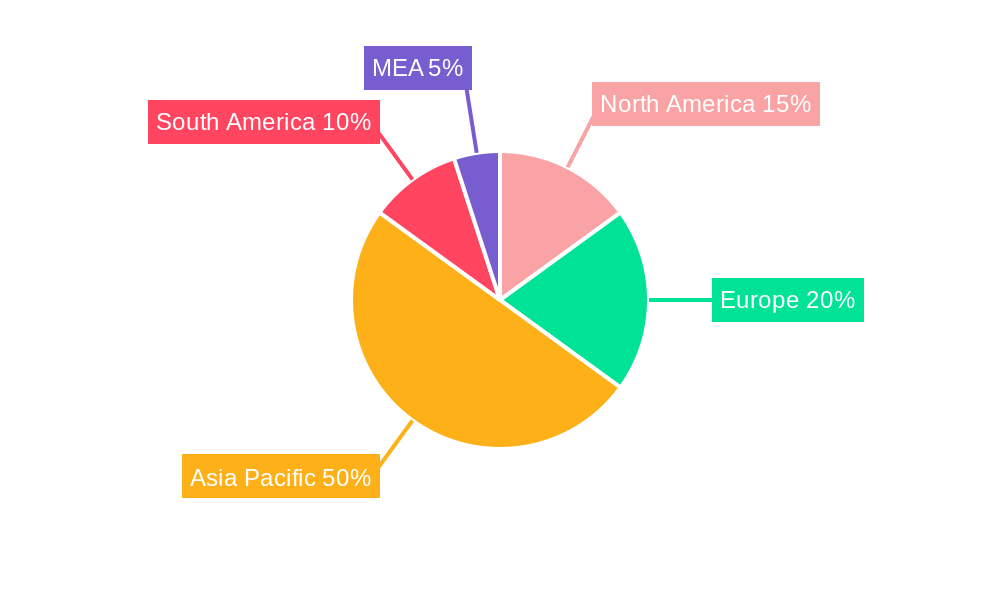
APAC Biofertilizers Market Regional Market Share
Geographic Coverage of APAC Biofertilizers Market
APAC Biofertilizers Market REPORT HIGHLIGHTS
| Aspects | Details |
|---|---|
| Study Period | 2020-2034 |
| Base Year | 2025 |
| Estimated Year | 2026 |
| Forecast Period | 2026-2034 |
| Historical Period | 2020-2025 |
| Growth Rate | CAGR of 13.6% from 2020-2034 |
| Segmentation |
|
Table of Contents
- 1. Introduction
- 1.1. Research Scope
- 1.2. Market Segmentation
- 1.3. Research Methodology
- 1.4. Definitions and Assumptions
- 2. Executive Summary
- 2.1. Introduction
- 3. Market Dynamics
- 3.1. Introduction
- 3.2. Market Drivers
- 3.2.1. Seed Treatment As A Solution To Enhance Yield; Growing Awareness For Seed Treatment Among The Farmers; Rising Trend Of Organic Farming
- 3.3. Market Restrains
- 3.3.1. Limitations Across Farm-Level Seed Treatment; Rising Environmental Concerns
- 3.4. Market Trends
- 3.4.1. Increased Practice for Organic Farming
- 4. Market Factor Analysis
- 4.1. Porters Five Forces
- 4.2. Supply/Value Chain
- 4.3. PESTEL analysis
- 4.4. Market Entropy
- 4.5. Patent/Trademark Analysis
- 5. Global APAC Biofertilizers Market Analysis, Insights and Forecast, 2020-2032
- 5.1. Market Analysis, Insights and Forecast - by Production Analysis
- 5.2. Market Analysis, Insights and Forecast - by Consumption Analysis
- 5.3. Market Analysis, Insights and Forecast - by Import Market Analysis (Value & Volume)
- 5.4. Market Analysis, Insights and Forecast - by Export Market Analysis (Value & Volume)
- 5.5. Market Analysis, Insights and Forecast - by Price Trend Analysis
- 5.6. Market Analysis, Insights and Forecast - by Region
- 5.6.1. North America
- 5.6.2. South America
- 5.6.3. Europe
- 5.6.4. Middle East & Africa
- 5.6.5. Asia Pacific
- 5.1. Market Analysis, Insights and Forecast - by Production Analysis
- 6. North America APAC Biofertilizers Market Analysis, Insights and Forecast, 2020-2032
- 6.1. Market Analysis, Insights and Forecast - by Production Analysis
- 6.2. Market Analysis, Insights and Forecast - by Consumption Analysis
- 6.3. Market Analysis, Insights and Forecast - by Import Market Analysis (Value & Volume)
- 6.4. Market Analysis, Insights and Forecast - by Export Market Analysis (Value & Volume)
- 6.5. Market Analysis, Insights and Forecast - by Price Trend Analysis
- 6.1. Market Analysis, Insights and Forecast - by Production Analysis
- 7. South America APAC Biofertilizers Market Analysis, Insights and Forecast, 2020-2032
- 7.1. Market Analysis, Insights and Forecast - by Production Analysis
- 7.2. Market Analysis, Insights and Forecast - by Consumption Analysis
- 7.3. Market Analysis, Insights and Forecast - by Import Market Analysis (Value & Volume)
- 7.4. Market Analysis, Insights and Forecast - by Export Market Analysis (Value & Volume)
- 7.5. Market Analysis, Insights and Forecast - by Price Trend Analysis
- 7.1. Market Analysis, Insights and Forecast - by Production Analysis
- 8. Europe APAC Biofertilizers Market Analysis, Insights and Forecast, 2020-2032
- 8.1. Market Analysis, Insights and Forecast - by Production Analysis
- 8.2. Market Analysis, Insights and Forecast - by Consumption Analysis
- 8.3. Market Analysis, Insights and Forecast - by Import Market Analysis (Value & Volume)
- 8.4. Market Analysis, Insights and Forecast - by Export Market Analysis (Value & Volume)
- 8.5. Market Analysis, Insights and Forecast - by Price Trend Analysis
- 8.1. Market Analysis, Insights and Forecast - by Production Analysis
- 9. Middle East & Africa APAC Biofertilizers Market Analysis, Insights and Forecast, 2020-2032
- 9.1. Market Analysis, Insights and Forecast - by Production Analysis
- 9.2. Market Analysis, Insights and Forecast - by Consumption Analysis
- 9.3. Market Analysis, Insights and Forecast - by Import Market Analysis (Value & Volume)
- 9.4. Market Analysis, Insights and Forecast - by Export Market Analysis (Value & Volume)
- 9.5. Market Analysis, Insights and Forecast - by Price Trend Analysis
- 9.1. Market Analysis, Insights and Forecast - by Production Analysis
- 10. Asia Pacific APAC Biofertilizers Market Analysis, Insights and Forecast, 2020-2032
- 10.1. Market Analysis, Insights and Forecast - by Production Analysis
- 10.2. Market Analysis, Insights and Forecast - by Consumption Analysis
- 10.3. Market Analysis, Insights and Forecast - by Import Market Analysis (Value & Volume)
- 10.4. Market Analysis, Insights and Forecast - by Export Market Analysis (Value & Volume)
- 10.5. Market Analysis, Insights and Forecast - by Price Trend Analysis
- 10.1. Market Analysis, Insights and Forecast - by Production Analysis
- 11. Competitive Analysis
- 11.1. Global Market Share Analysis 2025
- 11.2. Company Profiles
- 11.2.1 Australian Bio Fert Pty Ltd
- 11.2.1.1. Overview
- 11.2.1.2. Products
- 11.2.1.3. SWOT Analysis
- 11.2.1.4. Recent Developments
- 11.2.1.5. Financials (Based on Availability)
- 11.2.2 Criyagen Agri & Biotech Pvt Ltd
- 11.2.2.1. Overview
- 11.2.2.2. Products
- 11.2.2.3. SWOT Analysis
- 11.2.2.4. Recent Developments
- 11.2.2.5. Financials (Based on Availability)
- 11.2.3 Agri Life
- 11.2.3.1. Overview
- 11.2.3.2. Products
- 11.2.3.3. SWOT Analysis
- 11.2.3.4. Recent Developments
- 11.2.3.5. Financials (Based on Availability)
- 11.2.4 Kiwa Bio-Tech Products Group Corporation
- 11.2.4.1. Overview
- 11.2.4.2. Products
- 11.2.4.3. SWOT Analysis
- 11.2.4.4. Recent Developments
- 11.2.4.5. Financials (Based on Availability)
- 11.2.5 Symborg SL
- 11.2.5.1. Overview
- 11.2.5.2. Products
- 11.2.5.3. SWOT Analysis
- 11.2.5.4. Recent Developments
- 11.2.5.5. Financials (Based on Availability)
- 11.2.6 CBF China Biofertilizers AG
- 11.2.6.1. Overview
- 11.2.6.2. Products
- 11.2.6.3. SWOT Analysis
- 11.2.6.4. Recent Developments
- 11.2.6.5. Financials (Based on Availability)
- 11.2.7 Biomax Naturals
- 11.2.7.1. Overview
- 11.2.7.2. Products
- 11.2.7.3. SWOT Analysis
- 11.2.7.4. Recent Developments
- 11.2.7.5. Financials (Based on Availability)
- 11.2.8 Agrinos AS
- 11.2.8.1. Overview
- 11.2.8.2. Products
- 11.2.8.3. SWOT Analysis
- 11.2.8.4. Recent Developments
- 11.2.8.5. Financials (Based on Availability)
- 11.2.9 BioAg Pty Ltd
- 11.2.9.1. Overview
- 11.2.9.2. Products
- 11.2.9.3. SWOT Analysis
- 11.2.9.4. Recent Developments
- 11.2.9.5. Financials (Based on Availability)
- 11.2.10 Camson Biotechnologies Limited
- 11.2.10.1. Overview
- 11.2.10.2. Products
- 11.2.10.3. SWOT Analysis
- 11.2.10.4. Recent Developments
- 11.2.10.5. Financials (Based on Availability)
- 11.2.11 National Fertilizer Ltd
- 11.2.11.1. Overview
- 11.2.11.2. Products
- 11.2.11.3. SWOT Analysis
- 11.2.11.4. Recent Developments
- 11.2.11.5. Financials (Based on Availability)
- 11.2.1 Australian Bio Fert Pty Ltd
List of Figures
- Figure 1: Global APAC Biofertilizers Market Revenue Breakdown (undefined, %) by Region 2025 & 2033
- Figure 2: Global APAC Biofertilizers Market Volume Breakdown (Kiloton, %) by Region 2025 & 2033
- Figure 3: North America APAC Biofertilizers Market Revenue (undefined), by Production Analysis 2025 & 2033
- Figure 4: North America APAC Biofertilizers Market Volume (Kiloton), by Production Analysis 2025 & 2033
- Figure 5: North America APAC Biofertilizers Market Revenue Share (%), by Production Analysis 2025 & 2033
- Figure 6: North America APAC Biofertilizers Market Volume Share (%), by Production Analysis 2025 & 2033
- Figure 7: North America APAC Biofertilizers Market Revenue (undefined), by Consumption Analysis 2025 & 2033
- Figure 8: North America APAC Biofertilizers Market Volume (Kiloton), by Consumption Analysis 2025 & 2033
- Figure 9: North America APAC Biofertilizers Market Revenue Share (%), by Consumption Analysis 2025 & 2033
- Figure 10: North America APAC Biofertilizers Market Volume Share (%), by Consumption Analysis 2025 & 2033
- Figure 11: North America APAC Biofertilizers Market Revenue (undefined), by Import Market Analysis (Value & Volume) 2025 & 2033
- Figure 12: North America APAC Biofertilizers Market Volume (Kiloton), by Import Market Analysis (Value & Volume) 2025 & 2033
- Figure 13: North America APAC Biofertilizers Market Revenue Share (%), by Import Market Analysis (Value & Volume) 2025 & 2033
- Figure 14: North America APAC Biofertilizers Market Volume Share (%), by Import Market Analysis (Value & Volume) 2025 & 2033
- Figure 15: North America APAC Biofertilizers Market Revenue (undefined), by Export Market Analysis (Value & Volume) 2025 & 2033
- Figure 16: North America APAC Biofertilizers Market Volume (Kiloton), by Export Market Analysis (Value & Volume) 2025 & 2033
- Figure 17: North America APAC Biofertilizers Market Revenue Share (%), by Export Market Analysis (Value & Volume) 2025 & 2033
- Figure 18: North America APAC Biofertilizers Market Volume Share (%), by Export Market Analysis (Value & Volume) 2025 & 2033
- Figure 19: North America APAC Biofertilizers Market Revenue (undefined), by Price Trend Analysis 2025 & 2033
- Figure 20: North America APAC Biofertilizers Market Volume (Kiloton), by Price Trend Analysis 2025 & 2033
- Figure 21: North America APAC Biofertilizers Market Revenue Share (%), by Price Trend Analysis 2025 & 2033
- Figure 22: North America APAC Biofertilizers Market Volume Share (%), by Price Trend Analysis 2025 & 2033
- Figure 23: North America APAC Biofertilizers Market Revenue (undefined), by Country 2025 & 2033
- Figure 24: North America APAC Biofertilizers Market Volume (Kiloton), by Country 2025 & 2033
- Figure 25: North America APAC Biofertilizers Market Revenue Share (%), by Country 2025 & 2033
- Figure 26: North America APAC Biofertilizers Market Volume Share (%), by Country 2025 & 2033
- Figure 27: South America APAC Biofertilizers Market Revenue (undefined), by Production Analysis 2025 & 2033
- Figure 28: South America APAC Biofertilizers Market Volume (Kiloton), by Production Analysis 2025 & 2033
- Figure 29: South America APAC Biofertilizers Market Revenue Share (%), by Production Analysis 2025 & 2033
- Figure 30: South America APAC Biofertilizers Market Volume Share (%), by Production Analysis 2025 & 2033
- Figure 31: South America APAC Biofertilizers Market Revenue (undefined), by Consumption Analysis 2025 & 2033
- Figure 32: South America APAC Biofertilizers Market Volume (Kiloton), by Consumption Analysis 2025 & 2033
- Figure 33: South America APAC Biofertilizers Market Revenue Share (%), by Consumption Analysis 2025 & 2033
- Figure 34: South America APAC Biofertilizers Market Volume Share (%), by Consumption Analysis 2025 & 2033
- Figure 35: South America APAC Biofertilizers Market Revenue (undefined), by Import Market Analysis (Value & Volume) 2025 & 2033
- Figure 36: South America APAC Biofertilizers Market Volume (Kiloton), by Import Market Analysis (Value & Volume) 2025 & 2033
- Figure 37: South America APAC Biofertilizers Market Revenue Share (%), by Import Market Analysis (Value & Volume) 2025 & 2033
- Figure 38: South America APAC Biofertilizers Market Volume Share (%), by Import Market Analysis (Value & Volume) 2025 & 2033
- Figure 39: South America APAC Biofertilizers Market Revenue (undefined), by Export Market Analysis (Value & Volume) 2025 & 2033
- Figure 40: South America APAC Biofertilizers Market Volume (Kiloton), by Export Market Analysis (Value & Volume) 2025 & 2033
- Figure 41: South America APAC Biofertilizers Market Revenue Share (%), by Export Market Analysis (Value & Volume) 2025 & 2033
- Figure 42: South America APAC Biofertilizers Market Volume Share (%), by Export Market Analysis (Value & Volume) 2025 & 2033
- Figure 43: South America APAC Biofertilizers Market Revenue (undefined), by Price Trend Analysis 2025 & 2033
- Figure 44: South America APAC Biofertilizers Market Volume (Kiloton), by Price Trend Analysis 2025 & 2033
- Figure 45: South America APAC Biofertilizers Market Revenue Share (%), by Price Trend Analysis 2025 & 2033
- Figure 46: South America APAC Biofertilizers Market Volume Share (%), by Price Trend Analysis 2025 & 2033
- Figure 47: South America APAC Biofertilizers Market Revenue (undefined), by Country 2025 & 2033
- Figure 48: South America APAC Biofertilizers Market Volume (Kiloton), by Country 2025 & 2033
- Figure 49: South America APAC Biofertilizers Market Revenue Share (%), by Country 2025 & 2033
- Figure 50: South America APAC Biofertilizers Market Volume Share (%), by Country 2025 & 2033
- Figure 51: Europe APAC Biofertilizers Market Revenue (undefined), by Production Analysis 2025 & 2033
- Figure 52: Europe APAC Biofertilizers Market Volume (Kiloton), by Production Analysis 2025 & 2033
- Figure 53: Europe APAC Biofertilizers Market Revenue Share (%), by Production Analysis 2025 & 2033
- Figure 54: Europe APAC Biofertilizers Market Volume Share (%), by Production Analysis 2025 & 2033
- Figure 55: Europe APAC Biofertilizers Market Revenue (undefined), by Consumption Analysis 2025 & 2033
- Figure 56: Europe APAC Biofertilizers Market Volume (Kiloton), by Consumption Analysis 2025 & 2033
- Figure 57: Europe APAC Biofertilizers Market Revenue Share (%), by Consumption Analysis 2025 & 2033
- Figure 58: Europe APAC Biofertilizers Market Volume Share (%), by Consumption Analysis 2025 & 2033
- Figure 59: Europe APAC Biofertilizers Market Revenue (undefined), by Import Market Analysis (Value & Volume) 2025 & 2033
- Figure 60: Europe APAC Biofertilizers Market Volume (Kiloton), by Import Market Analysis (Value & Volume) 2025 & 2033
- Figure 61: Europe APAC Biofertilizers Market Revenue Share (%), by Import Market Analysis (Value & Volume) 2025 & 2033
- Figure 62: Europe APAC Biofertilizers Market Volume Share (%), by Import Market Analysis (Value & Volume) 2025 & 2033
- Figure 63: Europe APAC Biofertilizers Market Revenue (undefined), by Export Market Analysis (Value & Volume) 2025 & 2033
- Figure 64: Europe APAC Biofertilizers Market Volume (Kiloton), by Export Market Analysis (Value & Volume) 2025 & 2033
- Figure 65: Europe APAC Biofertilizers Market Revenue Share (%), by Export Market Analysis (Value & Volume) 2025 & 2033
- Figure 66: Europe APAC Biofertilizers Market Volume Share (%), by Export Market Analysis (Value & Volume) 2025 & 2033
- Figure 67: Europe APAC Biofertilizers Market Revenue (undefined), by Price Trend Analysis 2025 & 2033
- Figure 68: Europe APAC Biofertilizers Market Volume (Kiloton), by Price Trend Analysis 2025 & 2033
- Figure 69: Europe APAC Biofertilizers Market Revenue Share (%), by Price Trend Analysis 2025 & 2033
- Figure 70: Europe APAC Biofertilizers Market Volume Share (%), by Price Trend Analysis 2025 & 2033
- Figure 71: Europe APAC Biofertilizers Market Revenue (undefined), by Country 2025 & 2033
- Figure 72: Europe APAC Biofertilizers Market Volume (Kiloton), by Country 2025 & 2033
- Figure 73: Europe APAC Biofertilizers Market Revenue Share (%), by Country 2025 & 2033
- Figure 74: Europe APAC Biofertilizers Market Volume Share (%), by Country 2025 & 2033
- Figure 75: Middle East & Africa APAC Biofertilizers Market Revenue (undefined), by Production Analysis 2025 & 2033
- Figure 76: Middle East & Africa APAC Biofertilizers Market Volume (Kiloton), by Production Analysis 2025 & 2033
- Figure 77: Middle East & Africa APAC Biofertilizers Market Revenue Share (%), by Production Analysis 2025 & 2033
- Figure 78: Middle East & Africa APAC Biofertilizers Market Volume Share (%), by Production Analysis 2025 & 2033
- Figure 79: Middle East & Africa APAC Biofertilizers Market Revenue (undefined), by Consumption Analysis 2025 & 2033
- Figure 80: Middle East & Africa APAC Biofertilizers Market Volume (Kiloton), by Consumption Analysis 2025 & 2033
- Figure 81: Middle East & Africa APAC Biofertilizers Market Revenue Share (%), by Consumption Analysis 2025 & 2033
- Figure 82: Middle East & Africa APAC Biofertilizers Market Volume Share (%), by Consumption Analysis 2025 & 2033
- Figure 83: Middle East & Africa APAC Biofertilizers Market Revenue (undefined), by Import Market Analysis (Value & Volume) 2025 & 2033
- Figure 84: Middle East & Africa APAC Biofertilizers Market Volume (Kiloton), by Import Market Analysis (Value & Volume) 2025 & 2033
- Figure 85: Middle East & Africa APAC Biofertilizers Market Revenue Share (%), by Import Market Analysis (Value & Volume) 2025 & 2033
- Figure 86: Middle East & Africa APAC Biofertilizers Market Volume Share (%), by Import Market Analysis (Value & Volume) 2025 & 2033
- Figure 87: Middle East & Africa APAC Biofertilizers Market Revenue (undefined), by Export Market Analysis (Value & Volume) 2025 & 2033
- Figure 88: Middle East & Africa APAC Biofertilizers Market Volume (Kiloton), by Export Market Analysis (Value & Volume) 2025 & 2033
- Figure 89: Middle East & Africa APAC Biofertilizers Market Revenue Share (%), by Export Market Analysis (Value & Volume) 2025 & 2033
- Figure 90: Middle East & Africa APAC Biofertilizers Market Volume Share (%), by Export Market Analysis (Value & Volume) 2025 & 2033
- Figure 91: Middle East & Africa APAC Biofertilizers Market Revenue (undefined), by Price Trend Analysis 2025 & 2033
- Figure 92: Middle East & Africa APAC Biofertilizers Market Volume (Kiloton), by Price Trend Analysis 2025 & 2033
- Figure 93: Middle East & Africa APAC Biofertilizers Market Revenue Share (%), by Price Trend Analysis 2025 & 2033
- Figure 94: Middle East & Africa APAC Biofertilizers Market Volume Share (%), by Price Trend Analysis 2025 & 2033
- Figure 95: Middle East & Africa APAC Biofertilizers Market Revenue (undefined), by Country 2025 & 2033
- Figure 96: Middle East & Africa APAC Biofertilizers Market Volume (Kiloton), by Country 2025 & 2033
- Figure 97: Middle East & Africa APAC Biofertilizers Market Revenue Share (%), by Country 2025 & 2033
- Figure 98: Middle East & Africa APAC Biofertilizers Market Volume Share (%), by Country 2025 & 2033
- Figure 99: Asia Pacific APAC Biofertilizers Market Revenue (undefined), by Production Analysis 2025 & 2033
- Figure 100: Asia Pacific APAC Biofertilizers Market Volume (Kiloton), by Production Analysis 2025 & 2033
- Figure 101: Asia Pacific APAC Biofertilizers Market Revenue Share (%), by Production Analysis 2025 & 2033
- Figure 102: Asia Pacific APAC Biofertilizers Market Volume Share (%), by Production Analysis 2025 & 2033
- Figure 103: Asia Pacific APAC Biofertilizers Market Revenue (undefined), by Consumption Analysis 2025 & 2033
- Figure 104: Asia Pacific APAC Biofertilizers Market Volume (Kiloton), by Consumption Analysis 2025 & 2033
- Figure 105: Asia Pacific APAC Biofertilizers Market Revenue Share (%), by Consumption Analysis 2025 & 2033
- Figure 106: Asia Pacific APAC Biofertilizers Market Volume Share (%), by Consumption Analysis 2025 & 2033
- Figure 107: Asia Pacific APAC Biofertilizers Market Revenue (undefined), by Import Market Analysis (Value & Volume) 2025 & 2033
- Figure 108: Asia Pacific APAC Biofertilizers Market Volume (Kiloton), by Import Market Analysis (Value & Volume) 2025 & 2033
- Figure 109: Asia Pacific APAC Biofertilizers Market Revenue Share (%), by Import Market Analysis (Value & Volume) 2025 & 2033
- Figure 110: Asia Pacific APAC Biofertilizers Market Volume Share (%), by Import Market Analysis (Value & Volume) 2025 & 2033
- Figure 111: Asia Pacific APAC Biofertilizers Market Revenue (undefined), by Export Market Analysis (Value & Volume) 2025 & 2033
- Figure 112: Asia Pacific APAC Biofertilizers Market Volume (Kiloton), by Export Market Analysis (Value & Volume) 2025 & 2033
- Figure 113: Asia Pacific APAC Biofertilizers Market Revenue Share (%), by Export Market Analysis (Value & Volume) 2025 & 2033
- Figure 114: Asia Pacific APAC Biofertilizers Market Volume Share (%), by Export Market Analysis (Value & Volume) 2025 & 2033
- Figure 115: Asia Pacific APAC Biofertilizers Market Revenue (undefined), by Price Trend Analysis 2025 & 2033
- Figure 116: Asia Pacific APAC Biofertilizers Market Volume (Kiloton), by Price Trend Analysis 2025 & 2033
- Figure 117: Asia Pacific APAC Biofertilizers Market Revenue Share (%), by Price Trend Analysis 2025 & 2033
- Figure 118: Asia Pacific APAC Biofertilizers Market Volume Share (%), by Price Trend Analysis 2025 & 2033
- Figure 119: Asia Pacific APAC Biofertilizers Market Revenue (undefined), by Country 2025 & 2033
- Figure 120: Asia Pacific APAC Biofertilizers Market Volume (Kiloton), by Country 2025 & 2033
- Figure 121: Asia Pacific APAC Biofertilizers Market Revenue Share (%), by Country 2025 & 2033
- Figure 122: Asia Pacific APAC Biofertilizers Market Volume Share (%), by Country 2025 & 2033
List of Tables
- Table 1: Global APAC Biofertilizers Market Revenue undefined Forecast, by Production Analysis 2020 & 2033
- Table 2: Global APAC Biofertilizers Market Volume Kiloton Forecast, by Production Analysis 2020 & 2033
- Table 3: Global APAC Biofertilizers Market Revenue undefined Forecast, by Consumption Analysis 2020 & 2033
- Table 4: Global APAC Biofertilizers Market Volume Kiloton Forecast, by Consumption Analysis 2020 & 2033
- Table 5: Global APAC Biofertilizers Market Revenue undefined Forecast, by Import Market Analysis (Value & Volume) 2020 & 2033
- Table 6: Global APAC Biofertilizers Market Volume Kiloton Forecast, by Import Market Analysis (Value & Volume) 2020 & 2033
- Table 7: Global APAC Biofertilizers Market Revenue undefined Forecast, by Export Market Analysis (Value & Volume) 2020 & 2033
- Table 8: Global APAC Biofertilizers Market Volume Kiloton Forecast, by Export Market Analysis (Value & Volume) 2020 & 2033
- Table 9: Global APAC Biofertilizers Market Revenue undefined Forecast, by Price Trend Analysis 2020 & 2033
- Table 10: Global APAC Biofertilizers Market Volume Kiloton Forecast, by Price Trend Analysis 2020 & 2033
- Table 11: Global APAC Biofertilizers Market Revenue undefined Forecast, by Region 2020 & 2033
- Table 12: Global APAC Biofertilizers Market Volume Kiloton Forecast, by Region 2020 & 2033
- Table 13: Global APAC Biofertilizers Market Revenue undefined Forecast, by Production Analysis 2020 & 2033
- Table 14: Global APAC Biofertilizers Market Volume Kiloton Forecast, by Production Analysis 2020 & 2033
- Table 15: Global APAC Biofertilizers Market Revenue undefined Forecast, by Consumption Analysis 2020 & 2033
- Table 16: Global APAC Biofertilizers Market Volume Kiloton Forecast, by Consumption Analysis 2020 & 2033
- Table 17: Global APAC Biofertilizers Market Revenue undefined Forecast, by Import Market Analysis (Value & Volume) 2020 & 2033
- Table 18: Global APAC Biofertilizers Market Volume Kiloton Forecast, by Import Market Analysis (Value & Volume) 2020 & 2033
- Table 19: Global APAC Biofertilizers Market Revenue undefined Forecast, by Export Market Analysis (Value & Volume) 2020 & 2033
- Table 20: Global APAC Biofertilizers Market Volume Kiloton Forecast, by Export Market Analysis (Value & Volume) 2020 & 2033
- Table 21: Global APAC Biofertilizers Market Revenue undefined Forecast, by Price Trend Analysis 2020 & 2033
- Table 22: Global APAC Biofertilizers Market Volume Kiloton Forecast, by Price Trend Analysis 2020 & 2033
- Table 23: Global APAC Biofertilizers Market Revenue undefined Forecast, by Country 2020 & 2033
- Table 24: Global APAC Biofertilizers Market Volume Kiloton Forecast, by Country 2020 & 2033
- Table 25: United States APAC Biofertilizers Market Revenue (undefined) Forecast, by Application 2020 & 2033
- Table 26: United States APAC Biofertilizers Market Volume (Kiloton) Forecast, by Application 2020 & 2033
- Table 27: Canada APAC Biofertilizers Market Revenue (undefined) Forecast, by Application 2020 & 2033
- Table 28: Canada APAC Biofertilizers Market Volume (Kiloton) Forecast, by Application 2020 & 2033
- Table 29: Mexico APAC Biofertilizers Market Revenue (undefined) Forecast, by Application 2020 & 2033
- Table 30: Mexico APAC Biofertilizers Market Volume (Kiloton) Forecast, by Application 2020 & 2033
- Table 31: Global APAC Biofertilizers Market Revenue undefined Forecast, by Production Analysis 2020 & 2033
- Table 32: Global APAC Biofertilizers Market Volume Kiloton Forecast, by Production Analysis 2020 & 2033
- Table 33: Global APAC Biofertilizers Market Revenue undefined Forecast, by Consumption Analysis 2020 & 2033
- Table 34: Global APAC Biofertilizers Market Volume Kiloton Forecast, by Consumption Analysis 2020 & 2033
- Table 35: Global APAC Biofertilizers Market Revenue undefined Forecast, by Import Market Analysis (Value & Volume) 2020 & 2033
- Table 36: Global APAC Biofertilizers Market Volume Kiloton Forecast, by Import Market Analysis (Value & Volume) 2020 & 2033
- Table 37: Global APAC Biofertilizers Market Revenue undefined Forecast, by Export Market Analysis (Value & Volume) 2020 & 2033
- Table 38: Global APAC Biofertilizers Market Volume Kiloton Forecast, by Export Market Analysis (Value & Volume) 2020 & 2033
- Table 39: Global APAC Biofertilizers Market Revenue undefined Forecast, by Price Trend Analysis 2020 & 2033
- Table 40: Global APAC Biofertilizers Market Volume Kiloton Forecast, by Price Trend Analysis 2020 & 2033
- Table 41: Global APAC Biofertilizers Market Revenue undefined Forecast, by Country 2020 & 2033
- Table 42: Global APAC Biofertilizers Market Volume Kiloton Forecast, by Country 2020 & 2033
- Table 43: Brazil APAC Biofertilizers Market Revenue (undefined) Forecast, by Application 2020 & 2033
- Table 44: Brazil APAC Biofertilizers Market Volume (Kiloton) Forecast, by Application 2020 & 2033
- Table 45: Argentina APAC Biofertilizers Market Revenue (undefined) Forecast, by Application 2020 & 2033
- Table 46: Argentina APAC Biofertilizers Market Volume (Kiloton) Forecast, by Application 2020 & 2033
- Table 47: Rest of South America APAC Biofertilizers Market Revenue (undefined) Forecast, by Application 2020 & 2033
- Table 48: Rest of South America APAC Biofertilizers Market Volume (Kiloton) Forecast, by Application 2020 & 2033
- Table 49: Global APAC Biofertilizers Market Revenue undefined Forecast, by Production Analysis 2020 & 2033
- Table 50: Global APAC Biofertilizers Market Volume Kiloton Forecast, by Production Analysis 2020 & 2033
- Table 51: Global APAC Biofertilizers Market Revenue undefined Forecast, by Consumption Analysis 2020 & 2033
- Table 52: Global APAC Biofertilizers Market Volume Kiloton Forecast, by Consumption Analysis 2020 & 2033
- Table 53: Global APAC Biofertilizers Market Revenue undefined Forecast, by Import Market Analysis (Value & Volume) 2020 & 2033
- Table 54: Global APAC Biofertilizers Market Volume Kiloton Forecast, by Import Market Analysis (Value & Volume) 2020 & 2033
- Table 55: Global APAC Biofertilizers Market Revenue undefined Forecast, by Export Market Analysis (Value & Volume) 2020 & 2033
- Table 56: Global APAC Biofertilizers Market Volume Kiloton Forecast, by Export Market Analysis (Value & Volume) 2020 & 2033
- Table 57: Global APAC Biofertilizers Market Revenue undefined Forecast, by Price Trend Analysis 2020 & 2033
- Table 58: Global APAC Biofertilizers Market Volume Kiloton Forecast, by Price Trend Analysis 2020 & 2033
- Table 59: Global APAC Biofertilizers Market Revenue undefined Forecast, by Country 2020 & 2033
- Table 60: Global APAC Biofertilizers Market Volume Kiloton Forecast, by Country 2020 & 2033
- Table 61: United Kingdom APAC Biofertilizers Market Revenue (undefined) Forecast, by Application 2020 & 2033
- Table 62: United Kingdom APAC Biofertilizers Market Volume (Kiloton) Forecast, by Application 2020 & 2033
- Table 63: Germany APAC Biofertilizers Market Revenue (undefined) Forecast, by Application 2020 & 2033
- Table 64: Germany APAC Biofertilizers Market Volume (Kiloton) Forecast, by Application 2020 & 2033
- Table 65: France APAC Biofertilizers Market Revenue (undefined) Forecast, by Application 2020 & 2033
- Table 66: France APAC Biofertilizers Market Volume (Kiloton) Forecast, by Application 2020 & 2033
- Table 67: Italy APAC Biofertilizers Market Revenue (undefined) Forecast, by Application 2020 & 2033
- Table 68: Italy APAC Biofertilizers Market Volume (Kiloton) Forecast, by Application 2020 & 2033
- Table 69: Spain APAC Biofertilizers Market Revenue (undefined) Forecast, by Application 2020 & 2033
- Table 70: Spain APAC Biofertilizers Market Volume (Kiloton) Forecast, by Application 2020 & 2033
- Table 71: Russia APAC Biofertilizers Market Revenue (undefined) Forecast, by Application 2020 & 2033
- Table 72: Russia APAC Biofertilizers Market Volume (Kiloton) Forecast, by Application 2020 & 2033
- Table 73: Benelux APAC Biofertilizers Market Revenue (undefined) Forecast, by Application 2020 & 2033
- Table 74: Benelux APAC Biofertilizers Market Volume (Kiloton) Forecast, by Application 2020 & 2033
- Table 75: Nordics APAC Biofertilizers Market Revenue (undefined) Forecast, by Application 2020 & 2033
- Table 76: Nordics APAC Biofertilizers Market Volume (Kiloton) Forecast, by Application 2020 & 2033
- Table 77: Rest of Europe APAC Biofertilizers Market Revenue (undefined) Forecast, by Application 2020 & 2033
- Table 78: Rest of Europe APAC Biofertilizers Market Volume (Kiloton) Forecast, by Application 2020 & 2033
- Table 79: Global APAC Biofertilizers Market Revenue undefined Forecast, by Production Analysis 2020 & 2033
- Table 80: Global APAC Biofertilizers Market Volume Kiloton Forecast, by Production Analysis 2020 & 2033
- Table 81: Global APAC Biofertilizers Market Revenue undefined Forecast, by Consumption Analysis 2020 & 2033
- Table 82: Global APAC Biofertilizers Market Volume Kiloton Forecast, by Consumption Analysis 2020 & 2033
- Table 83: Global APAC Biofertilizers Market Revenue undefined Forecast, by Import Market Analysis (Value & Volume) 2020 & 2033
- Table 84: Global APAC Biofertilizers Market Volume Kiloton Forecast, by Import Market Analysis (Value & Volume) 2020 & 2033
- Table 85: Global APAC Biofertilizers Market Revenue undefined Forecast, by Export Market Analysis (Value & Volume) 2020 & 2033
- Table 86: Global APAC Biofertilizers Market Volume Kiloton Forecast, by Export Market Analysis (Value & Volume) 2020 & 2033
- Table 87: Global APAC Biofertilizers Market Revenue undefined Forecast, by Price Trend Analysis 2020 & 2033
- Table 88: Global APAC Biofertilizers Market Volume Kiloton Forecast, by Price Trend Analysis 2020 & 2033
- Table 89: Global APAC Biofertilizers Market Revenue undefined Forecast, by Country 2020 & 2033
- Table 90: Global APAC Biofertilizers Market Volume Kiloton Forecast, by Country 2020 & 2033
- Table 91: Turkey APAC Biofertilizers Market Revenue (undefined) Forecast, by Application 2020 & 2033
- Table 92: Turkey APAC Biofertilizers Market Volume (Kiloton) Forecast, by Application 2020 & 2033
- Table 93: Israel APAC Biofertilizers Market Revenue (undefined) Forecast, by Application 2020 & 2033
- Table 94: Israel APAC Biofertilizers Market Volume (Kiloton) Forecast, by Application 2020 & 2033
- Table 95: GCC APAC Biofertilizers Market Revenue (undefined) Forecast, by Application 2020 & 2033
- Table 96: GCC APAC Biofertilizers Market Volume (Kiloton) Forecast, by Application 2020 & 2033
- Table 97: North Africa APAC Biofertilizers Market Revenue (undefined) Forecast, by Application 2020 & 2033
- Table 98: North Africa APAC Biofertilizers Market Volume (Kiloton) Forecast, by Application 2020 & 2033
- Table 99: South Africa APAC Biofertilizers Market Revenue (undefined) Forecast, by Application 2020 & 2033
- Table 100: South Africa APAC Biofertilizers Market Volume (Kiloton) Forecast, by Application 2020 & 2033
- Table 101: Rest of Middle East & Africa APAC Biofertilizers Market Revenue (undefined) Forecast, by Application 2020 & 2033
- Table 102: Rest of Middle East & Africa APAC Biofertilizers Market Volume (Kiloton) Forecast, by Application 2020 & 2033
- Table 103: Global APAC Biofertilizers Market Revenue undefined Forecast, by Production Analysis 2020 & 2033
- Table 104: Global APAC Biofertilizers Market Volume Kiloton Forecast, by Production Analysis 2020 & 2033
- Table 105: Global APAC Biofertilizers Market Revenue undefined Forecast, by Consumption Analysis 2020 & 2033
- Table 106: Global APAC Biofertilizers Market Volume Kiloton Forecast, by Consumption Analysis 2020 & 2033
- Table 107: Global APAC Biofertilizers Market Revenue undefined Forecast, by Import Market Analysis (Value & Volume) 2020 & 2033
- Table 108: Global APAC Biofertilizers Market Volume Kiloton Forecast, by Import Market Analysis (Value & Volume) 2020 & 2033
- Table 109: Global APAC Biofertilizers Market Revenue undefined Forecast, by Export Market Analysis (Value & Volume) 2020 & 2033
- Table 110: Global APAC Biofertilizers Market Volume Kiloton Forecast, by Export Market Analysis (Value & Volume) 2020 & 2033
- Table 111: Global APAC Biofertilizers Market Revenue undefined Forecast, by Price Trend Analysis 2020 & 2033
- Table 112: Global APAC Biofertilizers Market Volume Kiloton Forecast, by Price Trend Analysis 2020 & 2033
- Table 113: Global APAC Biofertilizers Market Revenue undefined Forecast, by Country 2020 & 2033
- Table 114: Global APAC Biofertilizers Market Volume Kiloton Forecast, by Country 2020 & 2033
- Table 115: China APAC Biofertilizers Market Revenue (undefined) Forecast, by Application 2020 & 2033
- Table 116: China APAC Biofertilizers Market Volume (Kiloton) Forecast, by Application 2020 & 2033
- Table 117: India APAC Biofertilizers Market Revenue (undefined) Forecast, by Application 2020 & 2033
- Table 118: India APAC Biofertilizers Market Volume (Kiloton) Forecast, by Application 2020 & 2033
- Table 119: Japan APAC Biofertilizers Market Revenue (undefined) Forecast, by Application 2020 & 2033
- Table 120: Japan APAC Biofertilizers Market Volume (Kiloton) Forecast, by Application 2020 & 2033
- Table 121: South Korea APAC Biofertilizers Market Revenue (undefined) Forecast, by Application 2020 & 2033
- Table 122: South Korea APAC Biofertilizers Market Volume (Kiloton) Forecast, by Application 2020 & 2033
- Table 123: ASEAN APAC Biofertilizers Market Revenue (undefined) Forecast, by Application 2020 & 2033
- Table 124: ASEAN APAC Biofertilizers Market Volume (Kiloton) Forecast, by Application 2020 & 2033
- Table 125: Oceania APAC Biofertilizers Market Revenue (undefined) Forecast, by Application 2020 & 2033
- Table 126: Oceania APAC Biofertilizers Market Volume (Kiloton) Forecast, by Application 2020 & 2033
- Table 127: Rest of Asia Pacific APAC Biofertilizers Market Revenue (undefined) Forecast, by Application 2020 & 2033
- Table 128: Rest of Asia Pacific APAC Biofertilizers Market Volume (Kiloton) Forecast, by Application 2020 & 2033
Frequently Asked Questions
1. What is the projected Compound Annual Growth Rate (CAGR) of the APAC Biofertilizers Market?
The projected CAGR is approximately 13.6%.
2. Which companies are prominent players in the APAC Biofertilizers Market?
Key companies in the market include Australian Bio Fert Pty Ltd, Criyagen Agri & Biotech Pvt Ltd, Agri Life, Kiwa Bio-Tech Products Group Corporation, Symborg SL, CBF China Biofertilizers AG, Biomax Naturals, Agrinos AS, BioAg Pty Ltd, Camson Biotechnologies Limited, National Fertilizer Ltd.
3. What are the main segments of the APAC Biofertilizers Market?
The market segments include Production Analysis, Consumption Analysis, Import Market Analysis (Value & Volume), Export Market Analysis (Value & Volume), Price Trend Analysis.
4. Can you provide details about the market size?
The market size is estimated to be USD XXX N/A as of 2022.
5. What are some drivers contributing to market growth?
Seed Treatment As A Solution To Enhance Yield; Growing Awareness For Seed Treatment Among The Farmers; Rising Trend Of Organic Farming.
6. What are the notable trends driving market growth?
Increased Practice for Organic Farming.
7. Are there any restraints impacting market growth?
Limitations Across Farm-Level Seed Treatment; Rising Environmental Concerns.
8. Can you provide examples of recent developments in the market?
N/A
9. What pricing options are available for accessing the report?
Pricing options include single-user, multi-user, and enterprise licenses priced at USD 4750, USD 5250, and USD 8750 respectively.
10. Is the market size provided in terms of value or volume?
The market size is provided in terms of value, measured in N/A and volume, measured in Kiloton.
11. Are there any specific market keywords associated with the report?
Yes, the market keyword associated with the report is "APAC Biofertilizers Market," which aids in identifying and referencing the specific market segment covered.
12. How do I determine which pricing option suits my needs best?
The pricing options vary based on user requirements and access needs. Individual users may opt for single-user licenses, while businesses requiring broader access may choose multi-user or enterprise licenses for cost-effective access to the report.
13. Are there any additional resources or data provided in the APAC Biofertilizers Market report?
While the report offers comprehensive insights, it's advisable to review the specific contents or supplementary materials provided to ascertain if additional resources or data are available.
14. How can I stay updated on further developments or reports in the APAC Biofertilizers Market?
To stay informed about further developments, trends, and reports in the APAC Biofertilizers Market, consider subscribing to industry newsletters, following relevant companies and organizations, or regularly checking reputable industry news sources and publications.
Methodology
Step 1 - Identification of Relevant Samples Size from Population Database


Step 2 - Approaches for Defining Global Market Size (Value, Volume* & Price*)

Note*: In applicable scenarios
Step 3 - Data Sources
Primary Research
- Web Analytics
- Survey Reports
- Research Institute
- Latest Research Reports
- Opinion Leaders
Secondary Research
- Annual Reports
- White Paper
- Latest Press Release
- Industry Association
- Paid Database
- Investor Presentations

Step 4 - Data Triangulation
Involves using different sources of information in order to increase the validity of a study
These sources are likely to be stakeholders in a program - participants, other researchers, program staff, other community members, and so on.
Then we put all data in single framework & apply various statistical tools to find out the dynamic on the market.
During the analysis stage, feedback from the stakeholder groups would be compared to determine areas of agreement as well as areas of divergence