

Key Insights
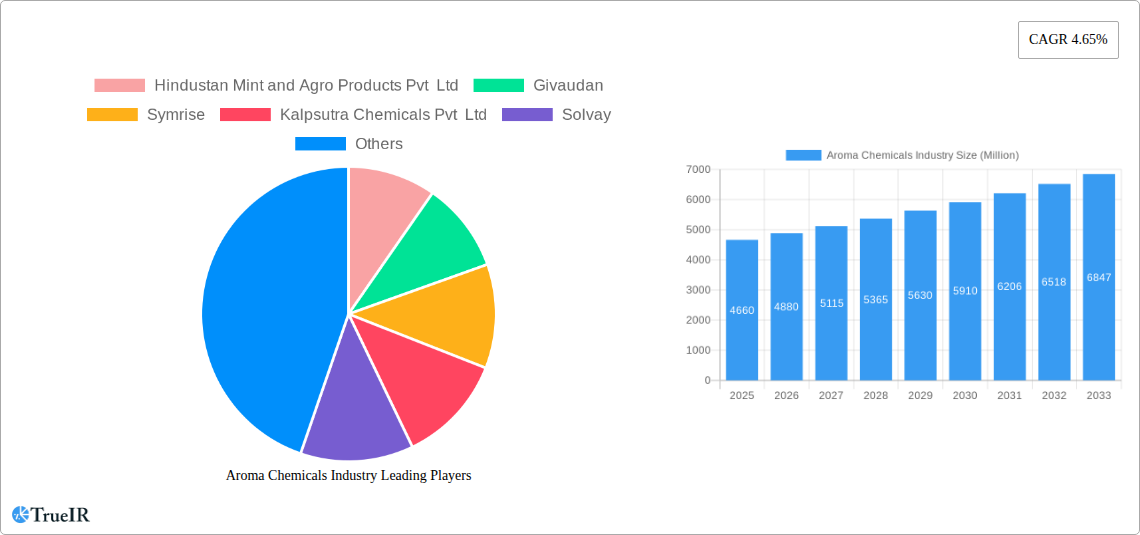
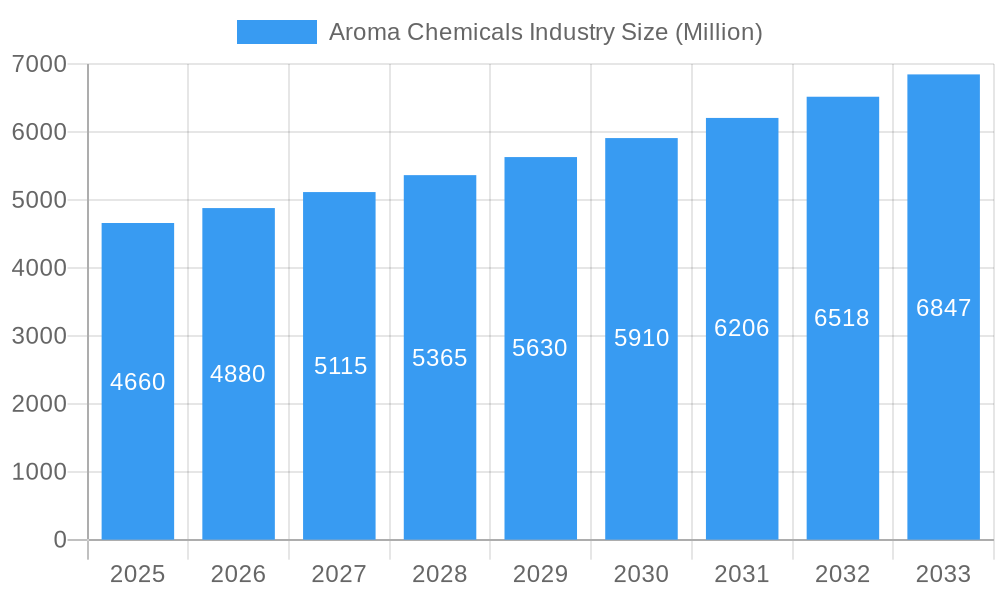
The aroma chemicals market, valued at $4.66 billion in 2025, is projected to experience robust growth, driven by increasing demand across diverse sectors. The compound annual growth rate (CAGR) of 4.65% from 2025 to 2033 indicates a significant expansion in market size. Key drivers include the rising popularity of natural and organic products in cosmetics and personal care, escalating demand for sophisticated fragrances in fine fragrances and household products, and the growing food and beverage industry's focus on enhancing flavor profiles. Furthermore, technological advancements in fragrance creation and delivery systems are fueling innovation and market growth. Segment-wise, the cosmetics and toiletries segment currently dominates, followed by fine fragrances and soap and detergents. However, the food and beverage segment is poised for significant growth, driven by increasing consumer preference for naturally derived flavor enhancers. Geographically, the Asia-Pacific region, particularly China and India, is expected to be a major growth engine, fueled by rising disposable incomes and changing consumer preferences. While North America and Europe maintain significant market shares, the growth rate in these regions is expected to be moderate compared to Asia-Pacific. Competition in this market is intense, with major players including Givaudan, Symrise, BASF SE, and Takasago International Corporation leveraging their extensive product portfolios and global reach. Smaller, specialized companies are focusing on niche segments like natural and sustainable aroma chemicals to carve out market share.
Aroma Chemicals Industry Market Size (In Billion)
The projected growth of the aroma chemicals market presents significant opportunities for both established players and new entrants. Strategic partnerships, mergers and acquisitions, and product diversification are key strategies being employed to enhance market presence and competitiveness. However, challenges such as stringent regulatory requirements regarding the safety and sustainability of aroma chemicals, fluctuating raw material prices, and the potential impact of economic downturns pose some headwinds. The industry is also responding to increasing consumer awareness of environmentally friendly practices through investments in sustainable sourcing and production methods. Companies are actively investing in research and development to create innovative products that meet the evolving needs of their diverse customer base. This includes developing sustainable and biodegradable options, exploring novel extraction techniques, and expanding into new application areas.
Aroma Chemicals Industry Company Market Share
Aroma Chemicals Industry Market Report: 2019-2033
This comprehensive report provides a detailed analysis of the Aroma Chemicals industry, covering market size, growth trends, competitive landscape, and future outlook from 2019 to 2033. With a focus on key segments and leading players, this report is an essential resource for businesses, investors, and anyone seeking to understand this dynamic market. The report includes detailed analysis of market structure, competitive dynamics, growth drivers, challenges, and significant industry milestones. The base year for this analysis is 2025, with forecasts extending to 2033.
Aroma Chemicals Industry Market Structure & Competitive Landscape
The global aroma chemicals market is characterized by a moderately concentrated structure, with a few multinational corporations dominating a significant portion of the market share. While precise concentration ratios require proprietary data, a qualitative assessment reveals a high level of competition among established players. Key players actively engage in mergers and acquisitions (M&A) to expand their product portfolios, enhance technological capabilities, and broaden their market reach. The total value of M&A deals in the aroma chemicals industry from 2019 to 2024 is estimated to be around $xx Million.
- Innovation Drivers: Continuous R&D investment in developing sustainable, natural, and high-performance aroma chemicals fuels market growth.
- Regulatory Impacts: Stringent regulations regarding the safety and usage of aroma chemicals significantly influence industry practices and product development.
- Product Substitutes: The availability of synthetic alternatives and the increasing preference for natural ingredients present both opportunities and challenges.
- End-User Segmentation: The market is segmented by application, with key segments including Soap and Detergents, Cosmetics and Toiletries, Fine Fragrances, Food and Beverage, and Household Products. Each segment exhibits unique growth dynamics.
- M&A Trends: Strategic acquisitions and mergers are prevalent, creating larger, more integrated players with broader product offerings and global reach.
Aroma Chemicals Industry Market Trends & Opportunities
The aroma chemicals market is poised for robust growth, driven by increasing consumer demand for enhanced sensory experiences, particularly in food and beverage, personal care, and home care products. The global market size is projected to reach $xx Million by 2033, exhibiting a Compound Annual Growth Rate (CAGR) of xx% during the forecast period (2025-2033). This growth is fueled by several key factors:
- Technological Advancements: Innovations in extraction techniques, synthetic chemistry, and bio-based alternatives are expanding the range of aroma chemicals available.
- Shifting Consumer Preferences: Growing awareness of natural and sustainable products is driving demand for naturally derived aroma chemicals. Premiumization and the search for unique sensory profiles are additional drivers.
- Competitive Dynamics: The market is characterized by both price competition and differentiation strategies based on innovation and product quality. Market penetration rates for key product segments are consistently rising.
- Regional Variations: Growth patterns vary across regions, with developing economies showcasing high growth potential due to rising disposable incomes and increasing demand for consumer goods.
Dominant Markets & Segments in Aroma Chemicals Industry
The global aroma chemicals market exhibits diverse growth patterns across regions and segments. While precise dominance requires detailed market share data not provided, qualitative insights suggest a few key segments and regions.
- Leading Region: The Asia-Pacific region, driven by rapid economic growth and increasing demand for consumer goods, likely represents a significant market share and substantial growth potential.
- Leading Country: China and India, due to their large populations and expanding consumer markets, are anticipated to be leading countries within the Asia-Pacific region.
- Leading Type Segments: Terpenes and Benzenoids, due to their wide applications and cost-effectiveness, likely constitute significant market shares.
- Leading Application Segments: Cosmetics and Toiletries, and Food and Beverage, due to their consistent demand for diverse aroma chemicals, are likely the dominant application segments.
Key Growth Drivers:
- Expanding Consumer Base: Rising disposable incomes and a growing middle class in developing economies drive demand for aromatic products.
- Favorable Government Policies: Support for the development of the natural products industry in several countries is promoting market growth.
- Technological Advancements: Innovations in extraction, synthesis and formulation methods contribute to higher efficiency and new product development.
Aroma Chemicals Industry Product Analysis
The aroma chemicals market offers a diverse range of products categorized by type (terpenes, benzenoids, musk chemicals, etc.) and application. Innovation focuses on enhancing product performance, sustainability, and meeting evolving consumer preferences for natural and safe ingredients. Key competitive advantages stem from superior product quality, cost-efficiency, and specialized formulations catering to specific applications. Technological advancements, such as bio-based production and improved extraction techniques, are leading to the development of more sustainable and high-performance aroma chemicals, enhancing market penetration and competitive differentiation.
Key Drivers, Barriers & Challenges in Aroma Chemicals Industry
Key Drivers:
- Increasing demand from the food & beverage, personal care, and household cleaning industries is a primary growth driver.
- Advancements in fragrance technology are creating new opportunities for innovation and differentiation.
- Growing consumer preference for natural and sustainable products is driving demand for naturally derived aroma chemicals.
Challenges and Restraints:
- Stringent regulations and safety concerns related to certain aroma chemicals pose challenges for the industry.
- Fluctuations in raw material prices and supply chain disruptions can impact profitability.
- Intense competition among established players and emerging companies creates price pressure. This can impact profit margins by approximately xx Million annually.
Growth Drivers in the Aroma Chemicals Industry Market
The aroma chemicals market is driven by several key factors, including the rising demand from various industries, technological advancements, and changing consumer preferences. The increasing use of aroma chemicals in food and beverages, personal care, and household products drives significant growth. Technological advancements in extraction, synthesis, and formulation methods are constantly expanding the range of available aroma chemicals and enhancing efficiency.
Challenges Impacting Aroma Chemicals Industry Growth
Challenges facing the aroma chemicals industry include stringent regulations on the use of certain chemicals, fluctuations in raw material prices, and intense competition. Supply chain disruptions, particularly those related to natural raw materials, can significantly impact production and profitability. Meeting the growing demand for natural and sustainable products requires significant investments in research and development.
Key Players Shaping the Aroma Chemicals Industry Market
- Hindustan Mint and Agro Products Pvt Ltd
- Givaudan
- Symrise
- Kalpsutra Chemicals Pvt Ltd
- Solvay
- Takasago International Corporation
- BASF SE
- S H Kelkar And Company Limited
- Robertet Group
- DSM
- Bell Flavors & Fragrances
- Treatt Plc
- Kao Corporation
- Silverline Chemicals
Significant Aroma Chemicals Industry Milestones
- September 2022: Solvay expanded its Rhovanil Natural CW product line with three new natural flavors (Delica, Alta, and Sublima), facilitating a cost-effective transition to natural products for the F&B industry. This significantly impacts market dynamics by increasing the availability of sustainable options.
- August 2022: Kao Corporation announced plans to maintain and expand its European market share for methyl dihydro jasmonate (MDJ), a synthetic fragrance, highlighting ongoing competition and the importance of synthetic options.
Future Outlook for Aroma Chemicals Industry Market
The aroma chemicals market is projected to experience continued growth, driven by the increasing demand from various sectors and ongoing innovations in fragrance technology. Strategic opportunities lie in developing sustainable and natural aroma chemicals, catering to the growing consumer preference for eco-friendly products. Expanding into new markets, particularly in developing economies, and focusing on product differentiation will be key success factors for companies in this industry. The market is expected to witness significant expansion in the coming years.
Aroma Chemicals Industry Segmentation
-
1. Type
- 1.1. Terpenes
- 1.2. Benzenoids
- 1.3. Musk Chemicals
- 1.4. Other Types
-
2. Application
- 2.1. Soap and Detergents
- 2.2. Cosmetics and Toiletries
- 2.3. Fine Fragrances
- 2.4. Household Products
- 2.5. Food and Beverage
- 2.6. Other Applications
Aroma Chemicals Industry Segmentation By Geography
-
1. Asia Pacific
- 1.1. China
- 1.2. India
- 1.3. Japan
- 1.4. South Korea
- 1.5. Rest of Asia Pacific
-
2. North America
- 2.1. United States
- 2.2. Canada
- 2.3. Mexico
-
3. Europe
- 3.1. Germany
- 3.2. United Kingdom
- 3.3. Italy
- 3.4. France
- 3.5. Rest of Europe
-
4. South America
- 4.1. Brazil
- 4.2. Argentina
- 4.3. Rest of South America
-
5. Middle East and Africa
- 5.1. Saudi Arabia
- 5.2. South Africa
- 5.3. Rest of Middle East and Africa
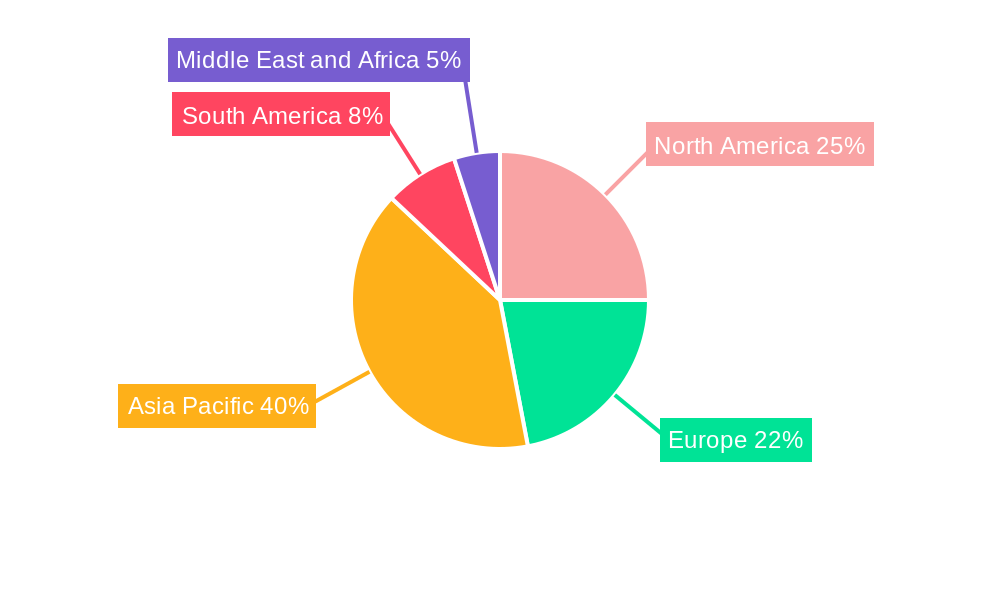
Aroma Chemicals Industry Regional Market Share
Geographic Coverage of Aroma Chemicals Industry
Aroma Chemicals Industry REPORT HIGHLIGHTS
| Aspects | Details |
|---|---|
| Study Period | 2020-2034 |
| Base Year | 2025 |
| Estimated Year | 2026 |
| Forecast Period | 2026-2034 |
| Historical Period | 2020-2025 |
| Growth Rate | CAGR of 4.65% from 2020-2034 |
| Segmentation |
|
Table of Contents
- 1. Introduction
- 1.1. Research Scope
- 1.2. Market Segmentation
- 1.3. Research Objective
- 1.4. Definitions and Assumptions
- 2. Executive Summary
- 2.1. Market Snapshot
- 3. Market Dynamics
- 3.1. Market Drivers
- 3.2. Market Restrains
- 3.3. Market Trends
- 3.4. Market Opportunities
- 4. Market Factor Analysis
- 4.1. Porters Five Forces
- 4.1.1. Bargaining Power of Suppliers
- 4.1.2. Bargaining Power of Buyers
- 4.1.3. Threat of New Entrants
- 4.1.4. Threat of Substitutes
- 4.1.5. Competitive Rivalry
- 4.2. PESTEL analysis
- 4.3. BCG Analysis
- 4.3.1. Stars (High Growth, High Market Share)
- 4.3.2. Cash Cows (Low Growth, High Market Share)
- 4.3.3. Question Mark (High Growth, Low Market Share)
- 4.3.4. Dogs (Low Growth, Low Market Share)
- 4.4. Ansoff Matrix Analysis
- 4.5. Supply Chain Analysis
- 4.6. Regulatory Landscape
- 4.7. Current Market Potential and Opportunity Assessment (TAM–SAM–SOM Framework)
- 4.8. TIR Analyst Note
- 4.1. Porters Five Forces
- 5. Market Analysis, Insights and Forecast 2021-2033
- 5.1. Market Analysis, Insights and Forecast - by Type
- 5.1.1. Terpenes
- 5.1.2. Benzenoids
- 5.1.3. Musk Chemicals
- 5.1.4. Other Types
- 5.2. Market Analysis, Insights and Forecast - by Application
- 5.2.1. Soap and Detergents
- 5.2.2. Cosmetics and Toiletries
- 5.2.3. Fine Fragrances
- 5.2.4. Household Products
- 5.2.5. Food and Beverage
- 5.2.6. Other Applications
- 5.3. Market Analysis, Insights and Forecast - by Region
- 5.3.1. Asia Pacific
- 5.3.2. North America
- 5.3.3. Europe
- 5.3.4. South America
- 5.3.5. Middle East and Africa
- 5.1. Market Analysis, Insights and Forecast - by Type
- 6. Global Aroma Chemicals Industry Analysis, Insights and Forecast, 2021-2033
- 6.1. Market Analysis, Insights and Forecast - by Type
- 6.1.1. Terpenes
- 6.1.2. Benzenoids
- 6.1.3. Musk Chemicals
- 6.1.4. Other Types
- 6.2. Market Analysis, Insights and Forecast - by Application
- 6.2.1. Soap and Detergents
- 6.2.2. Cosmetics and Toiletries
- 6.2.3. Fine Fragrances
- 6.2.4. Household Products
- 6.2.5. Food and Beverage
- 6.2.6. Other Applications
- 6.1. Market Analysis, Insights and Forecast - by Type
- 7. Asia Pacific Aroma Chemicals Industry Analysis, Insights and Forecast, 2020-2032
- 7.1. Market Analysis, Insights and Forecast - by Type
- 7.1.1. Terpenes
- 7.1.2. Benzenoids
- 7.1.3. Musk Chemicals
- 7.1.4. Other Types
- 7.2. Market Analysis, Insights and Forecast - by Application
- 7.2.1. Soap and Detergents
- 7.2.2. Cosmetics and Toiletries
- 7.2.3. Fine Fragrances
- 7.2.4. Household Products
- 7.2.5. Food and Beverage
- 7.2.6. Other Applications
- 7.1. Market Analysis, Insights and Forecast - by Type
- 8. North America Aroma Chemicals Industry Analysis, Insights and Forecast, 2020-2032
- 8.1. Market Analysis, Insights and Forecast - by Type
- 8.1.1. Terpenes
- 8.1.2. Benzenoids
- 8.1.3. Musk Chemicals
- 8.1.4. Other Types
- 8.2. Market Analysis, Insights and Forecast - by Application
- 8.2.1. Soap and Detergents
- 8.2.2. Cosmetics and Toiletries
- 8.2.3. Fine Fragrances
- 8.2.4. Household Products
- 8.2.5. Food and Beverage
- 8.2.6. Other Applications
- 8.1. Market Analysis, Insights and Forecast - by Type
- 9. Europe Aroma Chemicals Industry Analysis, Insights and Forecast, 2020-2032
- 9.1. Market Analysis, Insights and Forecast - by Type
- 9.1.1. Terpenes
- 9.1.2. Benzenoids
- 9.1.3. Musk Chemicals
- 9.1.4. Other Types
- 9.2. Market Analysis, Insights and Forecast - by Application
- 9.2.1. Soap and Detergents
- 9.2.2. Cosmetics and Toiletries
- 9.2.3. Fine Fragrances
- 9.2.4. Household Products
- 9.2.5. Food and Beverage
- 9.2.6. Other Applications
- 9.1. Market Analysis, Insights and Forecast - by Type
- 10. South America Aroma Chemicals Industry Analysis, Insights and Forecast, 2020-2032
- 10.1. Market Analysis, Insights and Forecast - by Type
- 10.1.1. Terpenes
- 10.1.2. Benzenoids
- 10.1.3. Musk Chemicals
- 10.1.4. Other Types
- 10.2. Market Analysis, Insights and Forecast - by Application
- 10.2.1. Soap and Detergents
- 10.2.2. Cosmetics and Toiletries
- 10.2.3. Fine Fragrances
- 10.2.4. Household Products
- 10.2.5. Food and Beverage
- 10.2.6. Other Applications
- 10.1. Market Analysis, Insights and Forecast - by Type
- 11. Middle East and Africa Aroma Chemicals Industry Analysis, Insights and Forecast, 2020-2032
- 11.1. Market Analysis, Insights and Forecast - by Type
- 11.1.1. Terpenes
- 11.1.2. Benzenoids
- 11.1.3. Musk Chemicals
- 11.1.4. Other Types
- 11.2. Market Analysis, Insights and Forecast - by Application
- 11.2.1. Soap and Detergents
- 11.2.2. Cosmetics and Toiletries
- 11.2.3. Fine Fragrances
- 11.2.4. Household Products
- 11.2.5. Food and Beverage
- 11.2.6. Other Applications
- 11.1. Market Analysis, Insights and Forecast - by Type
- 12. Competitive Analysis
- 12.1. Company Profiles
- 12.1.1 Hindustan Mint and Agro Products Pvt Ltd
- 12.1.1.1. Company Overview
- 12.1.1.2. Products
- 12.1.1.3. Company Financials
- 12.1.1.4. SWOT Analysis
- 12.1.2 Givaudan
- 12.1.2.1. Company Overview
- 12.1.2.2. Products
- 12.1.2.3. Company Financials
- 12.1.2.4. SWOT Analysis
- 12.1.3 Symrise
- 12.1.3.1. Company Overview
- 12.1.3.2. Products
- 12.1.3.3. Company Financials
- 12.1.3.4. SWOT Analysis
- 12.1.4 Kalpsutra Chemicals Pvt Ltd
- 12.1.4.1. Company Overview
- 12.1.4.2. Products
- 12.1.4.3. Company Financials
- 12.1.4.4. SWOT Analysis
- 12.1.5 Solvay
- 12.1.5.1. Company Overview
- 12.1.5.2. Products
- 12.1.5.3. Company Financials
- 12.1.5.4. SWOT Analysis
- 12.1.6 Takasago International Corporation
- 12.1.6.1. Company Overview
- 12.1.6.2. Products
- 12.1.6.3. Company Financials
- 12.1.6.4. SWOT Analysis
- 12.1.7 BASF SE
- 12.1.7.1. Company Overview
- 12.1.7.2. Products
- 12.1.7.3. Company Financials
- 12.1.7.4. SWOT Analysis
- 12.1.8 S H Kelkar And Company Limited
- 12.1.8.1. Company Overview
- 12.1.8.2. Products
- 12.1.8.3. Company Financials
- 12.1.8.4. SWOT Analysis
- 12.1.9 Robertet Group
- 12.1.9.1. Company Overview
- 12.1.9.2. Products
- 12.1.9.3. Company Financials
- 12.1.9.4. SWOT Analysis
- 12.1.10 DSM
- 12.1.10.1. Company Overview
- 12.1.10.2. Products
- 12.1.10.3. Company Financials
- 12.1.10.4. SWOT Analysis
- 12.1.11 Bell Flavors & Fragrances
- 12.1.11.1. Company Overview
- 12.1.11.2. Products
- 12.1.11.3. Company Financials
- 12.1.11.4. SWOT Analysis
- 12.1.12 Treatt Plc*List Not Exhaustive
- 12.1.12.1. Company Overview
- 12.1.12.2. Products
- 12.1.12.3. Company Financials
- 12.1.12.4. SWOT Analysis
- 12.1.13 Kao Corporation
- 12.1.13.1. Company Overview
- 12.1.13.2. Products
- 12.1.13.3. Company Financials
- 12.1.13.4. SWOT Analysis
- 12.1.14 Silverline Chemicals
- 12.1.14.1. Company Overview
- 12.1.14.2. Products
- 12.1.14.3. Company Financials
- 12.1.14.4. SWOT Analysis
- 12.1.1 Hindustan Mint and Agro Products Pvt Ltd
- 12.2. Market Entropy
- 12.2.1 Company's Key Areas Served
- 12.2.2 Recent Developments
- 12.3. Company Market Share Analysis 2025
- 12.3.1 Top 5 Companies Market Share Analysis
- 12.3.2 Top 3 Companies Market Share Analysis
- 12.4. List of Potential Customers
- 13. Research Methodology
List of Figures
- Figure 1: Global Aroma Chemicals Industry Revenue Breakdown (Million, %) by Region 2025 & 2033
- Figure 2: Asia Pacific Aroma Chemicals Industry Revenue (Million), by Type 2025 & 2033
- Figure 3: Asia Pacific Aroma Chemicals Industry Revenue Share (%), by Type 2025 & 2033
- Figure 4: Asia Pacific Aroma Chemicals Industry Revenue (Million), by Application 2025 & 2033
- Figure 5: Asia Pacific Aroma Chemicals Industry Revenue Share (%), by Application 2025 & 2033
- Figure 6: Asia Pacific Aroma Chemicals Industry Revenue (Million), by Country 2025 & 2033
- Figure 7: Asia Pacific Aroma Chemicals Industry Revenue Share (%), by Country 2025 & 2033
- Figure 8: North America Aroma Chemicals Industry Revenue (Million), by Type 2025 & 2033
- Figure 9: North America Aroma Chemicals Industry Revenue Share (%), by Type 2025 & 2033
- Figure 10: North America Aroma Chemicals Industry Revenue (Million), by Application 2025 & 2033
- Figure 11: North America Aroma Chemicals Industry Revenue Share (%), by Application 2025 & 2033
- Figure 12: North America Aroma Chemicals Industry Revenue (Million), by Country 2025 & 2033
- Figure 13: North America Aroma Chemicals Industry Revenue Share (%), by Country 2025 & 2033
- Figure 14: Europe Aroma Chemicals Industry Revenue (Million), by Type 2025 & 2033
- Figure 15: Europe Aroma Chemicals Industry Revenue Share (%), by Type 2025 & 2033
- Figure 16: Europe Aroma Chemicals Industry Revenue (Million), by Application 2025 & 2033
- Figure 17: Europe Aroma Chemicals Industry Revenue Share (%), by Application 2025 & 2033
- Figure 18: Europe Aroma Chemicals Industry Revenue (Million), by Country 2025 & 2033
- Figure 19: Europe Aroma Chemicals Industry Revenue Share (%), by Country 2025 & 2033
- Figure 20: South America Aroma Chemicals Industry Revenue (Million), by Type 2025 & 2033
- Figure 21: South America Aroma Chemicals Industry Revenue Share (%), by Type 2025 & 2033
- Figure 22: South America Aroma Chemicals Industry Revenue (Million), by Application 2025 & 2033
- Figure 23: South America Aroma Chemicals Industry Revenue Share (%), by Application 2025 & 2033
- Figure 24: South America Aroma Chemicals Industry Revenue (Million), by Country 2025 & 2033
- Figure 25: South America Aroma Chemicals Industry Revenue Share (%), by Country 2025 & 2033
- Figure 26: Middle East and Africa Aroma Chemicals Industry Revenue (Million), by Type 2025 & 2033
- Figure 27: Middle East and Africa Aroma Chemicals Industry Revenue Share (%), by Type 2025 & 2033
- Figure 28: Middle East and Africa Aroma Chemicals Industry Revenue (Million), by Application 2025 & 2033
- Figure 29: Middle East and Africa Aroma Chemicals Industry Revenue Share (%), by Application 2025 & 2033
- Figure 30: Middle East and Africa Aroma Chemicals Industry Revenue (Million), by Country 2025 & 2033
- Figure 31: Middle East and Africa Aroma Chemicals Industry Revenue Share (%), by Country 2025 & 2033
List of Tables
- Table 1: Global Aroma Chemicals Industry Revenue Million Forecast, by Type 2020 & 2033
- Table 2: Global Aroma Chemicals Industry Revenue Million Forecast, by Application 2020 & 2033
- Table 3: Global Aroma Chemicals Industry Revenue Million Forecast, by Region 2020 & 2033
- Table 4: Global Aroma Chemicals Industry Revenue Million Forecast, by Type 2020 & 2033
- Table 5: Global Aroma Chemicals Industry Revenue Million Forecast, by Application 2020 & 2033
- Table 6: Global Aroma Chemicals Industry Revenue Million Forecast, by Country 2020 & 2033
- Table 7: China Aroma Chemicals Industry Revenue (Million) Forecast, by Application 2020 & 2033
- Table 8: India Aroma Chemicals Industry Revenue (Million) Forecast, by Application 2020 & 2033
- Table 9: Japan Aroma Chemicals Industry Revenue (Million) Forecast, by Application 2020 & 2033
- Table 10: South Korea Aroma Chemicals Industry Revenue (Million) Forecast, by Application 2020 & 2033
- Table 11: Rest of Asia Pacific Aroma Chemicals Industry Revenue (Million) Forecast, by Application 2020 & 2033
- Table 12: Global Aroma Chemicals Industry Revenue Million Forecast, by Type 2020 & 2033
- Table 13: Global Aroma Chemicals Industry Revenue Million Forecast, by Application 2020 & 2033
- Table 14: Global Aroma Chemicals Industry Revenue Million Forecast, by Country 2020 & 2033
- Table 15: United States Aroma Chemicals Industry Revenue (Million) Forecast, by Application 2020 & 2033
- Table 16: Canada Aroma Chemicals Industry Revenue (Million) Forecast, by Application 2020 & 2033
- Table 17: Mexico Aroma Chemicals Industry Revenue (Million) Forecast, by Application 2020 & 2033
- Table 18: Global Aroma Chemicals Industry Revenue Million Forecast, by Type 2020 & 2033
- Table 19: Global Aroma Chemicals Industry Revenue Million Forecast, by Application 2020 & 2033
- Table 20: Global Aroma Chemicals Industry Revenue Million Forecast, by Country 2020 & 2033
- Table 21: Germany Aroma Chemicals Industry Revenue (Million) Forecast, by Application 2020 & 2033
- Table 22: United Kingdom Aroma Chemicals Industry Revenue (Million) Forecast, by Application 2020 & 2033
- Table 23: Italy Aroma Chemicals Industry Revenue (Million) Forecast, by Application 2020 & 2033
- Table 24: France Aroma Chemicals Industry Revenue (Million) Forecast, by Application 2020 & 2033
- Table 25: Rest of Europe Aroma Chemicals Industry Revenue (Million) Forecast, by Application 2020 & 2033
- Table 26: Global Aroma Chemicals Industry Revenue Million Forecast, by Type 2020 & 2033
- Table 27: Global Aroma Chemicals Industry Revenue Million Forecast, by Application 2020 & 2033
- Table 28: Global Aroma Chemicals Industry Revenue Million Forecast, by Country 2020 & 2033
- Table 29: Brazil Aroma Chemicals Industry Revenue (Million) Forecast, by Application 2020 & 2033
- Table 30: Argentina Aroma Chemicals Industry Revenue (Million) Forecast, by Application 2020 & 2033
- Table 31: Rest of South America Aroma Chemicals Industry Revenue (Million) Forecast, by Application 2020 & 2033
- Table 32: Global Aroma Chemicals Industry Revenue Million Forecast, by Type 2020 & 2033
- Table 33: Global Aroma Chemicals Industry Revenue Million Forecast, by Application 2020 & 2033
- Table 34: Global Aroma Chemicals Industry Revenue Million Forecast, by Country 2020 & 2033
- Table 35: Saudi Arabia Aroma Chemicals Industry Revenue (Million) Forecast, by Application 2020 & 2033
- Table 36: South Africa Aroma Chemicals Industry Revenue (Million) Forecast, by Application 2020 & 2033
- Table 37: Rest of Middle East and Africa Aroma Chemicals Industry Revenue (Million) Forecast, by Application 2020 & 2033
Frequently Asked Questions
1. What is the projected Compound Annual Growth Rate (CAGR) of the Aroma Chemicals Industry?
The projected CAGR is approximately 4.65%.
2. Which companies are prominent players in the Aroma Chemicals Industry?
Key companies in the market include Hindustan Mint and Agro Products Pvt Ltd, Givaudan, Symrise, Kalpsutra Chemicals Pvt Ltd, Solvay, Takasago International Corporation, BASF SE, S H Kelkar And Company Limited, Robertet Group, DSM, Bell Flavors & Fragrances, Treatt Plc*List Not Exhaustive, Kao Corporation, Silverline Chemicals.
3. What are the main segments of the Aroma Chemicals Industry?
The market segments include Type, Application.
4. Can you provide details about the market size?
The market size is estimated to be USD 4.66 Million as of 2022.
5. What are some drivers contributing to market growth?
Blooming Use in Fragrance Industry; Increasing advancements in the personal care products industries; Other Drivers.
6. What are the notable trends driving market growth?
Growing Demand from Fine Fragrances Application.
7. Are there any restraints impacting market growth?
High R&D Cost Coupled with Stringent Government Regulation; Other Restraints.
8. Can you provide examples of recent developments in the market?
Sept 2022: Solvay expanded the range of one of its flagship products, Rhovanil Natural CW, with three new natural flavors: Rhovanil Natural Delica, Alta, and Sublima. With these new products, the group will enable the F&B industry to make a cost-effective transition to natural products and respond to growing consumer expectations for healthier, safer, tastier, and more natural products.
9. What pricing options are available for accessing the report?
Pricing options include single-user, multi-user, and enterprise licenses priced at USD 4750, USD 5250, and USD 8750 respectively.
10. Is the market size provided in terms of value or volume?
The market size is provided in terms of value, measured in Million.
11. Are there any specific market keywords associated with the report?
Yes, the market keyword associated with the report is "Aroma Chemicals Industry," which aids in identifying and referencing the specific market segment covered.
12. How do I determine which pricing option suits my needs best?
The pricing options vary based on user requirements and access needs. Individual users may opt for single-user licenses, while businesses requiring broader access may choose multi-user or enterprise licenses for cost-effective access to the report.
13. Are there any additional resources or data provided in the Aroma Chemicals Industry report?
While the report offers comprehensive insights, it's advisable to review the specific contents or supplementary materials provided to ascertain if additional resources or data are available.
14. How can I stay updated on further developments or reports in the Aroma Chemicals Industry?
To stay informed about further developments, trends, and reports in the Aroma Chemicals Industry, consider subscribing to industry newsletters, following relevant companies and organizations, or regularly checking reputable industry news sources and publications.
Methodology
Step 1 - Identification of Relevant Samples Size from Population Database


Step 2 - Approaches for Defining Global Market Size (Value, Volume* & Price*)

Note*: In applicable scenarios
Step 3 - Data Sources
Primary Research
- Web Analytics
- Survey Reports
- Research Institute
- Latest Research Reports
- Opinion Leaders
Secondary Research
- Annual Reports
- White Paper
- Latest Press Release
- Industry Association
- Paid Database
- Investor Presentations

Step 4 - Data Triangulation
Involves using different sources of information in order to increase the validity of a study
These sources are likely to be stakeholders in a program - participants, other researchers, program staff, other community members, and so on.
Then we put all data in single framework & apply various statistical tools to find out the dynamic on the market.
During the analysis stage, feedback from the stakeholder groups would be compared to determine areas of agreement as well as areas of divergence