

Key Insights
The Asia-Pacific Capital Market Exchange Ecosystem is poised for substantial expansion, driven by escalating financialization, rising disposable incomes, and government initiatives prioritizing financial inclusion. With an estimated CAGR of 5.48%, the market is projected to reach $1120 billion by 2025. This growth trajectory is supported by a growing middle class, increased Foreign Direct Investment (FDI), and the widespread adoption of fintech innovations enhancing market accessibility and efficiency. Key growth drivers include the increasing prevalence of digital trading platforms, the integration of Environmental, Social, and Governance (ESG) principles in investment strategies, and the expanding derivatives market. Despite these positive trends, geopolitical risks, regulatory ambiguities, and potential macroeconomic instability present ongoing challenges. The region's diverse exchange landscape, featuring major players like the Shanghai Stock Exchange and Tokyo Stock Exchange, underscores its inherent complexity and significant potential.
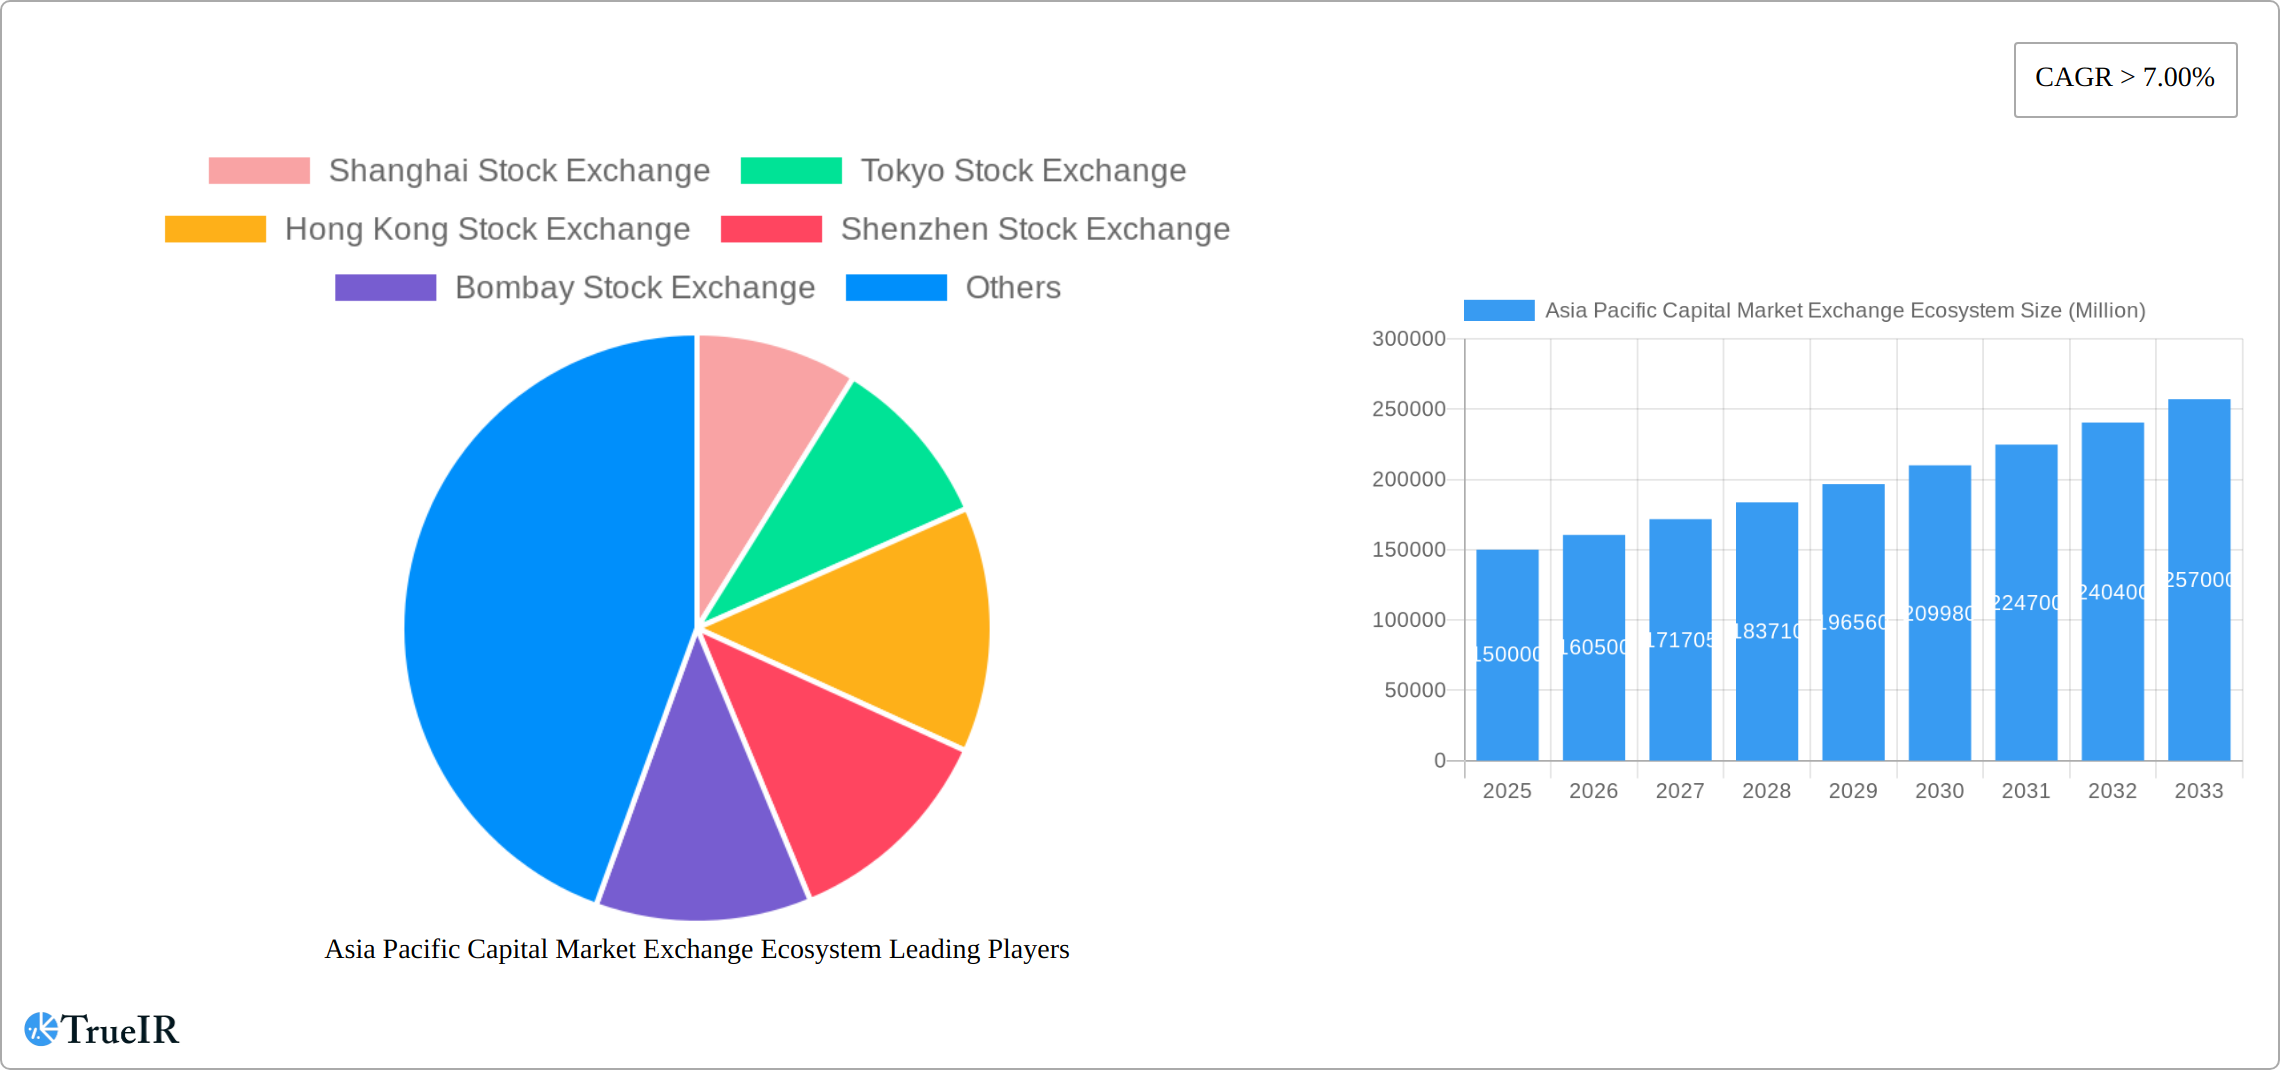
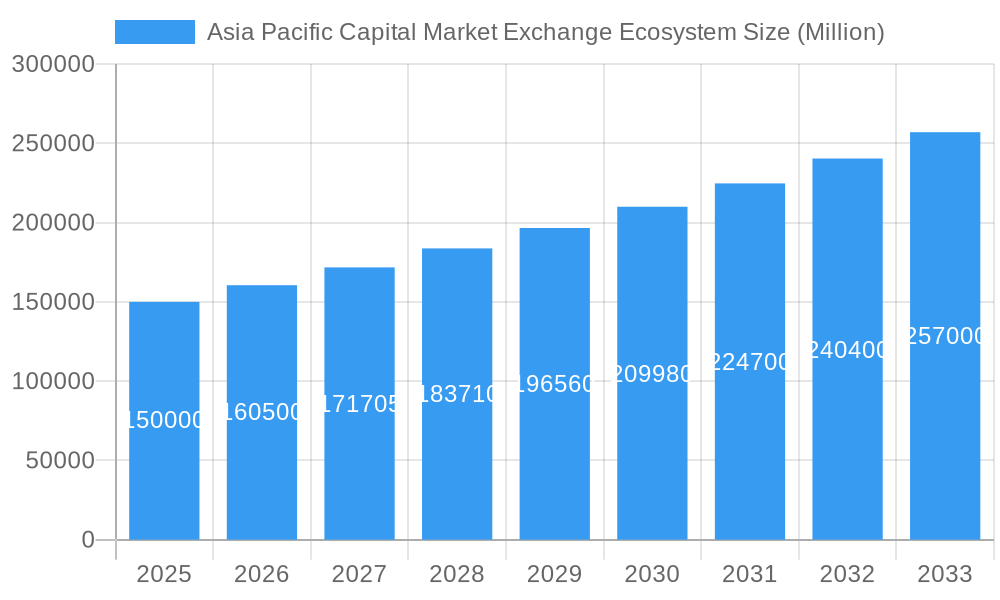
Asia Pacific Capital Market Exchange Ecosystem Market Size (In Million)
Individual market segments, including equity trading, fixed income, and derivatives, each contribute to the overall market value and exhibit distinct growth patterns influenced by sector-specific dynamics. The robust market size in 2025 solidifies the region's status as a pivotal global financial center. While granular regional data is limited, significant contributions are anticipated from established economies such as Japan, China, India, and South Korea, alongside dynamic emerging markets. Favorable regional trade agreements and increased cross-border investment further bolster growth prospects. The Asia-Pacific Capital Market Exchange Ecosystem's future appears promising, marked by continuous innovation and growing global financial significance. Strategic adaptation to inherent risks and evolving regulatory frameworks will be crucial for sustained success.
Asia Pacific Capital Market Exchange Ecosystem Company Market Share
Asia Pacific Capital Market Exchange Ecosystem Market Report: 2019-2033
This comprehensive report provides a deep dive into the dynamic Asia Pacific capital market exchange ecosystem, offering invaluable insights for investors, market participants, and industry stakeholders. With a forecast period spanning 2025-2033 and a base year of 2025, this report leverages historical data from 2019-2024 to project future market trends and growth opportunities across diverse segments. The report features detailed analysis of major exchanges, including the Shanghai Stock Exchange, Tokyo Stock Exchange, Hong Kong Stock Exchange, Shenzhen Stock Exchange, Bombay Stock Exchange, National Stock Exchange of India, Korea Exchange, Taiwan Stock Exchange, Singapore Exchange, and The Stock Exchange of Thailand (list not exhaustive). Expect detailed analysis of market size, CAGR, market penetration, and key drivers influencing this rapidly evolving landscape. This report is crucial for navigating the complexities of this significant market and making informed strategic decisions.
Asia Pacific Capital Market Exchange Ecosystem Market Structure & Competitive Landscape
The Asia Pacific capital market exchange ecosystem presents a multifaceted structure, exhibiting varying levels of market concentration across its diverse national markets. While dominant players like the Shanghai and Tokyo Stock Exchanges command significant shares within their respective countries, other exchanges operate in more fragmented environments. The overall market concentration, as measured by the Herfindahl-Hirschman Index (HHI), is estimated at [Insert updated HHI value for 2025] in 2025, suggesting a [Insert description: e.g., moderately concentrated, highly fragmented, etc.] market. This concentration is dynamically influenced by a complex interplay of regulatory frameworks, prevailing investor sentiment, and the accessibility of cutting-edge trading platforms.
Innovation serves as a critical catalyst, with exchanges continuously integrating advanced technologies such as blockchain and AI to enhance operational efficiency, bolster security, and provide superior trading experiences. Regulatory landscapes vary significantly across the region, resulting in diverse impacts on market access and the overall operational dynamics of trading activities. The competitive landscape is further shaped by the presence of product substitutes, including over-the-counter (OTC) markets and alternative trading systems (ATS), which present ongoing competitive challenges. The end-user base comprises a heterogeneous mix of institutional and retail investors, each with unique needs and investment strategies, further adding complexity to the market dynamics. While mergers and acquisitions (M&A) activity hasn't been exceptionally robust in recent years (estimated at [Insert updated M&A value for 2024] Million USD in 2024), it remains a potent force with the potential to drive significant consolidation and reshape the market structure.
- Market Concentration: HHI estimated at [Insert updated HHI value for 2025] in 2025.
- Innovation Drivers: Blockchain technology, AI-powered trading platforms, high-frequency trading (HFT) capabilities.
- Regulatory Impacts: Vary significantly across countries, influencing market access, trading rules, and operational procedures.
- Product Substitutes: OTC markets, alternative trading venues (ATVs), dark pools.
- End-User Segmentation: Institutional investors (e.g., mutual funds, hedge funds), retail investors, high-net-worth individuals (HNWIs), sophisticated investors.
- M&A Trends: Moderate activity, potential for future consolidation and increased market share for larger players.
Asia Pacific Capital Market Exchange Ecosystem Market Trends & Opportunities
The Asia Pacific capital market exchange ecosystem is experiencing robust and sustained growth, propelled by several key factors. These include the rise in disposable incomes across the region, escalating financial literacy among the population, and supportive government policies designed to foster economic development and market expansion. The market size is estimated at [Insert updated market size value for 2025] Million USD in 2025, with projections indicating a substantial increase to [Insert updated market size value for 2033] Million USD by 2033, representing a compound annual growth rate (CAGR) of [Insert updated CAGR value]%. This remarkable growth trajectory is fueled by several interconnected factors: rapid technological advancements, a shift in consumer preferences toward convenient online and mobile trading platforms, and the increasing adoption of innovative financial products tailored to diverse investor needs. The market penetration rate for online trading platforms continues to rise significantly, with a considerable portion of the retail investor base actively using online brokerage services. The competitive landscape remains highly dynamic, with established exchanges continually adapting their offerings to retain their competitive edge. This evolutionary process involves strategic investments in advanced technologies, the forging of strategic partnerships, and the introduction of novel trading products and services specifically designed to cater to evolving investor needs and preferences.
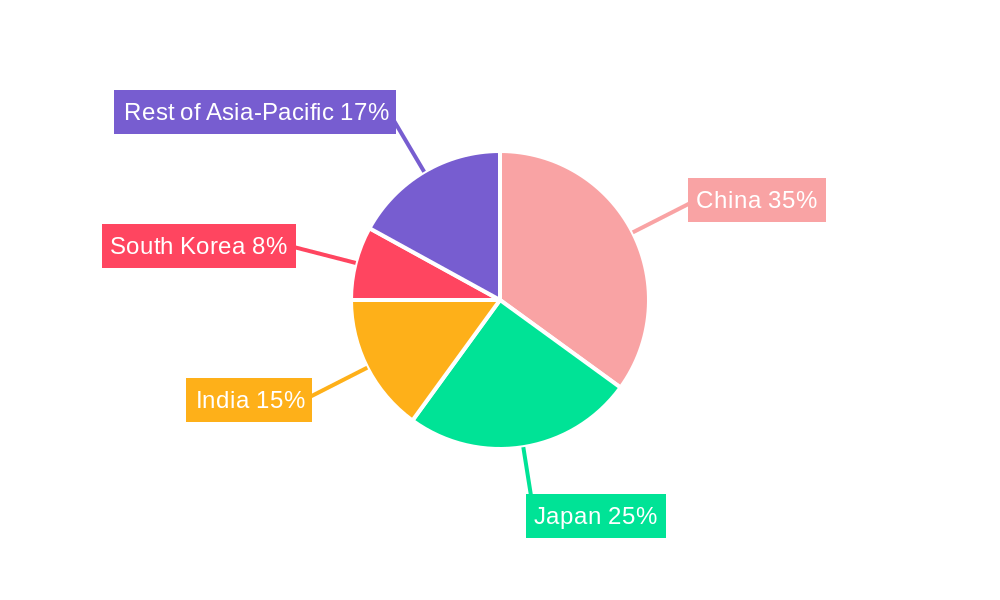
Dominant Markets & Segments in Asia Pacific Capital Market Exchange Ecosystem
The Chinese and Japanese markets remain dominant in the Asia Pacific region due to the size of their economies and the high volume of trading activity on their respective major exchanges. However, other markets such as India, South Korea, and Singapore are showing significant potential for growth.
Key Growth Drivers:
- Robust Economic Growth: Strong economic performance in several key Asian economies.
- Government Support: Favorable regulatory environments and supportive government policies.
- Technological Advancements: Adoption of innovative trading technologies.
- Rising Middle Class: Increased participation of retail investors.
- Infrastructure Development: Improvement in market infrastructure and connectivity.
Market Dominance Analysis:
China and Japan continue to hold substantial market share, driven by their large economies and established exchanges. India's market displays strong growth potential due to its expanding economy and increasing participation from retail investors. Other markets like Singapore and South Korea are also playing significant roles as regional financial hubs, offering attractive trading opportunities and specialized financial services. The long-term outlook suggests continued strong growth across many segments, however, regional variations are expected, influenced by economic development, investor sentiment, and regulatory changes.
Asia Pacific Capital Market Exchange Ecosystem Product Analysis
The Asia Pacific capital market exchange ecosystem provides a diverse array of products and services designed to meet the heterogeneous needs and preferences of a wide range of investors. This comprehensive offering includes equities, derivatives (futures, options), bonds (government and corporate), exchange-traded funds (ETFs), and a variety of other sophisticated financial instruments. Technological advancements have revolutionized the trading landscape, leading to the introduction of sophisticated trading platforms, high-frequency trading (HFT) capabilities, and the widespread adoption of algorithmic trading strategies. Competitive advantages in this dynamic environment are primarily determined by the technological sophistication of the trading platforms employed, the depth and liquidity of the underlying markets, the robustness of the regulatory environment, and the ability to provide efficient and secure trading operations. Exchanges are continuously upgrading their technological infrastructure to enhance trading efficiency, bolster transparency, and improve overall security. This intense competition is a driving force behind innovation and serves to enhance the overall efficiency and competitiveness of the capital markets in the Asia Pacific region.
Key Drivers, Barriers & Challenges in Asia Pacific Capital Market Exchange Ecosystem
Key Drivers:
- Economic Growth: Rising disposable incomes and expanding middle classes across the region fuel increased investment activity.
- Technological Advancements: Automation, algorithmic trading, blockchain technology, and artificial intelligence (AI) enhance efficiency and reduce operational costs.
- Regulatory Reforms: Government initiatives aimed at streamlining regulations, promoting market transparency, and attracting foreign investment.
- Growing Investor Sophistication: Increased financial literacy and demand for diversified investment options.
Key Challenges:
- Regulatory Complexity: Varying regulations across different jurisdictions create challenges for cross-border transactions and market integration.
- Cybersecurity Threats: The increasing reliance on technology increases vulnerability to cyberattacks and data breaches.
- Geopolitical Instability: Regional conflicts and uncertainties can negatively impact investor confidence and market stability.
- Competition: Intense competition among exchanges necessitates continuous adaptation, innovation, and the development of value-added services.
- Market Volatility: Global economic fluctuations and sudden market downturns can impact investor sentiment and trading volumes.
Growth Drivers in the Asia Pacific Capital Market Exchange Ecosystem Market
Several key factors are propelling growth within the Asia-Pacific capital market exchange ecosystem. These include the ongoing expansion of the middle class in several key economies, increasing financial literacy and access to financial services, and supportive government policies promoting market development. Further fueling growth are technological advancements that are enhancing trading efficiency and lowering transaction costs. Finally, a generally positive economic outlook in many parts of the region provides further impetus to investment activity.
Challenges Impacting Asia Pacific Capital Market Exchange Ecosystem Growth
The growth trajectory of the Asia Pacific capital market exchange ecosystem faces several significant headwinds. Regulatory complexities, particularly concerning cross-border transactions, continue to pose substantial challenges to seamless market integration. Furthermore, cybersecurity threats, the potential for market manipulation, and the ever-present risk of fraud represent significant risks that need to be proactively addressed. Geopolitical instability, economic downturns in specific countries, and macroeconomic uncertainty can negatively influence investor sentiment and negatively impact overall market performance. Finally, the highly competitive landscape requires exchanges to continually adapt, innovate, and differentiate their offerings to maintain their market positions and attract investors.
Key Players Shaping the Asia Pacific Capital Market Exchange Ecosystem Market
Significant Asia Pacific Capital Market Exchange Ecosystem Industry Milestones
- July 2022: Eligible companies listed on the Beijing Stock Exchange were allowed to transfer to the Star Market of the Shanghai Stock Exchange, fostering better integration within China's capital market structure.
- February 2022: The China Securities Regulatory Commission (CSRC) approved the merger of Shenzhen Stock Exchange's main board with the SME board, streamlining the exchange's structure and enhancing trading efficiency.
Future Outlook for Asia Pacific Capital Market Exchange Ecosystem Market
The Asia Pacific capital market exchange ecosystem is poised for continued growth, driven by a combination of economic expansion, technological innovation, and supportive regulatory frameworks. Strategic opportunities abound, particularly in emerging markets, as these regions undergo rapid economic development and increasing financial inclusion. The potential for market expansion is considerable, with opportunities for both established players and new entrants to capitalize on the evolving landscape. The increasing adoption of technology will further enhance efficiency and access, broadening participation and driving future growth.
Asia Pacific Capital Market Exchange Ecosystem Segmentation
-
1. Type of Market
- 1.1. Primary Market
- 1.2. Secondary Market
-
2. Financial Product
- 2.1. Debt
- 2.2. Equity
-
3. Investors
- 3.1. Retail Investors
- 3.2. Institutional Investors
Asia Pacific Capital Market Exchange Ecosystem Segmentation By Geography
-
1. Asia Pacific
- 1.1. China
- 1.2. Japan
- 1.3. South Korea
- 1.4. India
- 1.5. Australia
- 1.6. New Zealand
- 1.7. Indonesia
- 1.8. Malaysia
- 1.9. Singapore
- 1.10. Thailand
- 1.11. Vietnam
- 1.12. Philippines
Asia Pacific Capital Market Exchange Ecosystem Regional Market Share
Geographic Coverage of Asia Pacific Capital Market Exchange Ecosystem
Asia Pacific Capital Market Exchange Ecosystem REPORT HIGHLIGHTS
| Aspects | Details |
|---|---|
| Study Period | 2020-2034 |
| Base Year | 2025 |
| Estimated Year | 2026 |
| Forecast Period | 2026-2034 |
| Historical Period | 2020-2025 |
| Growth Rate | CAGR of 5.48% from 2020-2034 |
| Segmentation |
|
Table of Contents
- 1. Introduction
- 1.1. Research Scope
- 1.2. Market Segmentation
- 1.3. Research Objective
- 1.4. Definitions and Assumptions
- 2. Executive Summary
- 2.1. Market Snapshot
- 3. Market Dynamics
- 3.1. Market Drivers
- 3.2. Market Restrains
- 3.3. Market Trends
- 3.4. Market Opportunities
- 4. Market Factor Analysis
- 4.1. Porters Five Forces
- 4.1.1. Bargaining Power of Suppliers
- 4.1.2. Bargaining Power of Buyers
- 4.1.3. Threat of New Entrants
- 4.1.4. Threat of Substitutes
- 4.1.5. Competitive Rivalry
- 4.2. PESTEL analysis
- 4.3. BCG Analysis
- 4.3.1. Stars (High Growth, High Market Share)
- 4.3.2. Cash Cows (Low Growth, High Market Share)
- 4.3.3. Question Mark (High Growth, Low Market Share)
- 4.3.4. Dogs (Low Growth, Low Market Share)
- 4.4. Ansoff Matrix Analysis
- 4.5. Supply Chain Analysis
- 4.6. Regulatory Landscape
- 4.7. Current Market Potential and Opportunity Assessment (TAM–SAM–SOM Framework)
- 4.8. TIR Analyst Note
- 4.1. Porters Five Forces
- 5. Market Analysis, Insights and Forecast 2021-2033
- 5.1. Market Analysis, Insights and Forecast - by Type of Market
- 5.1.1. Primary Market
- 5.1.2. Secondary Market
- 5.2. Market Analysis, Insights and Forecast - by Financial Product
- 5.2.1. Debt
- 5.2.2. Equity
- 5.3. Market Analysis, Insights and Forecast - by Investors
- 5.3.1. Retail Investors
- 5.3.2. Institutional Investors
- 5.4. Market Analysis, Insights and Forecast - by Region
- 5.4.1. Asia Pacific
- 5.1. Market Analysis, Insights and Forecast - by Type of Market
- 6. Asia Pacific Capital Market Exchange Ecosystem Analysis, Insights and Forecast, 2021-2033
- 6.1. Market Analysis, Insights and Forecast - by Type of Market
- 6.1.1. Primary Market
- 6.1.2. Secondary Market
- 6.2. Market Analysis, Insights and Forecast - by Financial Product
- 6.2.1. Debt
- 6.2.2. Equity
- 6.3. Market Analysis, Insights and Forecast - by Investors
- 6.3.1. Retail Investors
- 6.3.2. Institutional Investors
- 6.1. Market Analysis, Insights and Forecast - by Type of Market
- 7. Competitive Analysis
- 7.1. Company Profiles
- 7.1.1 Shanghai Stock Exchange
- 7.1.1.1. Company Overview
- 7.1.1.2. Products
- 7.1.1.3. Company Financials
- 7.1.1.4. SWOT Analysis
- 7.1.2 Tokyo Stock Exchange
- 7.1.2.1. Company Overview
- 7.1.2.2. Products
- 7.1.2.3. Company Financials
- 7.1.2.4. SWOT Analysis
- 7.1.3 Hong Kong Stock Exchange
- 7.1.3.1. Company Overview
- 7.1.3.2. Products
- 7.1.3.3. Company Financials
- 7.1.3.4. SWOT Analysis
- 7.1.4 Shenzhen Stock Exchange
- 7.1.4.1. Company Overview
- 7.1.4.2. Products
- 7.1.4.3. Company Financials
- 7.1.4.4. SWOT Analysis
- 7.1.5 Bombay Stock Exchange
- 7.1.5.1. Company Overview
- 7.1.5.2. Products
- 7.1.5.3. Company Financials
- 7.1.5.4. SWOT Analysis
- 7.1.6 National Stock Exchange
- 7.1.6.1. Company Overview
- 7.1.6.2. Products
- 7.1.6.3. Company Financials
- 7.1.6.4. SWOT Analysis
- 7.1.7 Korea Exchange
- 7.1.7.1. Company Overview
- 7.1.7.2. Products
- 7.1.7.3. Company Financials
- 7.1.7.4. SWOT Analysis
- 7.1.8 Taiwan Stock Exchange
- 7.1.8.1. Company Overview
- 7.1.8.2. Products
- 7.1.8.3. Company Financials
- 7.1.8.4. SWOT Analysis
- 7.1.9 Singapore Exchange
- 7.1.9.1. Company Overview
- 7.1.9.2. Products
- 7.1.9.3. Company Financials
- 7.1.9.4. SWOT Analysis
- 7.1.10 The Stock Exchange of Thailand**List Not Exhaustive
- 7.1.10.1. Company Overview
- 7.1.10.2. Products
- 7.1.10.3. Company Financials
- 7.1.10.4. SWOT Analysis
- 7.1.1 Shanghai Stock Exchange
- 7.2. Market Entropy
- 7.2.1 Company's Key Areas Served
- 7.2.2 Recent Developments
- 7.3. Company Market Share Analysis 2025
- 7.3.1 Top 5 Companies Market Share Analysis
- 7.3.2 Top 3 Companies Market Share Analysis
- 7.4. List of Potential Customers
- 8. Research Methodology
List of Figures
- Figure 1: Asia Pacific Capital Market Exchange Ecosystem Revenue Breakdown (billion, %) by Product 2025 & 2033
- Figure 2: Asia Pacific Capital Market Exchange Ecosystem Share (%) by Company 2025
List of Tables
- Table 1: Asia Pacific Capital Market Exchange Ecosystem Revenue billion Forecast, by Type of Market 2020 & 2033
- Table 2: Asia Pacific Capital Market Exchange Ecosystem Revenue billion Forecast, by Financial Product 2020 & 2033
- Table 3: Asia Pacific Capital Market Exchange Ecosystem Revenue billion Forecast, by Investors 2020 & 2033
- Table 4: Asia Pacific Capital Market Exchange Ecosystem Revenue billion Forecast, by Region 2020 & 2033
- Table 5: Asia Pacific Capital Market Exchange Ecosystem Revenue billion Forecast, by Type of Market 2020 & 2033
- Table 6: Asia Pacific Capital Market Exchange Ecosystem Revenue billion Forecast, by Financial Product 2020 & 2033
- Table 7: Asia Pacific Capital Market Exchange Ecosystem Revenue billion Forecast, by Investors 2020 & 2033
- Table 8: Asia Pacific Capital Market Exchange Ecosystem Revenue billion Forecast, by Country 2020 & 2033
- Table 9: China Asia Pacific Capital Market Exchange Ecosystem Revenue (billion) Forecast, by Application 2020 & 2033
- Table 10: Japan Asia Pacific Capital Market Exchange Ecosystem Revenue (billion) Forecast, by Application 2020 & 2033
- Table 11: South Korea Asia Pacific Capital Market Exchange Ecosystem Revenue (billion) Forecast, by Application 2020 & 2033
- Table 12: India Asia Pacific Capital Market Exchange Ecosystem Revenue (billion) Forecast, by Application 2020 & 2033
- Table 13: Australia Asia Pacific Capital Market Exchange Ecosystem Revenue (billion) Forecast, by Application 2020 & 2033
- Table 14: New Zealand Asia Pacific Capital Market Exchange Ecosystem Revenue (billion) Forecast, by Application 2020 & 2033
- Table 15: Indonesia Asia Pacific Capital Market Exchange Ecosystem Revenue (billion) Forecast, by Application 2020 & 2033
- Table 16: Malaysia Asia Pacific Capital Market Exchange Ecosystem Revenue (billion) Forecast, by Application 2020 & 2033
- Table 17: Singapore Asia Pacific Capital Market Exchange Ecosystem Revenue (billion) Forecast, by Application 2020 & 2033
- Table 18: Thailand Asia Pacific Capital Market Exchange Ecosystem Revenue (billion) Forecast, by Application 2020 & 2033
- Table 19: Vietnam Asia Pacific Capital Market Exchange Ecosystem Revenue (billion) Forecast, by Application 2020 & 2033
- Table 20: Philippines Asia Pacific Capital Market Exchange Ecosystem Revenue (billion) Forecast, by Application 2020 & 2033
Frequently Asked Questions
1. What is the projected Compound Annual Growth Rate (CAGR) of the Asia Pacific Capital Market Exchange Ecosystem?
The projected CAGR is approximately 5.48%.
2. Which companies are prominent players in the Asia Pacific Capital Market Exchange Ecosystem?
Key companies in the market include Shanghai Stock Exchange, Tokyo Stock Exchange, Hong Kong Stock Exchange, Shenzhen Stock Exchange, Bombay Stock Exchange, National Stock Exchange, Korea Exchange, Taiwan Stock Exchange, Singapore Exchange, The Stock Exchange of Thailand**List Not Exhaustive.
3. What are the main segments of the Asia Pacific Capital Market Exchange Ecosystem?
The market segments include Type of Market, Financial Product, Investors.
4. Can you provide details about the market size?
The market size is estimated to be USD 1120 billion as of 2022.
5. What are some drivers contributing to market growth?
N/A
6. What are the notable trends driving market growth?
Increasing Foreign Direct Investment in Various Developing Economies in Asia-Pacific.
7. Are there any restraints impacting market growth?
N/A
8. Can you provide examples of recent developments in the market?
July 2022: The eligible companies listed on Beijing Stock Exchange were allowed to apply for transfer to the Star Market of the Shanghai Stock Exchange. A transfer system is a positive approach for bridge-building efforts between China's multiple layers of the capital market.
9. What pricing options are available for accessing the report?
Pricing options include single-user, multi-user, and enterprise licenses priced at USD 3800, USD 4500, and USD 5800 respectively.
10. Is the market size provided in terms of value or volume?
The market size is provided in terms of value, measured in billion.
11. Are there any specific market keywords associated with the report?
Yes, the market keyword associated with the report is "Asia Pacific Capital Market Exchange Ecosystem," which aids in identifying and referencing the specific market segment covered.
12. How do I determine which pricing option suits my needs best?
The pricing options vary based on user requirements and access needs. Individual users may opt for single-user licenses, while businesses requiring broader access may choose multi-user or enterprise licenses for cost-effective access to the report.
13. Are there any additional resources or data provided in the Asia Pacific Capital Market Exchange Ecosystem report?
While the report offers comprehensive insights, it's advisable to review the specific contents or supplementary materials provided to ascertain if additional resources or data are available.
14. How can I stay updated on further developments or reports in the Asia Pacific Capital Market Exchange Ecosystem?
To stay informed about further developments, trends, and reports in the Asia Pacific Capital Market Exchange Ecosystem, consider subscribing to industry newsletters, following relevant companies and organizations, or regularly checking reputable industry news sources and publications.
Methodology
Step 1 - Identification of Relevant Samples Size from Population Database


Step 2 - Approaches for Defining Global Market Size (Value, Volume* & Price*)

Note*: In applicable scenarios
Step 3 - Data Sources
Primary Research
- Web Analytics
- Survey Reports
- Research Institute
- Latest Research Reports
- Opinion Leaders
Secondary Research
- Annual Reports
- White Paper
- Latest Press Release
- Industry Association
- Paid Database
- Investor Presentations

Step 4 - Data Triangulation
Involves using different sources of information in order to increase the validity of a study
These sources are likely to be stakeholders in a program - participants, other researchers, program staff, other community members, and so on.
Then we put all data in single framework & apply various statistical tools to find out the dynamic on the market.
During the analysis stage, feedback from the stakeholder groups would be compared to determine areas of agreement as well as areas of divergence