

Key Insights
The Asia-Pacific syngas market is poised for significant expansion, projecting a Compound Annual Growth Rate (CAGR) of 6.4% from 2024 to 2033. The current market size stands at 44.39 billion. This growth is underpinned by escalating regional energy requirements, particularly in industrializing economies such as China and India, which are increasingly integrating syngas into power generation and chemical manufacturing processes. A notable trend is the growing adoption of cleaner energy technologies and stringent environmental regulations, which are propelling the use of syngas derived from renewable feedstocks like biomass. This shift towards sustainable production methods significantly reduces environmental impact compared to traditional fossil fuel-based syngas. Continuous technological innovations in syngas production, including enhanced gasification efficiency and integrated carbon capture systems, are improving both economic viability and environmental performance. The market's segmentation across diverse feedstocks, technologies, gasifier types, and applications offers substantial opportunities for specialized industry players.
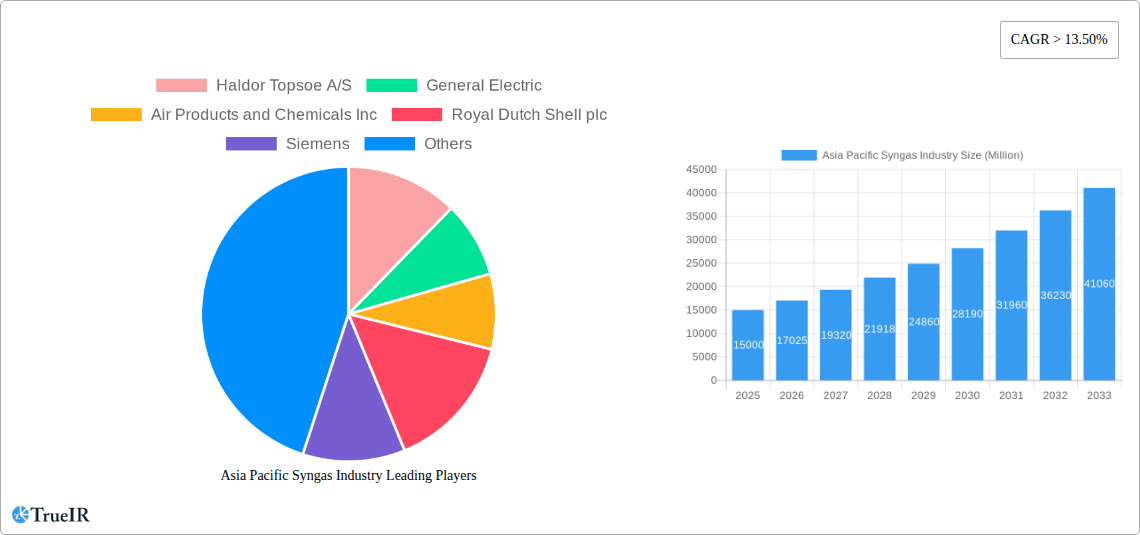
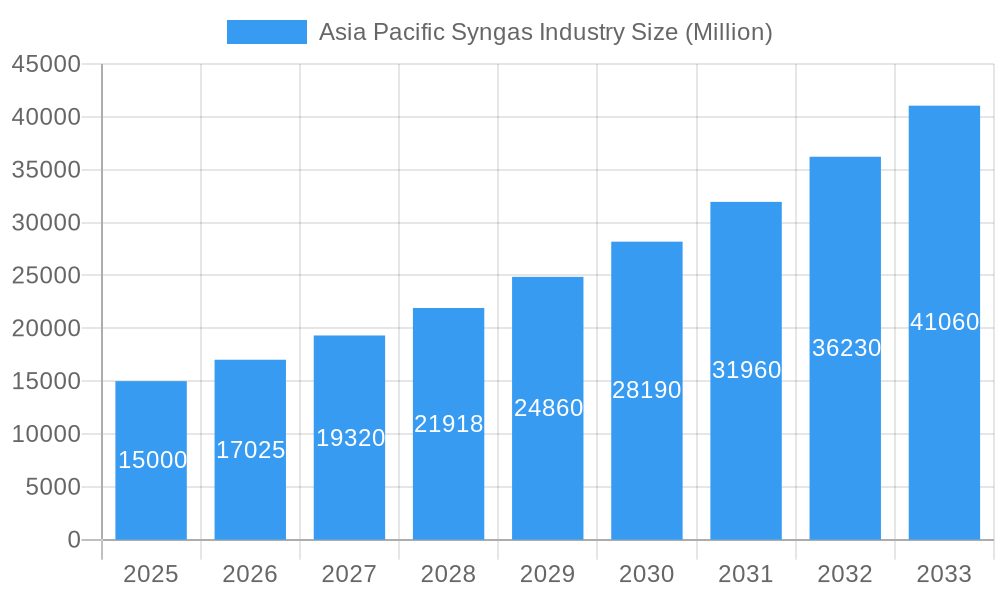
Asia Pacific Syngas Industry Market Size (In Billion)
Key market participants, including Haldor Topsoe, General Electric, and Air Products, are actively investing in research and development, expanding production capacities, and forging strategic partnerships to capitalize on this burgeoning market. The competitive environment features a blend of established global corporations and specialized syngas technology providers. While fossil fuel-based syngas currently dominates, a clear transition towards biomass-based syngas is evident, driven by heightened environmental awareness and supportive government incentives. Challenges such as raw material price volatility and the capital intensity of new infrastructure are present. However, the overarching demand for energy and chemicals, coupled with technological advancements and favorable policies promoting sustainable energy, ensures robust long-term growth prospects for the Asia-Pacific syngas market.
Asia Pacific Syngas Industry Company Market Share
Asia Pacific Syngas Industry Market Report: 2019-2033
This comprehensive report provides an in-depth analysis of the Asia Pacific syngas industry, covering market size, growth trends, competitive landscape, and future outlook from 2019 to 2033. With a focus on key segments, including feedstock, technology, and applications, this report is an essential resource for industry stakeholders, investors, and researchers seeking to understand and capitalize on opportunities within this dynamic market. The report leverages extensive data analysis and incorporates recent industry developments to offer actionable insights and forecasts. The study period covers 2019-2033, with 2025 as the base and estimated year.
Asia Pacific Syngas Industry Market Structure & Competitive Landscape
The Asia Pacific syngas market exhibits a moderately concentrated structure, with several multinational corporations holding significant market share. Key players include Haldor Topsoe A/S, General Electric, Air Products and Chemicals Inc, Royal Dutch Shell plc, Siemens, KBR Inc, BASF SE, Sasol, DuPont, Linde plc, SynGas Technology LLC, Air Liquide, BP plc, and TechnipFMC plc. However, the market also includes numerous smaller, regional players.
- Market Concentration: The Herfindahl-Hirschman Index (HHI) is estimated at xx, indicating a moderately concentrated market.
- Innovation Drivers: Stringent emission regulations and the growing demand for cleaner energy sources are driving innovation in syngas production technologies, particularly those focusing on carbon capture and utilization.
- Regulatory Impacts: Government policies promoting renewable energy and industrial decarbonization significantly influence market growth. Varying regulations across different countries in the region create both opportunities and challenges.
- Product Substitutes: Competition arises from alternative fuel sources such as hydrogen and biogas. However, the versatility of syngas in various applications provides a competitive edge.
- End-User Segmentation: Major end-users include the power generation, chemical, and dimethyl ether (DME) industries. Growth in these sectors directly impacts syngas demand.
- M&A Trends: The past five years have witnessed xx M&A transactions in the Asia Pacific syngas industry, primarily driven by strategic expansion and technology acquisition. The total deal value is estimated at approximately xx Million USD.
Asia Pacific Syngas Industry Market Trends & Opportunities
The Asia Pacific syngas market is projected to experience robust growth during the forecast period (2025-2033), driven by increasing energy demand, industrialization, and government initiatives promoting energy security and diversification. The market size is estimated at xx Million USD in 2025 and is expected to reach xx Million USD by 2033, exhibiting a Compound Annual Growth Rate (CAGR) of xx%. This growth is fueled by several key factors:
*Technological advancements in gasification technologies are improving efficiency and reducing production costs. The increasing adoption of renewable feedstocks like biomass is further boosting market expansion. Consumer preference for cleaner energy sources creates substantial demand for syngas-derived products like green hydrogen and DME. The competitive landscape is characterized by both established players and new entrants, leading to intensified innovation and price competition. This dynamic environment presents significant opportunities for strategic alliances, acquisitions, and the development of novel syngas applications. Market penetration rates for syngas in key applications are expected to increase steadily, particularly in emerging economies experiencing rapid industrialization.
Dominant Markets & Segments in Asia Pacific Syngas Industry
China and India are the dominant markets in the Asia Pacific syngas industry, driven by their large energy demands and significant industrial sectors. Within the segment breakdown:
- Feedstock: Coal remains the dominant feedstock due to its abundance and relatively low cost, although natural gas usage is increasing. Biomass gasification is gaining traction due to sustainability concerns.
- Technology: Steam reforming holds the largest market share due to its maturity and established infrastructure. However, auto-thermal reforming and biomass gasification technologies are gaining traction due to their efficiency and reduced environmental impact.
- Gasifier Type: Entrained flow gasifiers dominate due to their suitability for various feedstocks and high gasification rates.
- Application: Power generation is the largest application, followed by the chemical industry and DME production.
Key Growth Drivers:
- Robust Industrialization: Rapid industrial growth in China and India fuels substantial demand for syngas in power generation and chemical manufacturing.
- Government Support: Favorable government policies promoting energy security and cleaner energy sources, including incentives for syngas production from renewable feedstocks.
- Infrastructure Development: Ongoing investments in energy infrastructure facilitate the integration of syngas production and distribution networks.
Asia Pacific Syngas Industry Product Analysis
Syngas product innovation focuses on improving efficiency, reducing emissions, and expanding applications. Advancements in gasification technologies, such as plasma gasification and supercritical water gasification, offer enhanced performance and environmental benefits. The market fit is strong for syngas in power generation due to its established infrastructure and relatively low cost. Its versatility also makes it attractive for the chemical industry and as a feedstock for producing green fuels like DME and hydrogen.
Key Drivers, Barriers & Challenges in Asia Pacific Syngas Industry
Key Drivers: Growing energy demand, increasing industrialization, government support for cleaner energy, and technological advancements in gasification are primary drivers. The transition towards a low-carbon economy further boosts syngas’ appeal as a versatile feedstock for various clean energy applications.
Challenges and Restraints: High capital costs associated with syngas plant construction, fluctuating feedstock prices, stringent environmental regulations, and competition from alternative fuels pose significant challenges. Supply chain disruptions can also impact production and cost efficiency. The estimated impact of these challenges on the market growth is approximately xx%.
Growth Drivers in the Asia Pacific Syngas Industry Market
The Asia Pacific syngas market is driven by rising energy demand, industrial growth, government policies promoting cleaner energy sources, and technological improvements in gasification processes. These factors combine to create a positive outlook for market expansion.
Challenges Impacting Asia Pacific Syngas Industry Growth
High capital expenditures, fluctuating feedstock prices, environmental regulations, and competition from alternative fuels present significant challenges. Furthermore, supply chain vulnerabilities and geopolitical factors can disrupt production and impact market stability.
Key Players Shaping the Asia Pacific Syngas Industry Market
- Haldor Topsoe A/S
- General Electric
- Air Products and Chemicals Inc
- Royal Dutch Shell plc
- Siemens
- KBR Inc
- BASF SE
- Sasol
- DuPont
- Linde plc
- SynGas Technology LLC
- Air Liquide
- BP plc
- TechnipFMC plc
Significant Asia Pacific Syngas Industry Milestones
- September 2023: BASF SE initiated construction of its syngas plant in Zhanjiang, China, signaling a significant capacity expansion.
- December 2022: Reliance Industries Ltd announced plans to produce blue hydrogen, boosting the syngas market in India.
- December 2022: New Era Cleantech invested USD 2.5 Billion in a coal gasification plant in India, diversifying syngas applications.
Future Outlook for Asia Pacific Syngas Industry Market
The Asia Pacific syngas market is poised for continued growth, driven by increasing energy demand, supportive government policies, and technological innovations. Strategic investments in renewable feedstocks and carbon capture technologies will further enhance the market's sustainability and competitiveness. The market presents lucrative opportunities for companies focused on efficient and environmentally friendly syngas production and utilization.
Asia Pacific Syngas Industry Segmentation
-
1. Feedstock
- 1.1. Coal
- 1.2. Natural Gas
- 1.3. Petroleum
- 1.4. Pet Coke
- 1.5. Biomass
-
2. Technology
- 2.1. Steam Reforming
- 2.2. Partial Oxidation
- 2.3. Auto-thermal Reforming
- 2.4. Combined or Two-step Reforming
- 2.5. Biomass Gasification
-
3. Gasifier Type
- 3.1. Fixed Bed
- 3.2. Entrained Flow
- 3.3. Fluidized Bed
-
4. Application
- 4.1. Power Generation
-
4.2. Chemicals
- 4.2.1. Methanol
- 4.2.2. Ammonia
- 4.2.3. Oxo Chemicals
- 4.2.4. n-Butanol
- 4.2.5. Hydrogen
- 4.2.6. Dimethyl Ether
- 4.3. Liquid Fuels
- 4.4. Gaseous Fuels
-
5. Geography
- 5.1. China
- 5.2. India
- 5.3. Japan
- 5.4. South Korea
- 5.5. Australia & New Zealand
- 5.6. Rest of Asia-Pacific
Asia Pacific Syngas Industry Segmentation By Geography
- 1. China
- 2. India
- 3. Japan
- 4. South Korea
- 5. Australia
- 6. Rest of Asia Pacific
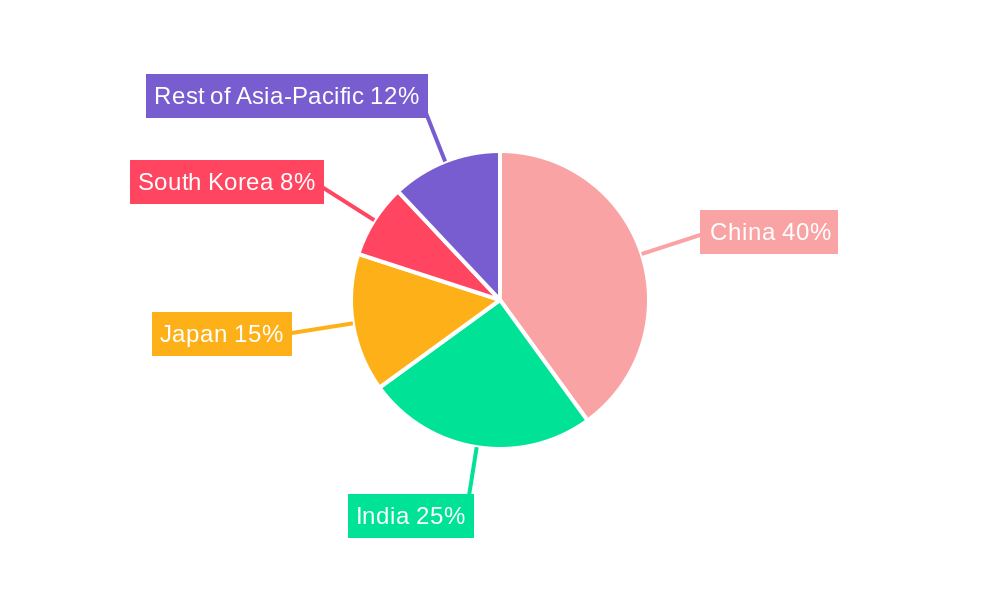
Asia Pacific Syngas Industry Regional Market Share
Geographic Coverage of Asia Pacific Syngas Industry
Asia Pacific Syngas Industry REPORT HIGHLIGHTS
| Aspects | Details |
|---|---|
| Study Period | 2020-2034 |
| Base Year | 2025 |
| Estimated Year | 2026 |
| Forecast Period | 2026-2034 |
| Historical Period | 2020-2025 |
| Growth Rate | CAGR of 6.4% from 2020-2034 |
| Segmentation |
|
Table of Contents
- 1. Introduction
- 1.1. Research Scope
- 1.2. Market Segmentation
- 1.3. Research Objective
- 1.4. Definitions and Assumptions
- 2. Executive Summary
- 2.1. Market Snapshot
- 3. Market Dynamics
- 3.1. Market Drivers
- 3.2. Market Restrains
- 3.3. Market Trends
- 3.4. Market Opportunities
- 4. Market Factor Analysis
- 4.1. Porters Five Forces
- 4.1.1. Bargaining Power of Suppliers
- 4.1.2. Bargaining Power of Buyers
- 4.1.3. Threat of New Entrants
- 4.1.4. Threat of Substitutes
- 4.1.5. Competitive Rivalry
- 4.2. PESTEL analysis
- 4.3. BCG Analysis
- 4.3.1. Stars (High Growth, High Market Share)
- 4.3.2. Cash Cows (Low Growth, High Market Share)
- 4.3.3. Question Mark (High Growth, Low Market Share)
- 4.3.4. Dogs (Low Growth, Low Market Share)
- 4.4. Ansoff Matrix Analysis
- 4.5. Supply Chain Analysis
- 4.6. Regulatory Landscape
- 4.7. Current Market Potential and Opportunity Assessment (TAM–SAM–SOM Framework)
- 4.8. TIR Analyst Note
- 4.1. Porters Five Forces
- 5. Market Analysis, Insights and Forecast 2021-2033
- 5.1. Market Analysis, Insights and Forecast - by Feedstock
- 5.1.1. Coal
- 5.1.2. Natural Gas
- 5.1.3. Petroleum
- 5.1.4. Pet Coke
- 5.1.5. Biomass
- 5.2. Market Analysis, Insights and Forecast - by Technology
- 5.2.1. Steam Reforming
- 5.2.2. Partial Oxidation
- 5.2.3. Auto-thermal Reforming
- 5.2.4. Combined or Two-step Reforming
- 5.2.5. Biomass Gasification
- 5.3. Market Analysis, Insights and Forecast - by Gasifier Type
- 5.3.1. Fixed Bed
- 5.3.2. Entrained Flow
- 5.3.3. Fluidized Bed
- 5.4. Market Analysis, Insights and Forecast - by Application
- 5.4.1. Power Generation
- 5.4.2. Chemicals
- 5.4.2.1. Methanol
- 5.4.2.2. Ammonia
- 5.4.2.3. Oxo Chemicals
- 5.4.2.4. n-Butanol
- 5.4.2.5. Hydrogen
- 5.4.2.6. Dimethyl Ether
- 5.4.3. Liquid Fuels
- 5.4.4. Gaseous Fuels
- 5.5. Market Analysis, Insights and Forecast - by Geography
- 5.5.1. China
- 5.5.2. India
- 5.5.3. Japan
- 5.5.4. South Korea
- 5.5.5. Australia & New Zealand
- 5.5.6. Rest of Asia-Pacific
- 5.6. Market Analysis, Insights and Forecast - by Region
- 5.6.1. China
- 5.6.2. India
- 5.6.3. Japan
- 5.6.4. South Korea
- 5.6.5. Australia
- 5.6.6. Rest of Asia Pacific
- 5.1. Market Analysis, Insights and Forecast - by Feedstock
- 6. Asia Pacific Syngas Industry Analysis, Insights and Forecast, 2021-2033
- 6.1. Market Analysis, Insights and Forecast - by Feedstock
- 6.1.1. Coal
- 6.1.2. Natural Gas
- 6.1.3. Petroleum
- 6.1.4. Pet Coke
- 6.1.5. Biomass
- 6.2. Market Analysis, Insights and Forecast - by Technology
- 6.2.1. Steam Reforming
- 6.2.2. Partial Oxidation
- 6.2.3. Auto-thermal Reforming
- 6.2.4. Combined or Two-step Reforming
- 6.2.5. Biomass Gasification
- 6.3. Market Analysis, Insights and Forecast - by Gasifier Type
- 6.3.1. Fixed Bed
- 6.3.2. Entrained Flow
- 6.3.3. Fluidized Bed
- 6.4. Market Analysis, Insights and Forecast - by Application
- 6.4.1. Power Generation
- 6.4.2. Chemicals
- 6.4.2.1. Methanol
- 6.4.2.2. Ammonia
- 6.4.2.3. Oxo Chemicals
- 6.4.2.4. n-Butanol
- 6.4.2.5. Hydrogen
- 6.4.2.6. Dimethyl Ether
- 6.4.3. Liquid Fuels
- 6.4.4. Gaseous Fuels
- 6.5. Market Analysis, Insights and Forecast - by Geography
- 6.5.1. China
- 6.5.2. India
- 6.5.3. Japan
- 6.5.4. South Korea
- 6.5.5. Australia & New Zealand
- 6.5.6. Rest of Asia-Pacific
- 6.1. Market Analysis, Insights and Forecast - by Feedstock
- 7. China Asia Pacific Syngas Industry Analysis, Insights and Forecast, 2020-2032
- 7.1. Market Analysis, Insights and Forecast - by Feedstock
- 7.1.1. Coal
- 7.1.2. Natural Gas
- 7.1.3. Petroleum
- 7.1.4. Pet Coke
- 7.1.5. Biomass
- 7.2. Market Analysis, Insights and Forecast - by Technology
- 7.2.1. Steam Reforming
- 7.2.2. Partial Oxidation
- 7.2.3. Auto-thermal Reforming
- 7.2.4. Combined or Two-step Reforming
- 7.2.5. Biomass Gasification
- 7.3. Market Analysis, Insights and Forecast - by Gasifier Type
- 7.3.1. Fixed Bed
- 7.3.2. Entrained Flow
- 7.3.3. Fluidized Bed
- 7.4. Market Analysis, Insights and Forecast - by Application
- 7.4.1. Power Generation
- 7.4.2. Chemicals
- 7.4.2.1. Methanol
- 7.4.2.2. Ammonia
- 7.4.2.3. Oxo Chemicals
- 7.4.2.4. n-Butanol
- 7.4.2.5. Hydrogen
- 7.4.2.6. Dimethyl Ether
- 7.4.3. Liquid Fuels
- 7.4.4. Gaseous Fuels
- 7.5. Market Analysis, Insights and Forecast - by Geography
- 7.5.1. China
- 7.5.2. India
- 7.5.3. Japan
- 7.5.4. South Korea
- 7.5.5. Australia & New Zealand
- 7.5.6. Rest of Asia-Pacific
- 7.1. Market Analysis, Insights and Forecast - by Feedstock
- 8. India Asia Pacific Syngas Industry Analysis, Insights and Forecast, 2020-2032
- 8.1. Market Analysis, Insights and Forecast - by Feedstock
- 8.1.1. Coal
- 8.1.2. Natural Gas
- 8.1.3. Petroleum
- 8.1.4. Pet Coke
- 8.1.5. Biomass
- 8.2. Market Analysis, Insights and Forecast - by Technology
- 8.2.1. Steam Reforming
- 8.2.2. Partial Oxidation
- 8.2.3. Auto-thermal Reforming
- 8.2.4. Combined or Two-step Reforming
- 8.2.5. Biomass Gasification
- 8.3. Market Analysis, Insights and Forecast - by Gasifier Type
- 8.3.1. Fixed Bed
- 8.3.2. Entrained Flow
- 8.3.3. Fluidized Bed
- 8.4. Market Analysis, Insights and Forecast - by Application
- 8.4.1. Power Generation
- 8.4.2. Chemicals
- 8.4.2.1. Methanol
- 8.4.2.2. Ammonia
- 8.4.2.3. Oxo Chemicals
- 8.4.2.4. n-Butanol
- 8.4.2.5. Hydrogen
- 8.4.2.6. Dimethyl Ether
- 8.4.3. Liquid Fuels
- 8.4.4. Gaseous Fuels
- 8.5. Market Analysis, Insights and Forecast - by Geography
- 8.5.1. China
- 8.5.2. India
- 8.5.3. Japan
- 8.5.4. South Korea
- 8.5.5. Australia & New Zealand
- 8.5.6. Rest of Asia-Pacific
- 8.1. Market Analysis, Insights and Forecast - by Feedstock
- 9. Japan Asia Pacific Syngas Industry Analysis, Insights and Forecast, 2020-2032
- 9.1. Market Analysis, Insights and Forecast - by Feedstock
- 9.1.1. Coal
- 9.1.2. Natural Gas
- 9.1.3. Petroleum
- 9.1.4. Pet Coke
- 9.1.5. Biomass
- 9.2. Market Analysis, Insights and Forecast - by Technology
- 9.2.1. Steam Reforming
- 9.2.2. Partial Oxidation
- 9.2.3. Auto-thermal Reforming
- 9.2.4. Combined or Two-step Reforming
- 9.2.5. Biomass Gasification
- 9.3. Market Analysis, Insights and Forecast - by Gasifier Type
- 9.3.1. Fixed Bed
- 9.3.2. Entrained Flow
- 9.3.3. Fluidized Bed
- 9.4. Market Analysis, Insights and Forecast - by Application
- 9.4.1. Power Generation
- 9.4.2. Chemicals
- 9.4.2.1. Methanol
- 9.4.2.2. Ammonia
- 9.4.2.3. Oxo Chemicals
- 9.4.2.4. n-Butanol
- 9.4.2.5. Hydrogen
- 9.4.2.6. Dimethyl Ether
- 9.4.3. Liquid Fuels
- 9.4.4. Gaseous Fuels
- 9.5. Market Analysis, Insights and Forecast - by Geography
- 9.5.1. China
- 9.5.2. India
- 9.5.3. Japan
- 9.5.4. South Korea
- 9.5.5. Australia & New Zealand
- 9.5.6. Rest of Asia-Pacific
- 9.1. Market Analysis, Insights and Forecast - by Feedstock
- 10. South Korea Asia Pacific Syngas Industry Analysis, Insights and Forecast, 2020-2032
- 10.1. Market Analysis, Insights and Forecast - by Feedstock
- 10.1.1. Coal
- 10.1.2. Natural Gas
- 10.1.3. Petroleum
- 10.1.4. Pet Coke
- 10.1.5. Biomass
- 10.2. Market Analysis, Insights and Forecast - by Technology
- 10.2.1. Steam Reforming
- 10.2.2. Partial Oxidation
- 10.2.3. Auto-thermal Reforming
- 10.2.4. Combined or Two-step Reforming
- 10.2.5. Biomass Gasification
- 10.3. Market Analysis, Insights and Forecast - by Gasifier Type
- 10.3.1. Fixed Bed
- 10.3.2. Entrained Flow
- 10.3.3. Fluidized Bed
- 10.4. Market Analysis, Insights and Forecast - by Application
- 10.4.1. Power Generation
- 10.4.2. Chemicals
- 10.4.2.1. Methanol
- 10.4.2.2. Ammonia
- 10.4.2.3. Oxo Chemicals
- 10.4.2.4. n-Butanol
- 10.4.2.5. Hydrogen
- 10.4.2.6. Dimethyl Ether
- 10.4.3. Liquid Fuels
- 10.4.4. Gaseous Fuels
- 10.5. Market Analysis, Insights and Forecast - by Geography
- 10.5.1. China
- 10.5.2. India
- 10.5.3. Japan
- 10.5.4. South Korea
- 10.5.5. Australia & New Zealand
- 10.5.6. Rest of Asia-Pacific
- 10.1. Market Analysis, Insights and Forecast - by Feedstock
- 11. Australia Asia Pacific Syngas Industry Analysis, Insights and Forecast, 2020-2032
- 11.1. Market Analysis, Insights and Forecast - by Feedstock
- 11.1.1. Coal
- 11.1.2. Natural Gas
- 11.1.3. Petroleum
- 11.1.4. Pet Coke
- 11.1.5. Biomass
- 11.2. Market Analysis, Insights and Forecast - by Technology
- 11.2.1. Steam Reforming
- 11.2.2. Partial Oxidation
- 11.2.3. Auto-thermal Reforming
- 11.2.4. Combined or Two-step Reforming
- 11.2.5. Biomass Gasification
- 11.3. Market Analysis, Insights and Forecast - by Gasifier Type
- 11.3.1. Fixed Bed
- 11.3.2. Entrained Flow
- 11.3.3. Fluidized Bed
- 11.4. Market Analysis, Insights and Forecast - by Application
- 11.4.1. Power Generation
- 11.4.2. Chemicals
- 11.4.2.1. Methanol
- 11.4.2.2. Ammonia
- 11.4.2.3. Oxo Chemicals
- 11.4.2.4. n-Butanol
- 11.4.2.5. Hydrogen
- 11.4.2.6. Dimethyl Ether
- 11.4.3. Liquid Fuels
- 11.4.4. Gaseous Fuels
- 11.5. Market Analysis, Insights and Forecast - by Geography
- 11.5.1. China
- 11.5.2. India
- 11.5.3. Japan
- 11.5.4. South Korea
- 11.5.5. Australia & New Zealand
- 11.5.6. Rest of Asia-Pacific
- 11.1. Market Analysis, Insights and Forecast - by Feedstock
- 12. Rest of Asia Pacific Asia Pacific Syngas Industry Analysis, Insights and Forecast, 2020-2032
- 12.1. Market Analysis, Insights and Forecast - by Feedstock
- 12.1.1. Coal
- 12.1.2. Natural Gas
- 12.1.3. Petroleum
- 12.1.4. Pet Coke
- 12.1.5. Biomass
- 12.2. Market Analysis, Insights and Forecast - by Technology
- 12.2.1. Steam Reforming
- 12.2.2. Partial Oxidation
- 12.2.3. Auto-thermal Reforming
- 12.2.4. Combined or Two-step Reforming
- 12.2.5. Biomass Gasification
- 12.3. Market Analysis, Insights and Forecast - by Gasifier Type
- 12.3.1. Fixed Bed
- 12.3.2. Entrained Flow
- 12.3.3. Fluidized Bed
- 12.4. Market Analysis, Insights and Forecast - by Application
- 12.4.1. Power Generation
- 12.4.2. Chemicals
- 12.4.2.1. Methanol
- 12.4.2.2. Ammonia
- 12.4.2.3. Oxo Chemicals
- 12.4.2.4. n-Butanol
- 12.4.2.5. Hydrogen
- 12.4.2.6. Dimethyl Ether
- 12.4.3. Liquid Fuels
- 12.4.4. Gaseous Fuels
- 12.5. Market Analysis, Insights and Forecast - by Geography
- 12.5.1. China
- 12.5.2. India
- 12.5.3. Japan
- 12.5.4. South Korea
- 12.5.5. Australia & New Zealand
- 12.5.6. Rest of Asia-Pacific
- 12.1. Market Analysis, Insights and Forecast - by Feedstock
- 13. Competitive Analysis
- 13.1. Company Profiles
- 13.1.1 Haldor Topsoe A/S
- 13.1.1.1. Company Overview
- 13.1.1.2. Products
- 13.1.1.3. Company Financials
- 13.1.1.4. SWOT Analysis
- 13.1.2 General Electric
- 13.1.2.1. Company Overview
- 13.1.2.2. Products
- 13.1.2.3. Company Financials
- 13.1.2.4. SWOT Analysis
- 13.1.3 Air Products and Chemicals Inc
- 13.1.3.1. Company Overview
- 13.1.3.2. Products
- 13.1.3.3. Company Financials
- 13.1.3.4. SWOT Analysis
- 13.1.4 Royal Dutch Shell plc
- 13.1.4.1. Company Overview
- 13.1.4.2. Products
- 13.1.4.3. Company Financials
- 13.1.4.4. SWOT Analysis
- 13.1.5 Siemens
- 13.1.5.1. Company Overview
- 13.1.5.2. Products
- 13.1.5.3. Company Financials
- 13.1.5.4. SWOT Analysis
- 13.1.6 KBR Inc
- 13.1.6.1. Company Overview
- 13.1.6.2. Products
- 13.1.6.3. Company Financials
- 13.1.6.4. SWOT Analysis
- 13.1.7 BASF SE
- 13.1.7.1. Company Overview
- 13.1.7.2. Products
- 13.1.7.3. Company Financials
- 13.1.7.4. SWOT Analysis
- 13.1.8 Sasol
- 13.1.8.1. Company Overview
- 13.1.8.2. Products
- 13.1.8.3. Company Financials
- 13.1.8.4. SWOT Analysis
- 13.1.9 DuPont
- 13.1.9.1. Company Overview
- 13.1.9.2. Products
- 13.1.9.3. Company Financials
- 13.1.9.4. SWOT Analysis
- 13.1.10 Linde plc
- 13.1.10.1. Company Overview
- 13.1.10.2. Products
- 13.1.10.3. Company Financials
- 13.1.10.4. SWOT Analysis
- 13.1.11 SynGas Technology LLC
- 13.1.11.1. Company Overview
- 13.1.11.2. Products
- 13.1.11.3. Company Financials
- 13.1.11.4. SWOT Analysis
- 13.1.12 Air Liquide
- 13.1.12.1. Company Overview
- 13.1.12.2. Products
- 13.1.12.3. Company Financials
- 13.1.12.4. SWOT Analysis
- 13.1.13 BP p l c
- 13.1.13.1. Company Overview
- 13.1.13.2. Products
- 13.1.13.3. Company Financials
- 13.1.13.4. SWOT Analysis
- 13.1.14 TechnipFMC plc*List Not Exhaustive
- 13.1.14.1. Company Overview
- 13.1.14.2. Products
- 13.1.14.3. Company Financials
- 13.1.14.4. SWOT Analysis
- 13.1.1 Haldor Topsoe A/S
- 13.2. Market Entropy
- 13.2.1 Company's Key Areas Served
- 13.2.2 Recent Developments
- 13.3. Company Market Share Analysis 2025
- 13.3.1 Top 5 Companies Market Share Analysis
- 13.3.2 Top 3 Companies Market Share Analysis
- 13.4. List of Potential Customers
- 14. Research Methodology
List of Figures
- Figure 1: Asia Pacific Syngas Industry Revenue Breakdown (billion, %) by Product 2025 & 2033
- Figure 2: Asia Pacific Syngas Industry Share (%) by Company 2025
List of Tables
- Table 1: Asia Pacific Syngas Industry Revenue billion Forecast, by Feedstock 2020 & 2033
- Table 2: Asia Pacific Syngas Industry Volume Million Forecast, by Feedstock 2020 & 2033
- Table 3: Asia Pacific Syngas Industry Revenue billion Forecast, by Technology 2020 & 2033
- Table 4: Asia Pacific Syngas Industry Volume Million Forecast, by Technology 2020 & 2033
- Table 5: Asia Pacific Syngas Industry Revenue billion Forecast, by Gasifier Type 2020 & 2033
- Table 6: Asia Pacific Syngas Industry Volume Million Forecast, by Gasifier Type 2020 & 2033
- Table 7: Asia Pacific Syngas Industry Revenue billion Forecast, by Application 2020 & 2033
- Table 8: Asia Pacific Syngas Industry Volume Million Forecast, by Application 2020 & 2033
- Table 9: Asia Pacific Syngas Industry Revenue billion Forecast, by Geography 2020 & 2033
- Table 10: Asia Pacific Syngas Industry Volume Million Forecast, by Geography 2020 & 2033
- Table 11: Asia Pacific Syngas Industry Revenue billion Forecast, by Region 2020 & 2033
- Table 12: Asia Pacific Syngas Industry Volume Million Forecast, by Region 2020 & 2033
- Table 13: Asia Pacific Syngas Industry Revenue billion Forecast, by Feedstock 2020 & 2033
- Table 14: Asia Pacific Syngas Industry Volume Million Forecast, by Feedstock 2020 & 2033
- Table 15: Asia Pacific Syngas Industry Revenue billion Forecast, by Technology 2020 & 2033
- Table 16: Asia Pacific Syngas Industry Volume Million Forecast, by Technology 2020 & 2033
- Table 17: Asia Pacific Syngas Industry Revenue billion Forecast, by Gasifier Type 2020 & 2033
- Table 18: Asia Pacific Syngas Industry Volume Million Forecast, by Gasifier Type 2020 & 2033
- Table 19: Asia Pacific Syngas Industry Revenue billion Forecast, by Application 2020 & 2033
- Table 20: Asia Pacific Syngas Industry Volume Million Forecast, by Application 2020 & 2033
- Table 21: Asia Pacific Syngas Industry Revenue billion Forecast, by Geography 2020 & 2033
- Table 22: Asia Pacific Syngas Industry Volume Million Forecast, by Geography 2020 & 2033
- Table 23: Asia Pacific Syngas Industry Revenue billion Forecast, by Country 2020 & 2033
- Table 24: Asia Pacific Syngas Industry Volume Million Forecast, by Country 2020 & 2033
- Table 25: Asia Pacific Syngas Industry Revenue billion Forecast, by Feedstock 2020 & 2033
- Table 26: Asia Pacific Syngas Industry Volume Million Forecast, by Feedstock 2020 & 2033
- Table 27: Asia Pacific Syngas Industry Revenue billion Forecast, by Technology 2020 & 2033
- Table 28: Asia Pacific Syngas Industry Volume Million Forecast, by Technology 2020 & 2033
- Table 29: Asia Pacific Syngas Industry Revenue billion Forecast, by Gasifier Type 2020 & 2033
- Table 30: Asia Pacific Syngas Industry Volume Million Forecast, by Gasifier Type 2020 & 2033
- Table 31: Asia Pacific Syngas Industry Revenue billion Forecast, by Application 2020 & 2033
- Table 32: Asia Pacific Syngas Industry Volume Million Forecast, by Application 2020 & 2033
- Table 33: Asia Pacific Syngas Industry Revenue billion Forecast, by Geography 2020 & 2033
- Table 34: Asia Pacific Syngas Industry Volume Million Forecast, by Geography 2020 & 2033
- Table 35: Asia Pacific Syngas Industry Revenue billion Forecast, by Country 2020 & 2033
- Table 36: Asia Pacific Syngas Industry Volume Million Forecast, by Country 2020 & 2033
- Table 37: Asia Pacific Syngas Industry Revenue billion Forecast, by Feedstock 2020 & 2033
- Table 38: Asia Pacific Syngas Industry Volume Million Forecast, by Feedstock 2020 & 2033
- Table 39: Asia Pacific Syngas Industry Revenue billion Forecast, by Technology 2020 & 2033
- Table 40: Asia Pacific Syngas Industry Volume Million Forecast, by Technology 2020 & 2033
- Table 41: Asia Pacific Syngas Industry Revenue billion Forecast, by Gasifier Type 2020 & 2033
- Table 42: Asia Pacific Syngas Industry Volume Million Forecast, by Gasifier Type 2020 & 2033
- Table 43: Asia Pacific Syngas Industry Revenue billion Forecast, by Application 2020 & 2033
- Table 44: Asia Pacific Syngas Industry Volume Million Forecast, by Application 2020 & 2033
- Table 45: Asia Pacific Syngas Industry Revenue billion Forecast, by Geography 2020 & 2033
- Table 46: Asia Pacific Syngas Industry Volume Million Forecast, by Geography 2020 & 2033
- Table 47: Asia Pacific Syngas Industry Revenue billion Forecast, by Country 2020 & 2033
- Table 48: Asia Pacific Syngas Industry Volume Million Forecast, by Country 2020 & 2033
- Table 49: Asia Pacific Syngas Industry Revenue billion Forecast, by Feedstock 2020 & 2033
- Table 50: Asia Pacific Syngas Industry Volume Million Forecast, by Feedstock 2020 & 2033
- Table 51: Asia Pacific Syngas Industry Revenue billion Forecast, by Technology 2020 & 2033
- Table 52: Asia Pacific Syngas Industry Volume Million Forecast, by Technology 2020 & 2033
- Table 53: Asia Pacific Syngas Industry Revenue billion Forecast, by Gasifier Type 2020 & 2033
- Table 54: Asia Pacific Syngas Industry Volume Million Forecast, by Gasifier Type 2020 & 2033
- Table 55: Asia Pacific Syngas Industry Revenue billion Forecast, by Application 2020 & 2033
- Table 56: Asia Pacific Syngas Industry Volume Million Forecast, by Application 2020 & 2033
- Table 57: Asia Pacific Syngas Industry Revenue billion Forecast, by Geography 2020 & 2033
- Table 58: Asia Pacific Syngas Industry Volume Million Forecast, by Geography 2020 & 2033
- Table 59: Asia Pacific Syngas Industry Revenue billion Forecast, by Country 2020 & 2033
- Table 60: Asia Pacific Syngas Industry Volume Million Forecast, by Country 2020 & 2033
- Table 61: Asia Pacific Syngas Industry Revenue billion Forecast, by Feedstock 2020 & 2033
- Table 62: Asia Pacific Syngas Industry Volume Million Forecast, by Feedstock 2020 & 2033
- Table 63: Asia Pacific Syngas Industry Revenue billion Forecast, by Technology 2020 & 2033
- Table 64: Asia Pacific Syngas Industry Volume Million Forecast, by Technology 2020 & 2033
- Table 65: Asia Pacific Syngas Industry Revenue billion Forecast, by Gasifier Type 2020 & 2033
- Table 66: Asia Pacific Syngas Industry Volume Million Forecast, by Gasifier Type 2020 & 2033
- Table 67: Asia Pacific Syngas Industry Revenue billion Forecast, by Application 2020 & 2033
- Table 68: Asia Pacific Syngas Industry Volume Million Forecast, by Application 2020 & 2033
- Table 69: Asia Pacific Syngas Industry Revenue billion Forecast, by Geography 2020 & 2033
- Table 70: Asia Pacific Syngas Industry Volume Million Forecast, by Geography 2020 & 2033
- Table 71: Asia Pacific Syngas Industry Revenue billion Forecast, by Country 2020 & 2033
- Table 72: Asia Pacific Syngas Industry Volume Million Forecast, by Country 2020 & 2033
- Table 73: Asia Pacific Syngas Industry Revenue billion Forecast, by Feedstock 2020 & 2033
- Table 74: Asia Pacific Syngas Industry Volume Million Forecast, by Feedstock 2020 & 2033
- Table 75: Asia Pacific Syngas Industry Revenue billion Forecast, by Technology 2020 & 2033
- Table 76: Asia Pacific Syngas Industry Volume Million Forecast, by Technology 2020 & 2033
- Table 77: Asia Pacific Syngas Industry Revenue billion Forecast, by Gasifier Type 2020 & 2033
- Table 78: Asia Pacific Syngas Industry Volume Million Forecast, by Gasifier Type 2020 & 2033
- Table 79: Asia Pacific Syngas Industry Revenue billion Forecast, by Application 2020 & 2033
- Table 80: Asia Pacific Syngas Industry Volume Million Forecast, by Application 2020 & 2033
- Table 81: Asia Pacific Syngas Industry Revenue billion Forecast, by Geography 2020 & 2033
- Table 82: Asia Pacific Syngas Industry Volume Million Forecast, by Geography 2020 & 2033
- Table 83: Asia Pacific Syngas Industry Revenue billion Forecast, by Country 2020 & 2033
- Table 84: Asia Pacific Syngas Industry Volume Million Forecast, by Country 2020 & 2033
Frequently Asked Questions
1. What is the projected Compound Annual Growth Rate (CAGR) of the Asia Pacific Syngas Industry?
The projected CAGR is approximately 6.4%.
2. Which companies are prominent players in the Asia Pacific Syngas Industry?
Key companies in the market include Haldor Topsoe A/S, General Electric, Air Products and Chemicals Inc, Royal Dutch Shell plc, Siemens, KBR Inc, BASF SE, Sasol, DuPont, Linde plc, SynGas Technology LLC, Air Liquide, BP p l c, TechnipFMC plc*List Not Exhaustive.
3. What are the main segments of the Asia Pacific Syngas Industry?
The market segments include Feedstock, Technology, Gasifier Type, Application, Geography.
4. Can you provide details about the market size?
The market size is estimated to be USD 44.39 billion as of 2022.
5. What are some drivers contributing to market growth?
Feedstock Flexibility for Syngas Production; Growing Demand in the Electricity and Chemical Industries; Increasing Hydrogen Demand for Fertilizers.
6. What are the notable trends driving market growth?
Ammonia Application Segment to Dominate the Market.
7. Are there any restraints impacting market growth?
High Capital Investment and Funding; Other Restraints.
8. Can you provide examples of recent developments in the market?
September 2023: BASF SE initiated the construction of its syngas plant at the Verbund site in Zhanjiang, China. Anticipated to become operational in 2025, this facility marks a strategic move by BASF SE to bolster its syngas production capacity in China.
9. What pricing options are available for accessing the report?
Pricing options include single-user, multi-user, and enterprise licenses priced at USD 4750, USD 5250, and USD 8750 respectively.
10. Is the market size provided in terms of value or volume?
The market size is provided in terms of value, measured in billion and volume, measured in Million.
11. Are there any specific market keywords associated with the report?
Yes, the market keyword associated with the report is "Asia Pacific Syngas Industry," which aids in identifying and referencing the specific market segment covered.
12. How do I determine which pricing option suits my needs best?
The pricing options vary based on user requirements and access needs. Individual users may opt for single-user licenses, while businesses requiring broader access may choose multi-user or enterprise licenses for cost-effective access to the report.
13. Are there any additional resources or data provided in the Asia Pacific Syngas Industry report?
While the report offers comprehensive insights, it's advisable to review the specific contents or supplementary materials provided to ascertain if additional resources or data are available.
14. How can I stay updated on further developments or reports in the Asia Pacific Syngas Industry?
To stay informed about further developments, trends, and reports in the Asia Pacific Syngas Industry, consider subscribing to industry newsletters, following relevant companies and organizations, or regularly checking reputable industry news sources and publications.
Methodology
Step 1 - Identification of Relevant Samples Size from Population Database


Step 2 - Approaches for Defining Global Market Size (Value, Volume* & Price*)

Note*: In applicable scenarios
Step 3 - Data Sources
Primary Research
- Web Analytics
- Survey Reports
- Research Institute
- Latest Research Reports
- Opinion Leaders
Secondary Research
- Annual Reports
- White Paper
- Latest Press Release
- Industry Association
- Paid Database
- Investor Presentations

Step 4 - Data Triangulation
Involves using different sources of information in order to increase the validity of a study
These sources are likely to be stakeholders in a program - participants, other researchers, program staff, other community members, and so on.
Then we put all data in single framework & apply various statistical tools to find out the dynamic on the market.
During the analysis stage, feedback from the stakeholder groups would be compared to determine areas of agreement as well as areas of divergence