

Key Insights
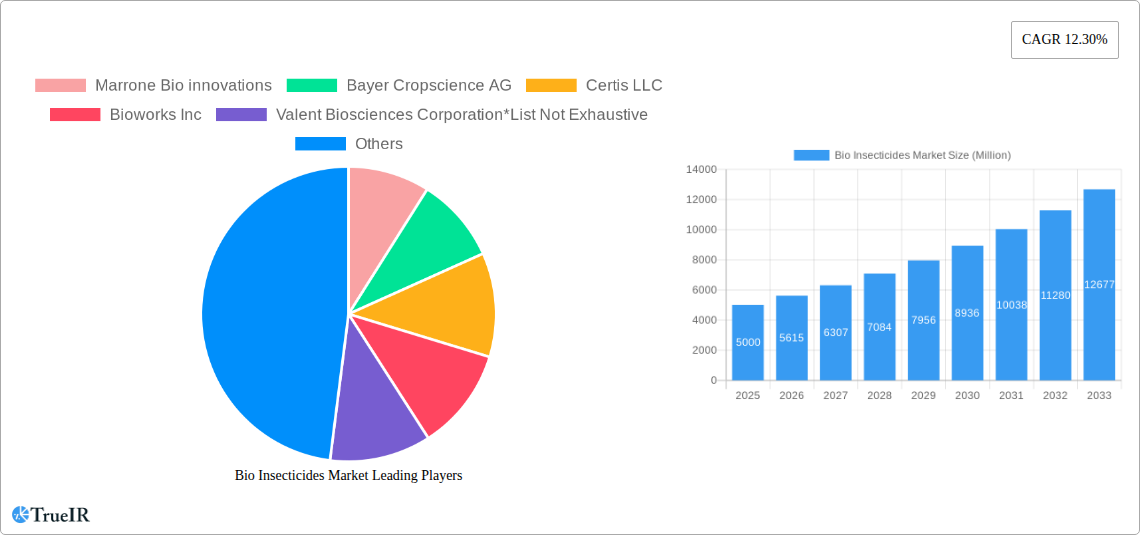
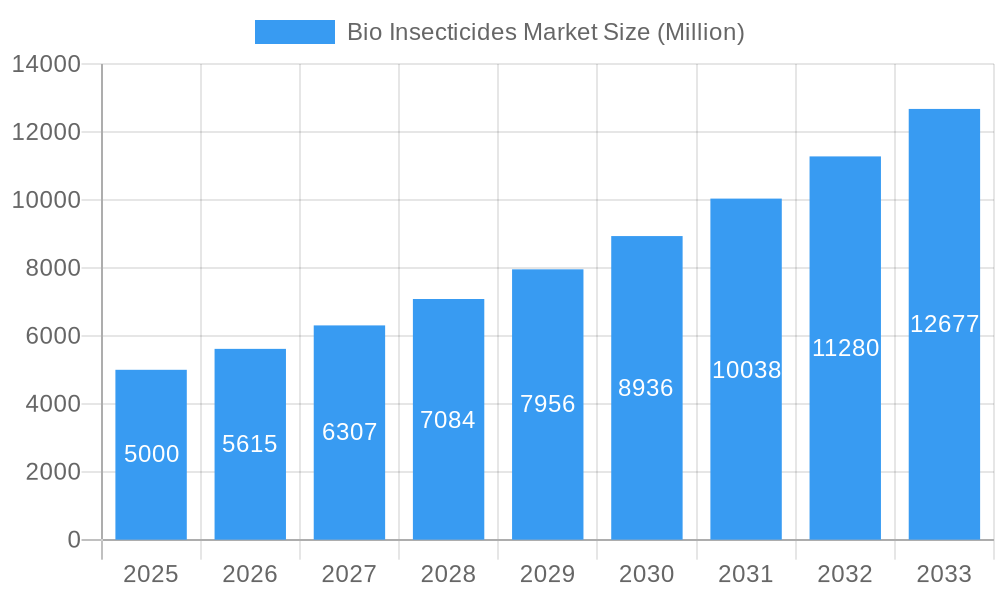
The global bio insecticides market is experiencing robust growth, projected to reach a substantial size by 2033, driven by a 12.30% CAGR from 2025 to 2033. This expansion is fueled by several key factors. The increasing consumer demand for organically produced food and the growing awareness of the harmful effects of synthetic pesticides are significantly boosting the adoption of bio insecticides across various agricultural applications. Stricter government regulations on chemical pesticide usage in many regions are further accelerating this shift towards eco-friendly pest control solutions. The market's segmentation reflects diverse application areas, with grains & cereals, pulses & oilseeds, and fruits & vegetables representing major segments. This diversity presents significant opportunities for market players. Leading companies like Marrone Bio Innovations, Bayer Cropscience AG, and others are actively investing in research and development to enhance the efficacy and range of bio insecticides, leading to innovative product launches and market expansion. Geographic growth is widespread, with North America, Europe, and Asia Pacific emerging as key regions driving market expansion. The market is further strengthened by continuous innovation in biopesticide formulations and delivery systems.
Bio Insecticides Market Market Size (In Billion)
However, challenges remain. The higher cost of bio insecticides compared to their synthetic counterparts can limit widespread adoption, particularly among smallholder farmers. Furthermore, the efficacy of bio insecticides can be affected by environmental factors and the development of pest resistance, necessitating ongoing research and development efforts. Despite these challenges, the long-term growth outlook for the bio insecticides market remains positive, spurred by increasing consumer preference for sustainable agriculture and the regulatory landscape supporting environmentally friendly pest management solutions. The market’s future hinges on overcoming cost barriers, expanding product efficacy, and addressing pest resistance to ensure wider accessibility and sustained market growth.
Bio Insecticides Market Company Market Share
Bio Insecticides Market Report: 2019-2033 Forecast
This comprehensive report provides an in-depth analysis of the Bio Insecticides Market, offering invaluable insights for stakeholders across the agricultural and chemical sectors. The study covers the period 2019-2033, with a focus on the estimated year 2025 and a forecast period of 2025-2033. Leveraging extensive research and data analysis, this report illuminates key trends, growth drivers, challenges, and opportunities within this rapidly evolving market.
Bio Insecticides Market Market Structure & Competitive Landscape
The Bio Insecticides Market exhibits a moderately concentrated structure, with a few major players holding significant market share. However, the market is also characterized by a substantial number of smaller, specialized companies, contributing to a dynamic competitive landscape. The market concentration ratio (CR4) in 2025 is estimated at xx%, indicating a moderate level of consolidation. Innovation is a key driver, with companies investing heavily in R&D to develop novel bio-insecticides with enhanced efficacy and sustainability. Regulatory changes impacting pesticide approvals and usage significantly influence market dynamics. Bio-pesticides are often perceived as safer alternatives to synthetic insecticides, creating a growing demand. The presence of substitute products, such as conventional chemical insecticides, presents ongoing competition. M&A activity within the sector is notably increasing, with xx acquisitions recorded between 2019 and 2024, driven by strategic expansion and access to new technologies. End-user segmentation is primarily driven by application areas, including grains & cereals, pulses & oilseeds, commercial crops, fruits & vegetables, and other applications. This segmentation analysis reveals significant differences in growth rates and market size across various segments.
- Market Concentration: CR4 (2025): xx%
- Innovation Drivers: R&D investment in novel bio-insecticides.
- Regulatory Impacts: Stringent regulations governing pesticide approvals.
- Product Substitutes: Conventional chemical insecticides.
- End-User Segmentation: Grains & Cereals, Pulses & Oilseeds, Commercial Crops, Fruits & Vegetables, Other Applications.
- M&A Trends: xx acquisitions between 2019 and 2024.
Bio Insecticides Market Market Trends & Opportunities
The Bio Insecticides Market is experiencing robust growth, with a projected CAGR of xx% during the forecast period (2025-2033). This expansion is driven by several factors, including rising consumer demand for organically produced food, increasing awareness of the environmental impact of synthetic pesticides, and stringent regulations limiting the use of conventional chemical insecticides. Technological advancements, such as the development of bio-pesticides with improved efficacy and targeted delivery systems, are further fueling market growth. A shift towards sustainable agricultural practices is propelling market penetration among environmentally conscious farmers. Competitive dynamics are characterized by both innovation and consolidation, with major players investing in R&D and engaging in mergers and acquisitions to enhance their market position. Market penetration rates for bio-insecticides are increasing steadily, reaching xx% in 2025 within the major target markets.
Dominant Markets & Segments in Bio Insecticides Market
The North American region currently dominates the Bio Insecticides Market, driven by favorable regulatory landscapes and high consumer demand for organic produce. Within the application segments, fruits and vegetables represent the largest market share due to higher value crops and consumer preference for organically grown produce. Other significant regional markets include Europe and Asia-Pacific, with increasing growth rates in emerging economies.
- Key Growth Drivers for Fruits & Vegetables Segment:
- High consumer demand for organic produce.
- Stringent regulations on chemical pesticide usage.
- Increased adoption of integrated pest management strategies.
- Key Growth Drivers for North American Region:
- Favorable regulatory environment.
- High consumer awareness and demand for sustainable agriculture.
- Robust agricultural infrastructure.
Bio Insecticides Market Product Analysis
Bio-insecticides encompass a diverse range of products, including bacterial, fungal, and viral agents, as well as botanical extracts and pheromones. Product innovations focus on enhancing efficacy, improving shelf life, and developing targeted delivery systems. Competitive advantages often stem from unique formulations, superior efficacy, and eco-friendly attributes. Technological advancements are driving the development of bio-pesticides with improved performance characteristics, such as enhanced bioactivity, extended residual effects, and better resistance management. The market is witnessing the adoption of cutting-edge technologies to enhance the efficacy and applicability of bio-insecticides.
Key Drivers, Barriers & Challenges in Bio Insecticides Market
Key Drivers: Growing consumer preference for organic and sustainably produced food, stringent regulations limiting synthetic pesticide use, increasing environmental awareness, and technological advancements leading to more effective bio-insecticides are key drivers. The rising demand for higher crop yields coupled with the increasing prevalence of pest resistance against conventional insecticides is also stimulating the market.
Key Barriers & Challenges: High production costs compared to synthetic pesticides, relatively lower efficacy in some cases, inconsistent efficacy depending on environmental conditions, and a lack of awareness among farmers about the benefits of bio-insecticides are significant challenges. Regulatory complexities and limitations also hinder market penetration. Supply chain inefficiencies and a lack of standardized quality control measures contribute to the challenges faced by the Bio Insecticides Market. The estimated negative impact of these challenges on market growth is xx% in 2025.
Growth Drivers in the Bio Insecticides Market Market
The Bio Insecticides Market's growth is fueled by increasing consumer demand for organically produced food, strict government regulations restricting synthetic pesticide use, rising environmental awareness, and continuous technological advancements leading to more effective bio-insecticides.
Challenges Impacting Bio Insecticides Market Growth
Challenges include the high production costs compared to chemical alternatives, sometimes lower efficacy, inconsistent performance based on environmental conditions, and limited farmer awareness. Regulatory hurdles and supply chain limitations also contribute.
Key Players Shaping the Bio Insecticides Market Market
Significant Bio Insecticides Market Industry Milestones
- 2020: Launch of a new bio-pesticide with enhanced efficacy by Bayer Cropscience AG.
- 2021: Acquisition of a smaller bio-pesticide company by Marrone Bio Innovations.
- 2022: Introduction of new regulatory guidelines for bio-pesticides in the EU.
- 2023: Several large-scale field trials demonstrating the effectiveness of a new bio-insecticide.
- 2024: Significant investment in bio-pesticide R&D announced by BASF SE.
Future Outlook for Bio Insecticides Market Market
The Bio Insecticides Market is poised for continued growth, driven by the increasing adoption of sustainable agricultural practices and the growing demand for organically produced food. Strategic partnerships, collaborations, and technological advancements will further shape market dynamics. Opportunities exist for companies that can develop innovative bio-insecticides with enhanced efficacy, cost-effectiveness, and environmentally friendly attributes. The market anticipates substantial growth potential, especially in developing countries with growing agricultural sectors.
Bio Insecticides Market Segmentation
- 1. Production Analysis
- 2. Consumption Analysis
- 3. Import Market Analysis (Value & Volume)
- 4. Export Market Analysis (Value & Volume)
- 5. Price Trend Analysis
Bio Insecticides Market Segmentation By Geography
-
1. North America
- 1.1. United States
- 1.2. Canada
- 1.3. Mexico
-
2. South America
- 2.1. Brazil
- 2.2. Argentina
- 2.3. Rest of South America
-
3. Europe
- 3.1. United Kingdom
- 3.2. Germany
- 3.3. France
- 3.4. Italy
- 3.5. Spain
- 3.6. Russia
- 3.7. Benelux
- 3.8. Nordics
- 3.9. Rest of Europe
-
4. Middle East & Africa
- 4.1. Turkey
- 4.2. Israel
- 4.3. GCC
- 4.4. North Africa
- 4.5. South Africa
- 4.6. Rest of Middle East & Africa
-
5. Asia Pacific
- 5.1. China
- 5.2. India
- 5.3. Japan
- 5.4. South Korea
- 5.5. ASEAN
- 5.6. Oceania
- 5.7. Rest of Asia Pacific
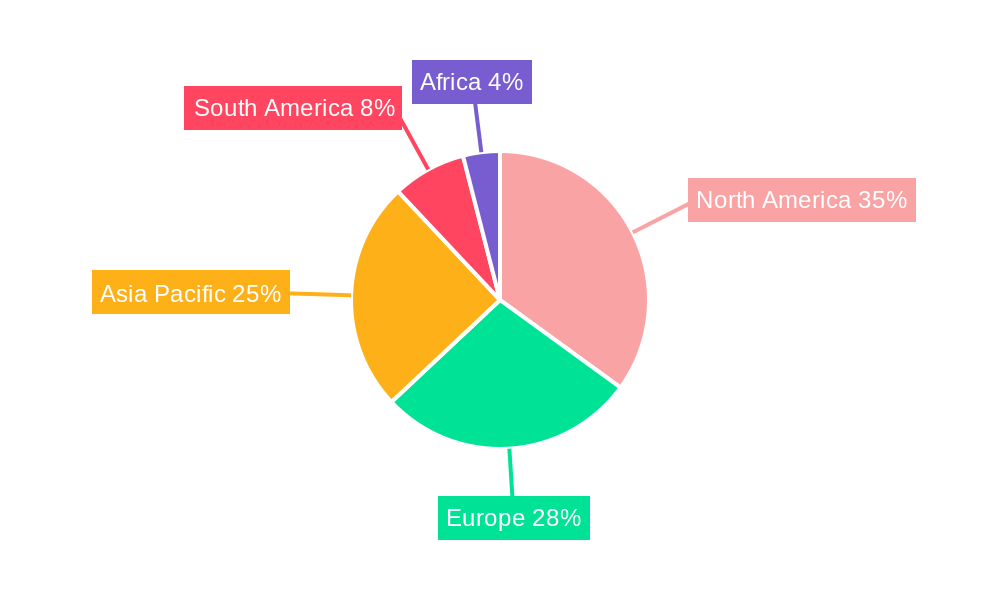
Bio Insecticides Market Regional Market Share
Geographic Coverage of Bio Insecticides Market
Bio Insecticides Market REPORT HIGHLIGHTS
| Aspects | Details |
|---|---|
| Study Period | 2020-2034 |
| Base Year | 2025 |
| Estimated Year | 2026 |
| Forecast Period | 2026-2034 |
| Historical Period | 2020-2025 |
| Growth Rate | CAGR of 12.30% from 2020-2034 |
| Segmentation |
|
Table of Contents
- 1. Introduction
- 1.1. Research Scope
- 1.2. Market Segmentation
- 1.3. Research Methodology
- 1.4. Definitions and Assumptions
- 2. Executive Summary
- 2.1. Introduction
- 3. Market Dynamics
- 3.1. Introduction
- 3.2. Market Drivers
- 3.2.1. Demand For Landscaping Maintenance; Adoption of Green Spaces and Green Roofs
- 3.3. Market Restrains
- 3.3.1. Shortage of Labor In Landscaping; High Maintenance Cost of Lawn Mowers
- 3.4. Market Trends
- 3.4.1. Fruits and Vegetables Occupy the Largest Share By Application
- 4. Market Factor Analysis
- 4.1. Porters Five Forces
- 4.2. Supply/Value Chain
- 4.3. PESTEL analysis
- 4.4. Market Entropy
- 4.5. Patent/Trademark Analysis
- 5. Global Bio Insecticides Market Analysis, Insights and Forecast, 2020-2032
- 5.1. Market Analysis, Insights and Forecast - by Production Analysis
- 5.2. Market Analysis, Insights and Forecast - by Consumption Analysis
- 5.3. Market Analysis, Insights and Forecast - by Import Market Analysis (Value & Volume)
- 5.4. Market Analysis, Insights and Forecast - by Export Market Analysis (Value & Volume)
- 5.5. Market Analysis, Insights and Forecast - by Price Trend Analysis
- 5.6. Market Analysis, Insights and Forecast - by Region
- 5.6.1. North America
- 5.6.2. South America
- 5.6.3. Europe
- 5.6.4. Middle East & Africa
- 5.6.5. Asia Pacific
- 5.1. Market Analysis, Insights and Forecast - by Production Analysis
- 6. North America Bio Insecticides Market Analysis, Insights and Forecast, 2020-2032
- 6.1. Market Analysis, Insights and Forecast - by Production Analysis
- 6.2. Market Analysis, Insights and Forecast - by Consumption Analysis
- 6.3. Market Analysis, Insights and Forecast - by Import Market Analysis (Value & Volume)
- 6.4. Market Analysis, Insights and Forecast - by Export Market Analysis (Value & Volume)
- 6.5. Market Analysis, Insights and Forecast - by Price Trend Analysis
- 6.1. Market Analysis, Insights and Forecast - by Production Analysis
- 7. South America Bio Insecticides Market Analysis, Insights and Forecast, 2020-2032
- 7.1. Market Analysis, Insights and Forecast - by Production Analysis
- 7.2. Market Analysis, Insights and Forecast - by Consumption Analysis
- 7.3. Market Analysis, Insights and Forecast - by Import Market Analysis (Value & Volume)
- 7.4. Market Analysis, Insights and Forecast - by Export Market Analysis (Value & Volume)
- 7.5. Market Analysis, Insights and Forecast - by Price Trend Analysis
- 7.1. Market Analysis, Insights and Forecast - by Production Analysis
- 8. Europe Bio Insecticides Market Analysis, Insights and Forecast, 2020-2032
- 8.1. Market Analysis, Insights and Forecast - by Production Analysis
- 8.2. Market Analysis, Insights and Forecast - by Consumption Analysis
- 8.3. Market Analysis, Insights and Forecast - by Import Market Analysis (Value & Volume)
- 8.4. Market Analysis, Insights and Forecast - by Export Market Analysis (Value & Volume)
- 8.5. Market Analysis, Insights and Forecast - by Price Trend Analysis
- 8.1. Market Analysis, Insights and Forecast - by Production Analysis
- 9. Middle East & Africa Bio Insecticides Market Analysis, Insights and Forecast, 2020-2032
- 9.1. Market Analysis, Insights and Forecast - by Production Analysis
- 9.2. Market Analysis, Insights and Forecast - by Consumption Analysis
- 9.3. Market Analysis, Insights and Forecast - by Import Market Analysis (Value & Volume)
- 9.4. Market Analysis, Insights and Forecast - by Export Market Analysis (Value & Volume)
- 9.5. Market Analysis, Insights and Forecast - by Price Trend Analysis
- 9.1. Market Analysis, Insights and Forecast - by Production Analysis
- 10. Asia Pacific Bio Insecticides Market Analysis, Insights and Forecast, 2020-2032
- 10.1. Market Analysis, Insights and Forecast - by Production Analysis
- 10.2. Market Analysis, Insights and Forecast - by Consumption Analysis
- 10.3. Market Analysis, Insights and Forecast - by Import Market Analysis (Value & Volume)
- 10.4. Market Analysis, Insights and Forecast - by Export Market Analysis (Value & Volume)
- 10.5. Market Analysis, Insights and Forecast - by Price Trend Analysis
- 10.1. Market Analysis, Insights and Forecast - by Production Analysis
- 11. Competitive Analysis
- 11.1. Global Market Share Analysis 2025
- 11.2. Company Profiles
- 11.2.1 Marrone Bio innovations
- 11.2.1.1. Overview
- 11.2.1.2. Products
- 11.2.1.3. SWOT Analysis
- 11.2.1.4. Recent Developments
- 11.2.1.5. Financials (Based on Availability)
- 11.2.2 Bayer Cropscience AG
- 11.2.2.1. Overview
- 11.2.2.2. Products
- 11.2.2.3. SWOT Analysis
- 11.2.2.4. Recent Developments
- 11.2.2.5. Financials (Based on Availability)
- 11.2.3 Certis LLC
- 11.2.3.1. Overview
- 11.2.3.2. Products
- 11.2.3.3. SWOT Analysis
- 11.2.3.4. Recent Developments
- 11.2.3.5. Financials (Based on Availability)
- 11.2.4 Bioworks Inc
- 11.2.4.1. Overview
- 11.2.4.2. Products
- 11.2.4.3. SWOT Analysis
- 11.2.4.4. Recent Developments
- 11.2.4.5. Financials (Based on Availability)
- 11.2.5 Valent Biosciences Corporation*List Not Exhaustive
- 11.2.5.1. Overview
- 11.2.5.2. Products
- 11.2.5.3. SWOT Analysis
- 11.2.5.4. Recent Developments
- 11.2.5.5. Financials (Based on Availability)
- 11.2.6 Isagro Spa
- 11.2.6.1. Overview
- 11.2.6.2. Products
- 11.2.6.3. SWOT Analysis
- 11.2.6.4. Recent Developments
- 11.2.6.5. Financials (Based on Availability)
- 11.2.7 Corteva Agriscience
- 11.2.7.1. Overview
- 11.2.7.2. Products
- 11.2.7.3. SWOT Analysis
- 11.2.7.4. Recent Developments
- 11.2.7.5. Financials (Based on Availability)
- 11.2.8 Novozymes AS
- 11.2.8.1. Overview
- 11.2.8.2. Products
- 11.2.8.3. SWOT Analysis
- 11.2.8.4. Recent Developments
- 11.2.8.5. Financials (Based on Availability)
- 11.2.9 Koppert Biological Systems
- 11.2.9.1. Overview
- 11.2.9.2. Products
- 11.2.9.3. SWOT Analysis
- 11.2.9.4. Recent Developments
- 11.2.9.5. Financials (Based on Availability)
- 11.2.10 BASF SE
- 11.2.10.1. Overview
- 11.2.10.2. Products
- 11.2.10.3. SWOT Analysis
- 11.2.10.4. Recent Developments
- 11.2.10.5. Financials (Based on Availability)
- 11.2.1 Marrone Bio innovations
List of Figures
- Figure 1: Global Bio Insecticides Market Revenue Breakdown (Million, %) by Region 2025 & 2033
- Figure 2: North America Bio Insecticides Market Revenue (Million), by Production Analysis 2025 & 2033
- Figure 3: North America Bio Insecticides Market Revenue Share (%), by Production Analysis 2025 & 2033
- Figure 4: North America Bio Insecticides Market Revenue (Million), by Consumption Analysis 2025 & 2033
- Figure 5: North America Bio Insecticides Market Revenue Share (%), by Consumption Analysis 2025 & 2033
- Figure 6: North America Bio Insecticides Market Revenue (Million), by Import Market Analysis (Value & Volume) 2025 & 2033
- Figure 7: North America Bio Insecticides Market Revenue Share (%), by Import Market Analysis (Value & Volume) 2025 & 2033
- Figure 8: North America Bio Insecticides Market Revenue (Million), by Export Market Analysis (Value & Volume) 2025 & 2033
- Figure 9: North America Bio Insecticides Market Revenue Share (%), by Export Market Analysis (Value & Volume) 2025 & 2033
- Figure 10: North America Bio Insecticides Market Revenue (Million), by Price Trend Analysis 2025 & 2033
- Figure 11: North America Bio Insecticides Market Revenue Share (%), by Price Trend Analysis 2025 & 2033
- Figure 12: North America Bio Insecticides Market Revenue (Million), by Country 2025 & 2033
- Figure 13: North America Bio Insecticides Market Revenue Share (%), by Country 2025 & 2033
- Figure 14: South America Bio Insecticides Market Revenue (Million), by Production Analysis 2025 & 2033
- Figure 15: South America Bio Insecticides Market Revenue Share (%), by Production Analysis 2025 & 2033
- Figure 16: South America Bio Insecticides Market Revenue (Million), by Consumption Analysis 2025 & 2033
- Figure 17: South America Bio Insecticides Market Revenue Share (%), by Consumption Analysis 2025 & 2033
- Figure 18: South America Bio Insecticides Market Revenue (Million), by Import Market Analysis (Value & Volume) 2025 & 2033
- Figure 19: South America Bio Insecticides Market Revenue Share (%), by Import Market Analysis (Value & Volume) 2025 & 2033
- Figure 20: South America Bio Insecticides Market Revenue (Million), by Export Market Analysis (Value & Volume) 2025 & 2033
- Figure 21: South America Bio Insecticides Market Revenue Share (%), by Export Market Analysis (Value & Volume) 2025 & 2033
- Figure 22: South America Bio Insecticides Market Revenue (Million), by Price Trend Analysis 2025 & 2033
- Figure 23: South America Bio Insecticides Market Revenue Share (%), by Price Trend Analysis 2025 & 2033
- Figure 24: South America Bio Insecticides Market Revenue (Million), by Country 2025 & 2033
- Figure 25: South America Bio Insecticides Market Revenue Share (%), by Country 2025 & 2033
- Figure 26: Europe Bio Insecticides Market Revenue (Million), by Production Analysis 2025 & 2033
- Figure 27: Europe Bio Insecticides Market Revenue Share (%), by Production Analysis 2025 & 2033
- Figure 28: Europe Bio Insecticides Market Revenue (Million), by Consumption Analysis 2025 & 2033
- Figure 29: Europe Bio Insecticides Market Revenue Share (%), by Consumption Analysis 2025 & 2033
- Figure 30: Europe Bio Insecticides Market Revenue (Million), by Import Market Analysis (Value & Volume) 2025 & 2033
- Figure 31: Europe Bio Insecticides Market Revenue Share (%), by Import Market Analysis (Value & Volume) 2025 & 2033
- Figure 32: Europe Bio Insecticides Market Revenue (Million), by Export Market Analysis (Value & Volume) 2025 & 2033
- Figure 33: Europe Bio Insecticides Market Revenue Share (%), by Export Market Analysis (Value & Volume) 2025 & 2033
- Figure 34: Europe Bio Insecticides Market Revenue (Million), by Price Trend Analysis 2025 & 2033
- Figure 35: Europe Bio Insecticides Market Revenue Share (%), by Price Trend Analysis 2025 & 2033
- Figure 36: Europe Bio Insecticides Market Revenue (Million), by Country 2025 & 2033
- Figure 37: Europe Bio Insecticides Market Revenue Share (%), by Country 2025 & 2033
- Figure 38: Middle East & Africa Bio Insecticides Market Revenue (Million), by Production Analysis 2025 & 2033
- Figure 39: Middle East & Africa Bio Insecticides Market Revenue Share (%), by Production Analysis 2025 & 2033
- Figure 40: Middle East & Africa Bio Insecticides Market Revenue (Million), by Consumption Analysis 2025 & 2033
- Figure 41: Middle East & Africa Bio Insecticides Market Revenue Share (%), by Consumption Analysis 2025 & 2033
- Figure 42: Middle East & Africa Bio Insecticides Market Revenue (Million), by Import Market Analysis (Value & Volume) 2025 & 2033
- Figure 43: Middle East & Africa Bio Insecticides Market Revenue Share (%), by Import Market Analysis (Value & Volume) 2025 & 2033
- Figure 44: Middle East & Africa Bio Insecticides Market Revenue (Million), by Export Market Analysis (Value & Volume) 2025 & 2033
- Figure 45: Middle East & Africa Bio Insecticides Market Revenue Share (%), by Export Market Analysis (Value & Volume) 2025 & 2033
- Figure 46: Middle East & Africa Bio Insecticides Market Revenue (Million), by Price Trend Analysis 2025 & 2033
- Figure 47: Middle East & Africa Bio Insecticides Market Revenue Share (%), by Price Trend Analysis 2025 & 2033
- Figure 48: Middle East & Africa Bio Insecticides Market Revenue (Million), by Country 2025 & 2033
- Figure 49: Middle East & Africa Bio Insecticides Market Revenue Share (%), by Country 2025 & 2033
- Figure 50: Asia Pacific Bio Insecticides Market Revenue (Million), by Production Analysis 2025 & 2033
- Figure 51: Asia Pacific Bio Insecticides Market Revenue Share (%), by Production Analysis 2025 & 2033
- Figure 52: Asia Pacific Bio Insecticides Market Revenue (Million), by Consumption Analysis 2025 & 2033
- Figure 53: Asia Pacific Bio Insecticides Market Revenue Share (%), by Consumption Analysis 2025 & 2033
- Figure 54: Asia Pacific Bio Insecticides Market Revenue (Million), by Import Market Analysis (Value & Volume) 2025 & 2033
- Figure 55: Asia Pacific Bio Insecticides Market Revenue Share (%), by Import Market Analysis (Value & Volume) 2025 & 2033
- Figure 56: Asia Pacific Bio Insecticides Market Revenue (Million), by Export Market Analysis (Value & Volume) 2025 & 2033
- Figure 57: Asia Pacific Bio Insecticides Market Revenue Share (%), by Export Market Analysis (Value & Volume) 2025 & 2033
- Figure 58: Asia Pacific Bio Insecticides Market Revenue (Million), by Price Trend Analysis 2025 & 2033
- Figure 59: Asia Pacific Bio Insecticides Market Revenue Share (%), by Price Trend Analysis 2025 & 2033
- Figure 60: Asia Pacific Bio Insecticides Market Revenue (Million), by Country 2025 & 2033
- Figure 61: Asia Pacific Bio Insecticides Market Revenue Share (%), by Country 2025 & 2033
List of Tables
- Table 1: Global Bio Insecticides Market Revenue Million Forecast, by Production Analysis 2020 & 2033
- Table 2: Global Bio Insecticides Market Revenue Million Forecast, by Consumption Analysis 2020 & 2033
- Table 3: Global Bio Insecticides Market Revenue Million Forecast, by Import Market Analysis (Value & Volume) 2020 & 2033
- Table 4: Global Bio Insecticides Market Revenue Million Forecast, by Export Market Analysis (Value & Volume) 2020 & 2033
- Table 5: Global Bio Insecticides Market Revenue Million Forecast, by Price Trend Analysis 2020 & 2033
- Table 6: Global Bio Insecticides Market Revenue Million Forecast, by Region 2020 & 2033
- Table 7: Global Bio Insecticides Market Revenue Million Forecast, by Production Analysis 2020 & 2033
- Table 8: Global Bio Insecticides Market Revenue Million Forecast, by Consumption Analysis 2020 & 2033
- Table 9: Global Bio Insecticides Market Revenue Million Forecast, by Import Market Analysis (Value & Volume) 2020 & 2033
- Table 10: Global Bio Insecticides Market Revenue Million Forecast, by Export Market Analysis (Value & Volume) 2020 & 2033
- Table 11: Global Bio Insecticides Market Revenue Million Forecast, by Price Trend Analysis 2020 & 2033
- Table 12: Global Bio Insecticides Market Revenue Million Forecast, by Country 2020 & 2033
- Table 13: United States Bio Insecticides Market Revenue (Million) Forecast, by Application 2020 & 2033
- Table 14: Canada Bio Insecticides Market Revenue (Million) Forecast, by Application 2020 & 2033
- Table 15: Mexico Bio Insecticides Market Revenue (Million) Forecast, by Application 2020 & 2033
- Table 16: Global Bio Insecticides Market Revenue Million Forecast, by Production Analysis 2020 & 2033
- Table 17: Global Bio Insecticides Market Revenue Million Forecast, by Consumption Analysis 2020 & 2033
- Table 18: Global Bio Insecticides Market Revenue Million Forecast, by Import Market Analysis (Value & Volume) 2020 & 2033
- Table 19: Global Bio Insecticides Market Revenue Million Forecast, by Export Market Analysis (Value & Volume) 2020 & 2033
- Table 20: Global Bio Insecticides Market Revenue Million Forecast, by Price Trend Analysis 2020 & 2033
- Table 21: Global Bio Insecticides Market Revenue Million Forecast, by Country 2020 & 2033
- Table 22: Brazil Bio Insecticides Market Revenue (Million) Forecast, by Application 2020 & 2033
- Table 23: Argentina Bio Insecticides Market Revenue (Million) Forecast, by Application 2020 & 2033
- Table 24: Rest of South America Bio Insecticides Market Revenue (Million) Forecast, by Application 2020 & 2033
- Table 25: Global Bio Insecticides Market Revenue Million Forecast, by Production Analysis 2020 & 2033
- Table 26: Global Bio Insecticides Market Revenue Million Forecast, by Consumption Analysis 2020 & 2033
- Table 27: Global Bio Insecticides Market Revenue Million Forecast, by Import Market Analysis (Value & Volume) 2020 & 2033
- Table 28: Global Bio Insecticides Market Revenue Million Forecast, by Export Market Analysis (Value & Volume) 2020 & 2033
- Table 29: Global Bio Insecticides Market Revenue Million Forecast, by Price Trend Analysis 2020 & 2033
- Table 30: Global Bio Insecticides Market Revenue Million Forecast, by Country 2020 & 2033
- Table 31: United Kingdom Bio Insecticides Market Revenue (Million) Forecast, by Application 2020 & 2033
- Table 32: Germany Bio Insecticides Market Revenue (Million) Forecast, by Application 2020 & 2033
- Table 33: France Bio Insecticides Market Revenue (Million) Forecast, by Application 2020 & 2033
- Table 34: Italy Bio Insecticides Market Revenue (Million) Forecast, by Application 2020 & 2033
- Table 35: Spain Bio Insecticides Market Revenue (Million) Forecast, by Application 2020 & 2033
- Table 36: Russia Bio Insecticides Market Revenue (Million) Forecast, by Application 2020 & 2033
- Table 37: Benelux Bio Insecticides Market Revenue (Million) Forecast, by Application 2020 & 2033
- Table 38: Nordics Bio Insecticides Market Revenue (Million) Forecast, by Application 2020 & 2033
- Table 39: Rest of Europe Bio Insecticides Market Revenue (Million) Forecast, by Application 2020 & 2033
- Table 40: Global Bio Insecticides Market Revenue Million Forecast, by Production Analysis 2020 & 2033
- Table 41: Global Bio Insecticides Market Revenue Million Forecast, by Consumption Analysis 2020 & 2033
- Table 42: Global Bio Insecticides Market Revenue Million Forecast, by Import Market Analysis (Value & Volume) 2020 & 2033
- Table 43: Global Bio Insecticides Market Revenue Million Forecast, by Export Market Analysis (Value & Volume) 2020 & 2033
- Table 44: Global Bio Insecticides Market Revenue Million Forecast, by Price Trend Analysis 2020 & 2033
- Table 45: Global Bio Insecticides Market Revenue Million Forecast, by Country 2020 & 2033
- Table 46: Turkey Bio Insecticides Market Revenue (Million) Forecast, by Application 2020 & 2033
- Table 47: Israel Bio Insecticides Market Revenue (Million) Forecast, by Application 2020 & 2033
- Table 48: GCC Bio Insecticides Market Revenue (Million) Forecast, by Application 2020 & 2033
- Table 49: North Africa Bio Insecticides Market Revenue (Million) Forecast, by Application 2020 & 2033
- Table 50: South Africa Bio Insecticides Market Revenue (Million) Forecast, by Application 2020 & 2033
- Table 51: Rest of Middle East & Africa Bio Insecticides Market Revenue (Million) Forecast, by Application 2020 & 2033
- Table 52: Global Bio Insecticides Market Revenue Million Forecast, by Production Analysis 2020 & 2033
- Table 53: Global Bio Insecticides Market Revenue Million Forecast, by Consumption Analysis 2020 & 2033
- Table 54: Global Bio Insecticides Market Revenue Million Forecast, by Import Market Analysis (Value & Volume) 2020 & 2033
- Table 55: Global Bio Insecticides Market Revenue Million Forecast, by Export Market Analysis (Value & Volume) 2020 & 2033
- Table 56: Global Bio Insecticides Market Revenue Million Forecast, by Price Trend Analysis 2020 & 2033
- Table 57: Global Bio Insecticides Market Revenue Million Forecast, by Country 2020 & 2033
- Table 58: China Bio Insecticides Market Revenue (Million) Forecast, by Application 2020 & 2033
- Table 59: India Bio Insecticides Market Revenue (Million) Forecast, by Application 2020 & 2033
- Table 60: Japan Bio Insecticides Market Revenue (Million) Forecast, by Application 2020 & 2033
- Table 61: South Korea Bio Insecticides Market Revenue (Million) Forecast, by Application 2020 & 2033
- Table 62: ASEAN Bio Insecticides Market Revenue (Million) Forecast, by Application 2020 & 2033
- Table 63: Oceania Bio Insecticides Market Revenue (Million) Forecast, by Application 2020 & 2033
- Table 64: Rest of Asia Pacific Bio Insecticides Market Revenue (Million) Forecast, by Application 2020 & 2033
Frequently Asked Questions
1. What is the projected Compound Annual Growth Rate (CAGR) of the Bio Insecticides Market?
The projected CAGR is approximately 12.30%.
2. Which companies are prominent players in the Bio Insecticides Market?
Key companies in the market include Marrone Bio innovations, Bayer Cropscience AG, Certis LLC, Bioworks Inc, Valent Biosciences Corporation*List Not Exhaustive, Isagro Spa, Corteva Agriscience, Novozymes AS, Koppert Biological Systems, BASF SE.
3. What are the main segments of the Bio Insecticides Market?
The market segments include Production Analysis, Consumption Analysis, Import Market Analysis (Value & Volume), Export Market Analysis (Value & Volume), Price Trend Analysis.
4. Can you provide details about the market size?
The market size is estimated to be USD XX Million as of 2022.
5. What are some drivers contributing to market growth?
Demand For Landscaping Maintenance; Adoption of Green Spaces and Green Roofs.
6. What are the notable trends driving market growth?
Fruits and Vegetables Occupy the Largest Share By Application.
7. Are there any restraints impacting market growth?
Shortage of Labor In Landscaping; High Maintenance Cost of Lawn Mowers.
8. Can you provide examples of recent developments in the market?
N/A
9. What pricing options are available for accessing the report?
Pricing options include single-user, multi-user, and enterprise licenses priced at USD 4750, USD 5250, and USD 8750 respectively.
10. Is the market size provided in terms of value or volume?
The market size is provided in terms of value, measured in Million.
11. Are there any specific market keywords associated with the report?
Yes, the market keyword associated with the report is "Bio Insecticides Market," which aids in identifying and referencing the specific market segment covered.
12. How do I determine which pricing option suits my needs best?
The pricing options vary based on user requirements and access needs. Individual users may opt for single-user licenses, while businesses requiring broader access may choose multi-user or enterprise licenses for cost-effective access to the report.
13. Are there any additional resources or data provided in the Bio Insecticides Market report?
While the report offers comprehensive insights, it's advisable to review the specific contents or supplementary materials provided to ascertain if additional resources or data are available.
14. How can I stay updated on further developments or reports in the Bio Insecticides Market?
To stay informed about further developments, trends, and reports in the Bio Insecticides Market, consider subscribing to industry newsletters, following relevant companies and organizations, or regularly checking reputable industry news sources and publications.
Methodology
Step 1 - Identification of Relevant Samples Size from Population Database


Step 2 - Approaches for Defining Global Market Size (Value, Volume* & Price*)

Note*: In applicable scenarios
Step 3 - Data Sources
Primary Research
- Web Analytics
- Survey Reports
- Research Institute
- Latest Research Reports
- Opinion Leaders
Secondary Research
- Annual Reports
- White Paper
- Latest Press Release
- Industry Association
- Paid Database
- Investor Presentations

Step 4 - Data Triangulation
Involves using different sources of information in order to increase the validity of a study
These sources are likely to be stakeholders in a program - participants, other researchers, program staff, other community members, and so on.
Then we put all data in single framework & apply various statistical tools to find out the dynamic on the market.
During the analysis stage, feedback from the stakeholder groups would be compared to determine areas of agreement as well as areas of divergence