

Key Insights
The global bulletproof glass market is poised for significant expansion, driven by escalating security concerns across automotive, building and construction, and defense sectors. Technological innovations yielding lighter, stronger, and more transparent solutions are key growth enablers. The automotive industry's focus on advanced safety features and the rise of high-security infrastructure projects are substantial market drivers. While solid acrylic and laminated glass currently lead, polycarbonate and glass-clad polycarbonate are gaining prominence for their performance and cost-efficiency in niche applications. The Asia-Pacific region, particularly China and India, offers substantial opportunities due to rapid urbanization and infrastructure development. High manufacturing costs and competing security solutions represent market challenges. Key industry players include Saint-Gobain and Nippon Sheet Glass Co Ltd, alongside regional and specialized manufacturers. Sustained innovation in materials science, strategic alliances, and adaptation to evolving security threats and regulations will shape future market trajectories.
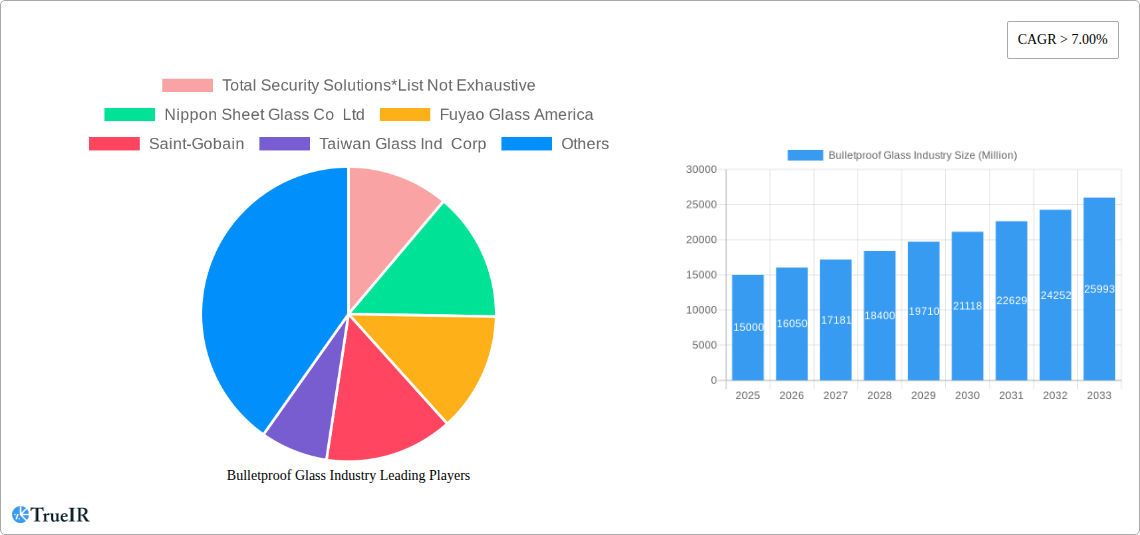
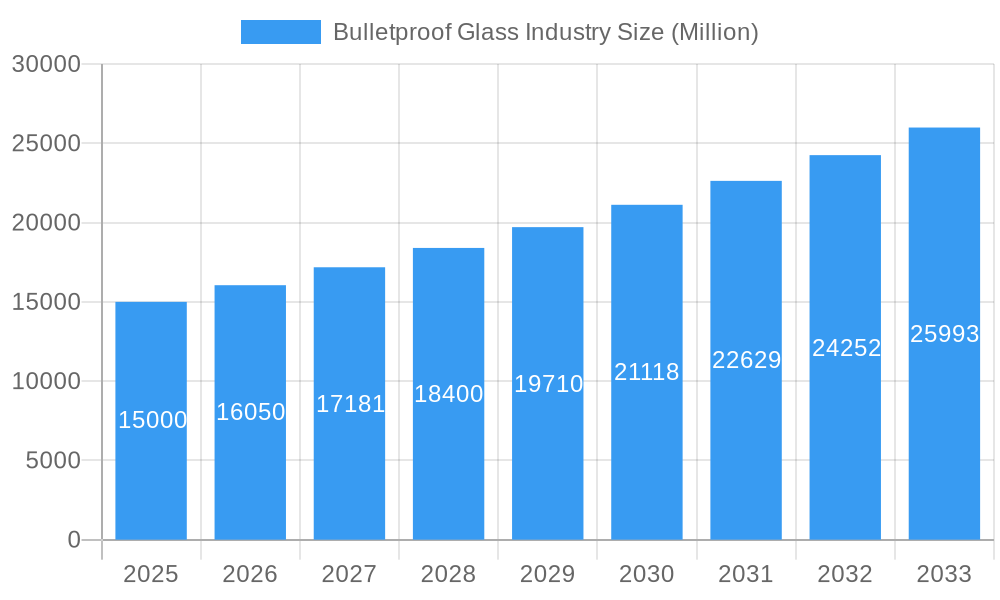
Bulletproof Glass Industry Market Size (In Billion)
The forecast period (2025-2033) projects robust market growth, reaching an estimated $10.83 billion by 2025, with a projected Compound Annual Growth Rate (CAGR) of 11.78%. This expansion is attributed to ongoing security demands and technological advancements. Significant growth is anticipated in Asia-Pacific and North America, spurred by governmental infrastructure investments and increased private sector security spending. Emerging markets in South America and the Middle East also present promising growth avenues due to heightened investments in critical infrastructure and commercial security. The competitive landscape is expected to see further consolidation, with major players prioritizing strategic acquisitions and technological advancements to fortify their market positions.
Bulletproof Glass Industry Company Market Share
Bulletproof Glass Industry Market Report: 2019-2033
This comprehensive report provides a detailed analysis of the global bulletproof glass industry, encompassing market size, competitive landscape, technological advancements, and future growth prospects. The study period covers 2019-2033, with 2025 serving as the base and estimated year. This report is crucial for investors, manufacturers, and industry stakeholders seeking to understand and capitalize on opportunities within this dynamic market valued at over $XX Million.
Bulletproof Glass Industry Market Structure & Competitive Landscape
The global bulletproof glass market is moderately concentrated, with several key players holding significant market share. The industry exhibits a mix of large multinational corporations and specialized smaller firms. Concentration ratios are estimated at XX% for the top 5 players in 2025. Innovation is a key driver, with companies continually developing advanced materials and manufacturing processes to enhance ballistic resistance, transparency, and weight reduction. Regulatory landscapes vary significantly across regions, impacting product standards and market access. Product substitutes, such as high-strength polymers, pose a competitive threat but often lack the transparency and visual clarity of glass-based solutions.
End-user segmentation drives market diversity, with significant demand from the automotive, buildings & construction, and defense sectors. The Automotive segment is projected to reach $XX Million by 2033, followed by Buildings and Construction at $XX Million. Mergers and acquisitions (M&A) activity has been moderate in recent years, with strategic alliances and acquisitions aimed at expanding product portfolios and market reach. In 2024, M&A activity involving bulletproof glass companies totaled approximately $XX Million. The following factors are influencing the market structure:
- High Barriers to Entry: Specialized manufacturing processes and stringent quality standards create significant hurdles for new entrants.
- Technological Advancements: Continuous R&D efforts drive innovation in materials science, leading to improved performance and new product applications.
- Regulatory Compliance: Varying safety standards across regions necessitate product adaptations and increase compliance costs.
- Supply Chain Dynamics: Raw material sourcing and manufacturing complexities influence production costs and market stability.
Bulletproof Glass Industry Market Trends & Opportunities
The bulletproof glass market is experiencing robust growth, with a projected Compound Annual Growth Rate (CAGR) of XX% during the forecast period (2025-2033). This growth is fueled by several key trends: increasing demand for enhanced security across various sectors (driven by geopolitical instability and rising crime rates), technological advancements leading to lighter, stronger, and more transparent bulletproof glass, and expanding applications in commercial and residential construction. Consumer preferences are shifting toward aesthetically pleasing, high-performance products, driving innovation in design and functionality. Competitive dynamics are characterized by ongoing product differentiation, strategic partnerships, and investments in R&D. Market penetration rates vary significantly across regions, with developed countries exhibiting higher adoption rates compared to emerging markets. The total market size is predicted to surpass $XX Million by 2033.
Dominant Markets & Segments in Bulletproof Glass Industry
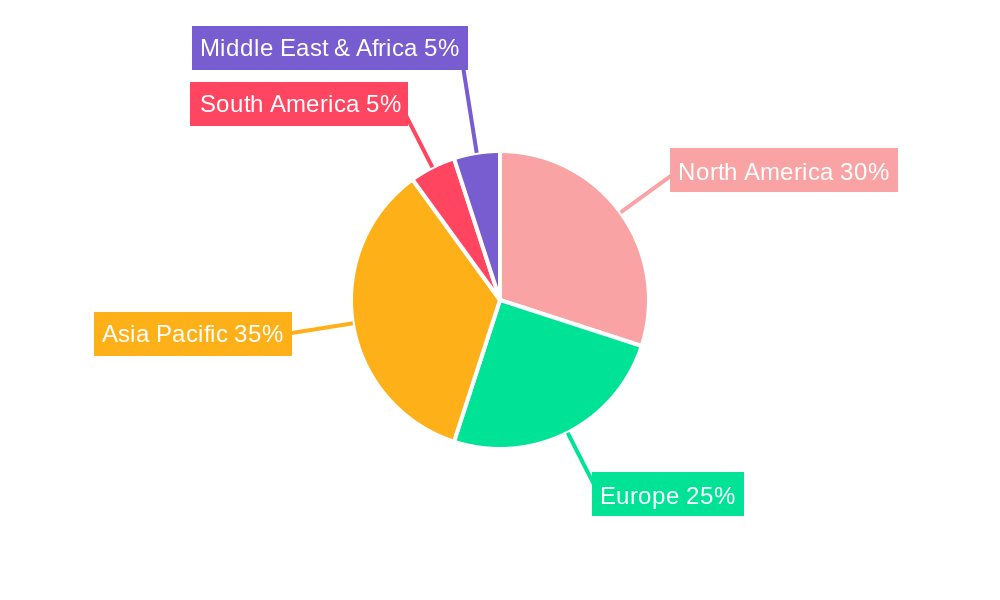
The North American and European markets currently dominate the bulletproof glass industry, driven by strong demand from the defense and construction sectors. However, Asia-Pacific is expected to witness significant growth in the coming years due to infrastructural development and increasing urbanization. Within product segments, traditional laminated glass remains the most prevalent type, accounting for a significant portion of the market share, but Polycarbonate and Glass-clad Polycarbonate are gaining traction due to their lighter weight and superior ballistic protection.
Key Growth Drivers:
- Infrastructure Development: Large-scale construction projects and urban expansion fuel demand in the buildings and construction sector.
- Government Initiatives: Investments in security infrastructure and public safety enhance market prospects.
- Technological Advancements: Innovations in materials science and manufacturing result in improved product performance and wider adoption.
- Rising Security Concerns: Global geopolitical instability and increasing crime rates drive demand for security solutions.
Market Dominance Analysis:
The Buildings and Construction segment demonstrates the highest market share, propelled by rising urbanization and heightened security needs in commercial and residential buildings. This segment is expected to reach $XX Million by 2033. The Automotive sector is another major contributor, driven by increasing demand for high-security vehicles in law enforcement and VIP transportation. The Defense sector provides a significant, albeit less volatile, revenue stream.
Bulletproof Glass Industry Product Analysis
Technological advancements in bulletproof glass production are constantly pushing the boundaries of ballistic protection and aesthetic design. Innovations focus on creating lighter, stronger, and more transparent materials that meet increasing security demands without compromising visual appeal. The introduction of glass-clad polycarbonate and other composite materials addresses the limitations of traditional laminated glass by enhancing ballistic resistance while reducing overall weight. These advancements translate into improved performance, enhanced safety features and increased market fit across diverse applications.
Key Drivers, Barriers & Challenges in Bulletproof Glass Industry
Key Drivers:
The bulletproof glass market is propelled by factors such as rising security concerns globally, technological advancements in materials science, increasing infrastructure development, and stringent government regulations mandating enhanced safety measures in various sectors like transportation and public buildings. The increasing adoption of bulletproof glass in automotive, buildings & construction and defense sectors contributes to this growth.
Challenges and Restraints:
High production costs, stringent regulatory requirements, and the availability of substitute materials pose significant challenges. Supply chain disruptions can impact production and pricing, while intense competition and technological advancements necessitate continuous investments in R&D. These factors exert downward pressure on profit margins and restrict market growth to some extent.
Growth Drivers in the Bulletproof Glass Industry Market
Growth is fueled by increasing security concerns across various sectors, advancements in materials science resulting in lighter, stronger glass, expanding applications in both commercial and residential construction, and government regulations pushing for higher safety standards in both public and private infrastructure.
Challenges Impacting Bulletproof Glass Industry Growth
The industry faces hurdles including high manufacturing costs, complex regulatory landscapes across different regions, supply chain vulnerabilities, and the existence of alternative security solutions. These factors can limit market penetration and impede overall growth.
Key Players Shaping the Bulletproof Glass Industry Market
- Total Security Solutions
- Nippon Sheet Glass Co Ltd
- Fuyao Glass America
- Saint-Gobain
- Taiwan Glass Ind Corp
- Armortex
- Centigon Security Group
- Guardian Industries Holdings
- Asahi India Glass Limited
- Armass glass
- STEC ARMOUR GLASS
- Consolidated Glass Holdings Inc
- Binswanger Glass
- Guangdong Golden Glass Technologies Limited
- SCHOTT AG
Significant Bulletproof Glass Industry Milestones
- January 2023: Asahi India Glass Limited partnered with Enormous Brands for brand films, aiming to boost its AIS Windows market presence.
- January 2023: Guardian Glass acquired Vortex Glass, expanding its tempered glass offerings for residential and commercial construction.
Future Outlook for Bulletproof Glass Industry Market
The bulletproof glass market is poised for continued expansion, driven by technological innovations, increasing security needs, and infrastructural development. Strategic partnerships and investments in R&D will play a crucial role in shaping future market dynamics, promising significant growth opportunities for key players. The market's potential for expansion is substantial, with opportunities extending beyond traditional applications.
Bulletproof Glass Industry Segmentation
-
1. Type
- 1.1. Solid Acrylic
- 1.2. Traditional Laminated
- 1.3. Polycarbonate
- 1.4. Glass-clad Polycarbonate
- 1.5. Other Types
-
2. End-user Industry
- 2.1. Automotive
- 2.2. Buildings and Construction
- 2.3. Defense
- 2.4. Other End-user Industries
Bulletproof Glass Industry Segmentation By Geography
-
1. Asia Pacific
- 1.1. China
- 1.2. India
- 1.3. Japan
- 1.4. South Korea
- 1.5. Rest of Asia Pacific
-
2. North America
- 2.1. United States
- 2.2. Canada
- 2.3. Mexico
-
3. Europe
- 3.1. Germany
- 3.2. United Kingdom
- 3.3. France
- 3.4. Italy
- 3.5. Rest of Europe
-
4. South America
- 4.1. Brazil
- 4.2. Argentina
- 4.3. Rest of South America
- 5. Middle East
-
6. Saudi Arabia
- 6.1. South Africa
- 6.2. Rest of Middle East
Bulletproof Glass Industry Regional Market Share
Geographic Coverage of Bulletproof Glass Industry
Bulletproof Glass Industry REPORT HIGHLIGHTS
| Aspects | Details |
|---|---|
| Study Period | 2020-2034 |
| Base Year | 2025 |
| Estimated Year | 2026 |
| Forecast Period | 2026-2034 |
| Historical Period | 2020-2025 |
| Growth Rate | CAGR of 11.78% from 2020-2034 |
| Segmentation |
|
Table of Contents
- 1. Introduction
- 1.1. Research Scope
- 1.2. Market Segmentation
- 1.3. Research Objective
- 1.4. Definitions and Assumptions
- 2. Executive Summary
- 2.1. Market Snapshot
- 3. Market Dynamics
- 3.1. Market Drivers
- 3.2. Market Restrains
- 3.3. Market Trends
- 3.4. Market Opportunities
- 4. Market Factor Analysis
- 4.1. Porters Five Forces
- 4.1.1. Bargaining Power of Suppliers
- 4.1.2. Bargaining Power of Buyers
- 4.1.3. Threat of New Entrants
- 4.1.4. Threat of Substitutes
- 4.1.5. Competitive Rivalry
- 4.2. PESTEL analysis
- 4.3. BCG Analysis
- 4.3.1. Stars (High Growth, High Market Share)
- 4.3.2. Cash Cows (Low Growth, High Market Share)
- 4.3.3. Question Mark (High Growth, Low Market Share)
- 4.3.4. Dogs (Low Growth, Low Market Share)
- 4.4. Ansoff Matrix Analysis
- 4.5. Supply Chain Analysis
- 4.6. Regulatory Landscape
- 4.7. Current Market Potential and Opportunity Assessment (TAM–SAM–SOM Framework)
- 4.8. TIR Analyst Note
- 4.1. Porters Five Forces
- 5. Market Analysis, Insights and Forecast 2021-2033
- 5.1. Market Analysis, Insights and Forecast - by Type
- 5.1.1. Solid Acrylic
- 5.1.2. Traditional Laminated
- 5.1.3. Polycarbonate
- 5.1.4. Glass-clad Polycarbonate
- 5.1.5. Other Types
- 5.2. Market Analysis, Insights and Forecast - by End-user Industry
- 5.2.1. Automotive
- 5.2.2. Buildings and Construction
- 5.2.3. Defense
- 5.2.4. Other End-user Industries
- 5.3. Market Analysis, Insights and Forecast - by Region
- 5.3.1. Asia Pacific
- 5.3.2. North America
- 5.3.3. Europe
- 5.3.4. South America
- 5.3.5. Middle East
- 5.3.6. Saudi Arabia
- 5.1. Market Analysis, Insights and Forecast - by Type
- 6. Global Bulletproof Glass Industry Analysis, Insights and Forecast, 2021-2033
- 6.1. Market Analysis, Insights and Forecast - by Type
- 6.1.1. Solid Acrylic
- 6.1.2. Traditional Laminated
- 6.1.3. Polycarbonate
- 6.1.4. Glass-clad Polycarbonate
- 6.1.5. Other Types
- 6.2. Market Analysis, Insights and Forecast - by End-user Industry
- 6.2.1. Automotive
- 6.2.2. Buildings and Construction
- 6.2.3. Defense
- 6.2.4. Other End-user Industries
- 6.1. Market Analysis, Insights and Forecast - by Type
- 7. Asia Pacific Bulletproof Glass Industry Analysis, Insights and Forecast, 2020-2032
- 7.1. Market Analysis, Insights and Forecast - by Type
- 7.1.1. Solid Acrylic
- 7.1.2. Traditional Laminated
- 7.1.3. Polycarbonate
- 7.1.4. Glass-clad Polycarbonate
- 7.1.5. Other Types
- 7.2. Market Analysis, Insights and Forecast - by End-user Industry
- 7.2.1. Automotive
- 7.2.2. Buildings and Construction
- 7.2.3. Defense
- 7.2.4. Other End-user Industries
- 7.1. Market Analysis, Insights and Forecast - by Type
- 8. North America Bulletproof Glass Industry Analysis, Insights and Forecast, 2020-2032
- 8.1. Market Analysis, Insights and Forecast - by Type
- 8.1.1. Solid Acrylic
- 8.1.2. Traditional Laminated
- 8.1.3. Polycarbonate
- 8.1.4. Glass-clad Polycarbonate
- 8.1.5. Other Types
- 8.2. Market Analysis, Insights and Forecast - by End-user Industry
- 8.2.1. Automotive
- 8.2.2. Buildings and Construction
- 8.2.3. Defense
- 8.2.4. Other End-user Industries
- 8.1. Market Analysis, Insights and Forecast - by Type
- 9. Europe Bulletproof Glass Industry Analysis, Insights and Forecast, 2020-2032
- 9.1. Market Analysis, Insights and Forecast - by Type
- 9.1.1. Solid Acrylic
- 9.1.2. Traditional Laminated
- 9.1.3. Polycarbonate
- 9.1.4. Glass-clad Polycarbonate
- 9.1.5. Other Types
- 9.2. Market Analysis, Insights and Forecast - by End-user Industry
- 9.2.1. Automotive
- 9.2.2. Buildings and Construction
- 9.2.3. Defense
- 9.2.4. Other End-user Industries
- 9.1. Market Analysis, Insights and Forecast - by Type
- 10. South America Bulletproof Glass Industry Analysis, Insights and Forecast, 2020-2032
- 10.1. Market Analysis, Insights and Forecast - by Type
- 10.1.1. Solid Acrylic
- 10.1.2. Traditional Laminated
- 10.1.3. Polycarbonate
- 10.1.4. Glass-clad Polycarbonate
- 10.1.5. Other Types
- 10.2. Market Analysis, Insights and Forecast - by End-user Industry
- 10.2.1. Automotive
- 10.2.2. Buildings and Construction
- 10.2.3. Defense
- 10.2.4. Other End-user Industries
- 10.1. Market Analysis, Insights and Forecast - by Type
- 11. Middle East Bulletproof Glass Industry Analysis, Insights and Forecast, 2020-2032
- 11.1. Market Analysis, Insights and Forecast - by Type
- 11.1.1. Solid Acrylic
- 11.1.2. Traditional Laminated
- 11.1.3. Polycarbonate
- 11.1.4. Glass-clad Polycarbonate
- 11.1.5. Other Types
- 11.2. Market Analysis, Insights and Forecast - by End-user Industry
- 11.2.1. Automotive
- 11.2.2. Buildings and Construction
- 11.2.3. Defense
- 11.2.4. Other End-user Industries
- 11.1. Market Analysis, Insights and Forecast - by Type
- 12. Saudi Arabia Bulletproof Glass Industry Analysis, Insights and Forecast, 2020-2032
- 12.1. Market Analysis, Insights and Forecast - by Type
- 12.1.1. Solid Acrylic
- 12.1.2. Traditional Laminated
- 12.1.3. Polycarbonate
- 12.1.4. Glass-clad Polycarbonate
- 12.1.5. Other Types
- 12.2. Market Analysis, Insights and Forecast - by End-user Industry
- 12.2.1. Automotive
- 12.2.2. Buildings and Construction
- 12.2.3. Defense
- 12.2.4. Other End-user Industries
- 12.1. Market Analysis, Insights and Forecast - by Type
- 13. Competitive Analysis
- 13.1. Company Profiles
- 13.1.1 Total Security Solutions*List Not Exhaustive
- 13.1.1.1. Company Overview
- 13.1.1.2. Products
- 13.1.1.3. Company Financials
- 13.1.1.4. SWOT Analysis
- 13.1.2 Nippon Sheet Glass Co Ltd
- 13.1.2.1. Company Overview
- 13.1.2.2. Products
- 13.1.2.3. Company Financials
- 13.1.2.4. SWOT Analysis
- 13.1.3 Fuyao Glass America
- 13.1.3.1. Company Overview
- 13.1.3.2. Products
- 13.1.3.3. Company Financials
- 13.1.3.4. SWOT Analysis
- 13.1.4 Saint-Gobain
- 13.1.4.1. Company Overview
- 13.1.4.2. Products
- 13.1.4.3. Company Financials
- 13.1.4.4. SWOT Analysis
- 13.1.5 Taiwan Glass Ind Corp
- 13.1.5.1. Company Overview
- 13.1.5.2. Products
- 13.1.5.3. Company Financials
- 13.1.5.4. SWOT Analysis
- 13.1.6 Armortex
- 13.1.6.1. Company Overview
- 13.1.6.2. Products
- 13.1.6.3. Company Financials
- 13.1.6.4. SWOT Analysis
- 13.1.7 Centigon Security Group
- 13.1.7.1. Company Overview
- 13.1.7.2. Products
- 13.1.7.3. Company Financials
- 13.1.7.4. SWOT Analysis
- 13.1.8 Guardian Industries Holdings
- 13.1.8.1. Company Overview
- 13.1.8.2. Products
- 13.1.8.3. Company Financials
- 13.1.8.4. SWOT Analysis
- 13.1.9 Asahi India Glass Limited
- 13.1.9.1. Company Overview
- 13.1.9.2. Products
- 13.1.9.3. Company Financials
- 13.1.9.4. SWOT Analysis
- 13.1.10 Armass glass
- 13.1.10.1. Company Overview
- 13.1.10.2. Products
- 13.1.10.3. Company Financials
- 13.1.10.4. SWOT Analysis
- 13.1.11 STEC ARMOUR GLASS
- 13.1.11.1. Company Overview
- 13.1.11.2. Products
- 13.1.11.3. Company Financials
- 13.1.11.4. SWOT Analysis
- 13.1.12 Consolidated Glass Holdings Inc
- 13.1.12.1. Company Overview
- 13.1.12.2. Products
- 13.1.12.3. Company Financials
- 13.1.12.4. SWOT Analysis
- 13.1.13 Binswanger Glass
- 13.1.13.1. Company Overview
- 13.1.13.2. Products
- 13.1.13.3. Company Financials
- 13.1.13.4. SWOT Analysis
- 13.1.14 Guangdong Golden Glass Technologies Limited
- 13.1.14.1. Company Overview
- 13.1.14.2. Products
- 13.1.14.3. Company Financials
- 13.1.14.4. SWOT Analysis
- 13.1.15 SCHOTT AG
- 13.1.15.1. Company Overview
- 13.1.15.2. Products
- 13.1.15.3. Company Financials
- 13.1.15.4. SWOT Analysis
- 13.1.1 Total Security Solutions*List Not Exhaustive
- 13.2. Market Entropy
- 13.2.1 Company's Key Areas Served
- 13.2.2 Recent Developments
- 13.3. Company Market Share Analysis 2025
- 13.3.1 Top 5 Companies Market Share Analysis
- 13.3.2 Top 3 Companies Market Share Analysis
- 13.4. List of Potential Customers
- 14. Research Methodology
List of Figures
- Figure 1: Global Bulletproof Glass Industry Revenue Breakdown (billion, %) by Region 2025 & 2033
- Figure 2: Asia Pacific Bulletproof Glass Industry Revenue (billion), by Type 2025 & 2033
- Figure 3: Asia Pacific Bulletproof Glass Industry Revenue Share (%), by Type 2025 & 2033
- Figure 4: Asia Pacific Bulletproof Glass Industry Revenue (billion), by End-user Industry 2025 & 2033
- Figure 5: Asia Pacific Bulletproof Glass Industry Revenue Share (%), by End-user Industry 2025 & 2033
- Figure 6: Asia Pacific Bulletproof Glass Industry Revenue (billion), by Country 2025 & 2033
- Figure 7: Asia Pacific Bulletproof Glass Industry Revenue Share (%), by Country 2025 & 2033
- Figure 8: North America Bulletproof Glass Industry Revenue (billion), by Type 2025 & 2033
- Figure 9: North America Bulletproof Glass Industry Revenue Share (%), by Type 2025 & 2033
- Figure 10: North America Bulletproof Glass Industry Revenue (billion), by End-user Industry 2025 & 2033
- Figure 11: North America Bulletproof Glass Industry Revenue Share (%), by End-user Industry 2025 & 2033
- Figure 12: North America Bulletproof Glass Industry Revenue (billion), by Country 2025 & 2033
- Figure 13: North America Bulletproof Glass Industry Revenue Share (%), by Country 2025 & 2033
- Figure 14: Europe Bulletproof Glass Industry Revenue (billion), by Type 2025 & 2033
- Figure 15: Europe Bulletproof Glass Industry Revenue Share (%), by Type 2025 & 2033
- Figure 16: Europe Bulletproof Glass Industry Revenue (billion), by End-user Industry 2025 & 2033
- Figure 17: Europe Bulletproof Glass Industry Revenue Share (%), by End-user Industry 2025 & 2033
- Figure 18: Europe Bulletproof Glass Industry Revenue (billion), by Country 2025 & 2033
- Figure 19: Europe Bulletproof Glass Industry Revenue Share (%), by Country 2025 & 2033
- Figure 20: South America Bulletproof Glass Industry Revenue (billion), by Type 2025 & 2033
- Figure 21: South America Bulletproof Glass Industry Revenue Share (%), by Type 2025 & 2033
- Figure 22: South America Bulletproof Glass Industry Revenue (billion), by End-user Industry 2025 & 2033
- Figure 23: South America Bulletproof Glass Industry Revenue Share (%), by End-user Industry 2025 & 2033
- Figure 24: South America Bulletproof Glass Industry Revenue (billion), by Country 2025 & 2033
- Figure 25: South America Bulletproof Glass Industry Revenue Share (%), by Country 2025 & 2033
- Figure 26: Middle East Bulletproof Glass Industry Revenue (billion), by Type 2025 & 2033
- Figure 27: Middle East Bulletproof Glass Industry Revenue Share (%), by Type 2025 & 2033
- Figure 28: Middle East Bulletproof Glass Industry Revenue (billion), by End-user Industry 2025 & 2033
- Figure 29: Middle East Bulletproof Glass Industry Revenue Share (%), by End-user Industry 2025 & 2033
- Figure 30: Middle East Bulletproof Glass Industry Revenue (billion), by Country 2025 & 2033
- Figure 31: Middle East Bulletproof Glass Industry Revenue Share (%), by Country 2025 & 2033
- Figure 32: Saudi Arabia Bulletproof Glass Industry Revenue (billion), by Type 2025 & 2033
- Figure 33: Saudi Arabia Bulletproof Glass Industry Revenue Share (%), by Type 2025 & 2033
- Figure 34: Saudi Arabia Bulletproof Glass Industry Revenue (billion), by End-user Industry 2025 & 2033
- Figure 35: Saudi Arabia Bulletproof Glass Industry Revenue Share (%), by End-user Industry 2025 & 2033
- Figure 36: Saudi Arabia Bulletproof Glass Industry Revenue (billion), by Country 2025 & 2033
- Figure 37: Saudi Arabia Bulletproof Glass Industry Revenue Share (%), by Country 2025 & 2033
List of Tables
- Table 1: Global Bulletproof Glass Industry Revenue billion Forecast, by Type 2020 & 2033
- Table 2: Global Bulletproof Glass Industry Revenue billion Forecast, by End-user Industry 2020 & 2033
- Table 3: Global Bulletproof Glass Industry Revenue billion Forecast, by Region 2020 & 2033
- Table 4: Global Bulletproof Glass Industry Revenue billion Forecast, by Type 2020 & 2033
- Table 5: Global Bulletproof Glass Industry Revenue billion Forecast, by End-user Industry 2020 & 2033
- Table 6: Global Bulletproof Glass Industry Revenue billion Forecast, by Country 2020 & 2033
- Table 7: China Bulletproof Glass Industry Revenue (billion) Forecast, by Application 2020 & 2033
- Table 8: India Bulletproof Glass Industry Revenue (billion) Forecast, by Application 2020 & 2033
- Table 9: Japan Bulletproof Glass Industry Revenue (billion) Forecast, by Application 2020 & 2033
- Table 10: South Korea Bulletproof Glass Industry Revenue (billion) Forecast, by Application 2020 & 2033
- Table 11: Rest of Asia Pacific Bulletproof Glass Industry Revenue (billion) Forecast, by Application 2020 & 2033
- Table 12: Global Bulletproof Glass Industry Revenue billion Forecast, by Type 2020 & 2033
- Table 13: Global Bulletproof Glass Industry Revenue billion Forecast, by End-user Industry 2020 & 2033
- Table 14: Global Bulletproof Glass Industry Revenue billion Forecast, by Country 2020 & 2033
- Table 15: United States Bulletproof Glass Industry Revenue (billion) Forecast, by Application 2020 & 2033
- Table 16: Canada Bulletproof Glass Industry Revenue (billion) Forecast, by Application 2020 & 2033
- Table 17: Mexico Bulletproof Glass Industry Revenue (billion) Forecast, by Application 2020 & 2033
- Table 18: Global Bulletproof Glass Industry Revenue billion Forecast, by Type 2020 & 2033
- Table 19: Global Bulletproof Glass Industry Revenue billion Forecast, by End-user Industry 2020 & 2033
- Table 20: Global Bulletproof Glass Industry Revenue billion Forecast, by Country 2020 & 2033
- Table 21: Germany Bulletproof Glass Industry Revenue (billion) Forecast, by Application 2020 & 2033
- Table 22: United Kingdom Bulletproof Glass Industry Revenue (billion) Forecast, by Application 2020 & 2033
- Table 23: France Bulletproof Glass Industry Revenue (billion) Forecast, by Application 2020 & 2033
- Table 24: Italy Bulletproof Glass Industry Revenue (billion) Forecast, by Application 2020 & 2033
- Table 25: Rest of Europe Bulletproof Glass Industry Revenue (billion) Forecast, by Application 2020 & 2033
- Table 26: Global Bulletproof Glass Industry Revenue billion Forecast, by Type 2020 & 2033
- Table 27: Global Bulletproof Glass Industry Revenue billion Forecast, by End-user Industry 2020 & 2033
- Table 28: Global Bulletproof Glass Industry Revenue billion Forecast, by Country 2020 & 2033
- Table 29: Brazil Bulletproof Glass Industry Revenue (billion) Forecast, by Application 2020 & 2033
- Table 30: Argentina Bulletproof Glass Industry Revenue (billion) Forecast, by Application 2020 & 2033
- Table 31: Rest of South America Bulletproof Glass Industry Revenue (billion) Forecast, by Application 2020 & 2033
- Table 32: Global Bulletproof Glass Industry Revenue billion Forecast, by Type 2020 & 2033
- Table 33: Global Bulletproof Glass Industry Revenue billion Forecast, by End-user Industry 2020 & 2033
- Table 34: Global Bulletproof Glass Industry Revenue billion Forecast, by Country 2020 & 2033
- Table 35: Global Bulletproof Glass Industry Revenue billion Forecast, by Type 2020 & 2033
- Table 36: Global Bulletproof Glass Industry Revenue billion Forecast, by End-user Industry 2020 & 2033
- Table 37: Global Bulletproof Glass Industry Revenue billion Forecast, by Country 2020 & 2033
- Table 38: South Africa Bulletproof Glass Industry Revenue (billion) Forecast, by Application 2020 & 2033
- Table 39: Rest of Middle East Bulletproof Glass Industry Revenue (billion) Forecast, by Application 2020 & 2033
Frequently Asked Questions
1. What is the projected Compound Annual Growth Rate (CAGR) of the Bulletproof Glass Industry?
The projected CAGR is approximately 11.78%.
2. Which companies are prominent players in the Bulletproof Glass Industry?
Key companies in the market include Total Security Solutions*List Not Exhaustive, Nippon Sheet Glass Co Ltd, Fuyao Glass America, Saint-Gobain, Taiwan Glass Ind Corp, Armortex, Centigon Security Group, Guardian Industries Holdings, Asahi India Glass Limited, Armass glass, STEC ARMOUR GLASS, Consolidated Glass Holdings Inc, Binswanger Glass, Guangdong Golden Glass Technologies Limited, SCHOTT AG.
3. What are the main segments of the Bulletproof Glass Industry?
The market segments include Type, End-user Industry.
4. Can you provide details about the market size?
The market size is estimated to be USD 10.83 billion as of 2022.
5. What are some drivers contributing to market growth?
High Military Spending; Increased Development and Construction Activity.
6. What are the notable trends driving market growth?
Increasing Demand from Defense Sector to Dominate the Market.
7. Are there any restraints impacting market growth?
High-end pricing of Raw Materials.
8. Can you provide examples of recent developments in the market?
January 2023: Asahi India Glass Limited announced its collaboration with Enormous Brands to create brand films for its complete doors and windows solutions brand, AIS Windows. With this collaboration, AIS Windows is aiming to make a large impact in the doors and windows segment.
9. What pricing options are available for accessing the report?
Pricing options include single-user, multi-user, and enterprise licenses priced at USD 4750, USD 5250, and USD 8750 respectively.
10. Is the market size provided in terms of value or volume?
The market size is provided in terms of value, measured in billion.
11. Are there any specific market keywords associated with the report?
Yes, the market keyword associated with the report is "Bulletproof Glass Industry," which aids in identifying and referencing the specific market segment covered.
12. How do I determine which pricing option suits my needs best?
The pricing options vary based on user requirements and access needs. Individual users may opt for single-user licenses, while businesses requiring broader access may choose multi-user or enterprise licenses for cost-effective access to the report.
13. Are there any additional resources or data provided in the Bulletproof Glass Industry report?
While the report offers comprehensive insights, it's advisable to review the specific contents or supplementary materials provided to ascertain if additional resources or data are available.
14. How can I stay updated on further developments or reports in the Bulletproof Glass Industry?
To stay informed about further developments, trends, and reports in the Bulletproof Glass Industry, consider subscribing to industry newsletters, following relevant companies and organizations, or regularly checking reputable industry news sources and publications.
Methodology
Step 1 - Identification of Relevant Samples Size from Population Database


Step 2 - Approaches for Defining Global Market Size (Value, Volume* & Price*)

Note*: In applicable scenarios
Step 3 - Data Sources
Primary Research
- Web Analytics
- Survey Reports
- Research Institute
- Latest Research Reports
- Opinion Leaders
Secondary Research
- Annual Reports
- White Paper
- Latest Press Release
- Industry Association
- Paid Database
- Investor Presentations

Step 4 - Data Triangulation
Involves using different sources of information in order to increase the validity of a study
These sources are likely to be stakeholders in a program - participants, other researchers, program staff, other community members, and so on.
Then we put all data in single framework & apply various statistical tools to find out the dynamic on the market.
During the analysis stage, feedback from the stakeholder groups would be compared to determine areas of agreement as well as areas of divergence