

Key Insights
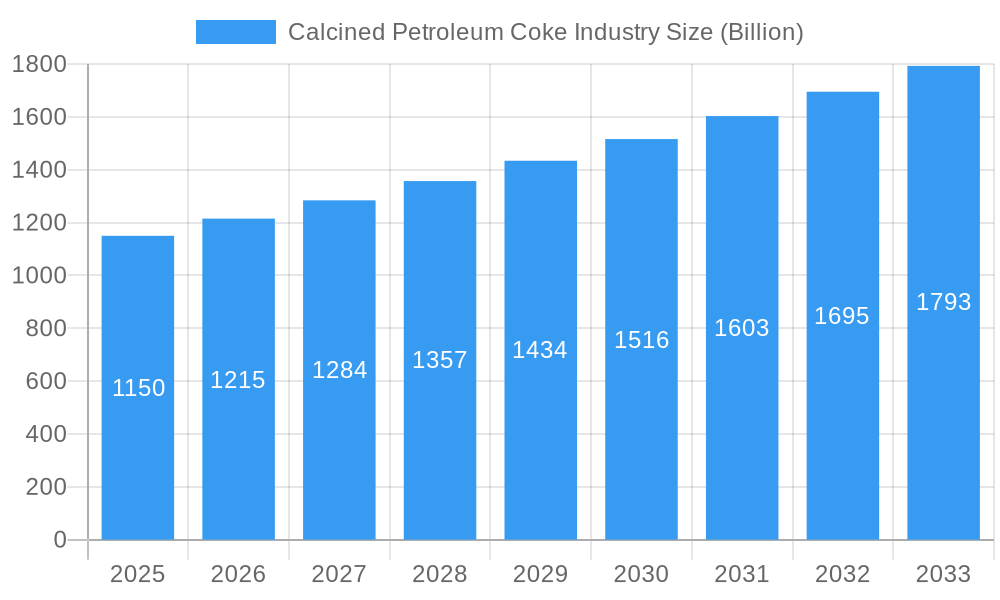
The global calcined petroleum coke (CPC) market, valued at $1.15 billion in 2025, is projected to experience robust growth, driven primarily by the increasing demand from the aluminum and steel industries. The rising global production of aluminum, fueled by expanding construction and automotive sectors, significantly contributes to the CPC market's expansion. Furthermore, the steel industry’s reliance on CPC as a fuel source and reductant in the production process consistently fuels demand. Growth is further supported by the ongoing transition towards greener technologies in some applications, such as the utilization of CPC in the production of green petroleum coke. This segment is expected to demonstrate above-average growth rates due to increasing environmental concerns and regulatory pressures. However, the market faces challenges such as fluctuating crude oil prices, which directly impact CPC production costs, and environmental concerns related to CPC emissions. Stricter environmental regulations in certain regions may necessitate costly emission control measures, potentially restraining market growth. The market's segmentation, with fuel-grade CPC dominating and calcined coke used across various applications including green petroleum coke and traditional applications like bricks, glass, and carbon products, presents opportunities for specialized players to cater to specific needs. The geographic distribution of the market, with significant presence in North America, Europe, and Asia-Pacific, reflects the concentration of aluminum smelting and steel production facilities. The projected CAGR of 5.45% through 2033 indicates a substantial market expansion over the forecast period.
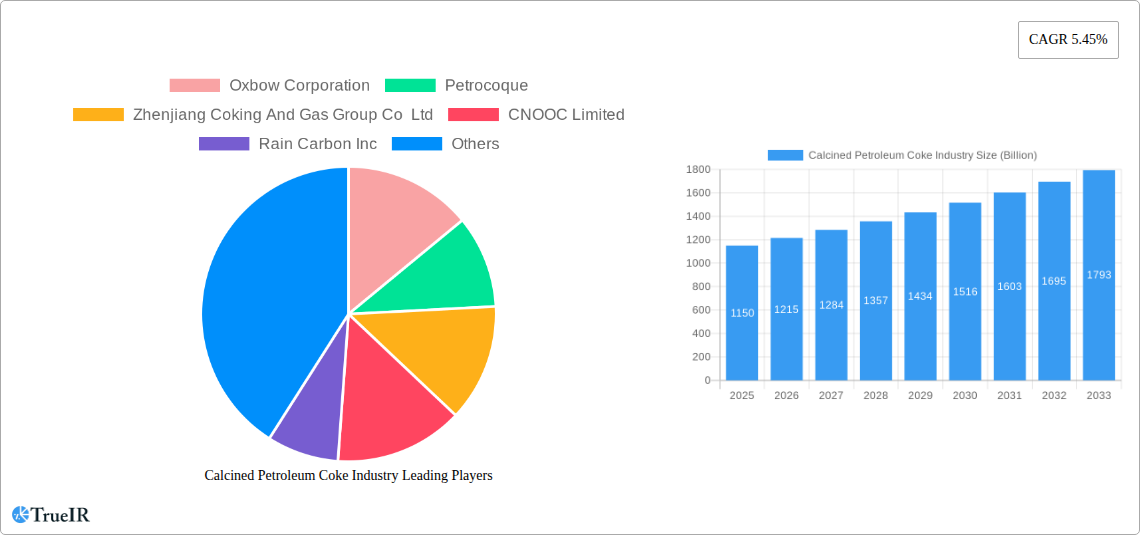
Calcined Petroleum Coke Industry Market Size (In Billion)
The competitive landscape is characterized by a mix of large multinational corporations like Oxbow Corporation, Rain Carbon Inc., and BP PLC alongside regional players. These companies are strategically positioned to leverage technological advancements, optimize production processes, and expand their market share. Ongoing research and development efforts focus on improving CPC quality, reducing emissions, and exploring new applications to enhance competitiveness and meet evolving market demands. Future growth will likely hinge on successful navigation of environmental regulations, effective cost management strategies, and the development of innovative applications for CPC, ensuring its continued role in critical industries. Market players will need to strategically address these factors to maximize their potential within this expanding yet challenging market.
Calcined Petroleum Coke Industry Company Market Share
Calcined Petroleum Coke Industry Market Report: 2019-2033
This comprehensive report provides an in-depth analysis of the global Calcined Petroleum Coke (CPC) industry, covering market size, segmentation, competitive landscape, growth drivers, challenges, and future outlook. The report utilizes data from the historical period (2019-2024), base year (2025), and forecast period (2025-2033), projecting a robust market trajectory. The study period covers 2019-2033. The total market size is projected to reach billions of USD by 2033.
Calcined Petroleum Coke Industry Market Structure & Competitive Landscape
The global calcined petroleum coke (CPC) market is characterized by a moderately concentrated structure, with a select group of dominant players controlling a substantial portion of the market share. While precise concentration ratios are not publicly disclosed, estimations based on comprehensive revenue and production capacity analyses suggest a concentration level of [Insert Estimated Concentration Ratio Here, e.g., "around 60-70%"]. Key market participants are actively engaged in strategic maneuvers, including significant mergers and acquisitions (M&A), which profoundly influence market dynamics and competitive positioning. The M&A volume between 2019 and 2024 is estimated to have reached approximately [Insert Estimated M&A Volume Here, e.g., "$5.2 Billion USD"], predominantly fueled by consolidation efforts aimed at achieving economies of scale and strategic expansion into new territories or product lines.
Innovation in CPC production methods is a pivotal driver, with a strong emphasis on enhancing operational efficiency and minimizing the environmental footprint of manufacturing processes. Concurrently, mounting regulatory pressures to curtail carbon emissions are increasingly shaping both production methodologies and the adoption of CPC in various end-use applications. The market also faces moderate challenges from the emergence of product substitutes, including alternative carbon sources that can fulfill similar roles in the aluminum and steel industries.
The segmentation of the CPC market by end-user is primarily dictated by the aluminum, steel, and graphite electrode industries. Regional consumption patterns exhibit significant variations, with the [Insert Dominant Region Here, e.g., "Asia-Pacific"] region leading in overall CPC consumption. Our in-depth report further enriches these insights with qualitative perspectives from leading industry experts, providing a nuanced understanding of current and emerging trends.
- Key Market Segments: Fuel Grade CPC, Anode Grade Calcined Coke, Green Petroleum Coke (as a precursor), Other Industrial Applications (e.g., Bricks, Glass Manufacturing, Specialty Carbon Products)
- Major Players: Oxbow Corporation, Petrocoque, Zhenjiang Coking And Gas Group Co Ltd, CNOOC Limited, Rain Carbon Inc, Aluminium Bahrain B S C (Alba), Rio Tinto, Numaligarh Refinery Limited, Phillips 66 Company, Maniayargroup, Saudi Calcined Petroleum Coke Company (SCPC), BP PLC, ELSID SA, and other emerging regional producers.
- Competitive Dynamics: The competitive landscape is characterized by intense rivalry, driven by factors such as price sensitivity, the imperative for technological advancements in refining and calcining processes, and the escalating influence of stringent environmental regulations.
Calcined Petroleum Coke Industry Market Trends & Opportunities
The global calcined petroleum coke market is projected to experience significant growth throughout the forecast period, with a Compound Annual Growth Rate (CAGR) of xx% from 2025 to 2033. This growth is primarily attributed to the increasing demand from the aluminum and steel industries, especially in developing economies. Technological advancements in CPC production and processing are leading to higher-quality products with improved efficiency and reduced environmental impact.
Consumer preferences are shifting toward sustainable and environmentally friendly alternatives. This is driving innovation in the production of green petroleum coke and creating opportunities for companies that can meet these demands. Competitive dynamics are shaping the market through pricing strategies, technological advancements, and strategic partnerships. Market penetration rate for green petroleum coke is currently low but projected to increase by xx% over the forecast period, driven by stringent environmental regulations and growing environmental awareness. The report incorporates detailed market sizing and projections for each segment, supported by analysis of historical data.
Dominant Markets & Segments in Calcined Petroleum Coke Industry
The Asia-Pacific region currently commands a dominant position in the global calcined petroleum coke market. This leadership is largely attributable to the sustained and robust growth observed in the region's aluminum and steel manufacturing sectors. China and India, in particular, are significant contributors to this regional ascendancy, owing to their massive industrial output and burgeoning infrastructure development. Within this market, the Fuel Grade segment continues to hold the largest market share. This dominance stems from its versatile and widespread application as an essential fuel source across a spectrum of industrial processes.
-
Key Growth Drivers in Asia-Pacific:
- Accelerated pace of industrialization and ongoing urbanization projects.
- Continuous expansion of steel and aluminum production capacities to meet domestic and international demand.
- Favorable government policies and incentives designed to foster and support industrial growth and development.
-
Fuel Grade Segment Dominance:
- Extensive utilization in cement kilns, power generation, and various other heavy industrial applications.
- Comparative cost-effectiveness and accessibility in relation to other specialized carbon sources.
- Well-established and resilient infrastructure and supply chain networks facilitating efficient distribution.
-
Calcined Coke Segment Growth: This segment is experiencing significant expansion, primarily propelled by the escalating demand from the global aluminum industry for high-quality anode production, a critical component in the smelting process.
-
Green Petroleum Coke: While currently experiencing limited widespread adoption due to higher production costs compared to calcined grades, Green Petroleum Coke exhibits promising growth potential. This is largely driven by growing environmental consciousness and the development of specialized applications where its unique properties can be leveraged, particularly in conjunction with advanced carbon material production.
Calcined Petroleum Coke Industry Product Analysis
Recent advancements in Calcined Petroleum Coke (CPC) production are keenly focused on elevating product quality, ensuring greater consistency across batches, and meticulously reducing the presence of impurities. These innovations encompass the implementation of advanced processing techniques designed to fine-tune CPC's intrinsic properties, thereby enhancing its performance characteristics for specific, demanding applications. A prime example is the drive to achieve higher reactivity in CPC destined for the aluminum industry, which is crucial for efficient anode performance. The market success of any CPC product hinges on achieving an optimal equilibrium between cost-effectiveness and the stringent quality benchmarks set by diverse end-users. Continuous technological evolution is actively contributing to the ongoing improvement of CPC's performance attributes in its principal application areas.
Key Drivers, Barriers & Challenges in Calcined Petroleum Coke Industry
Key Drivers:
- Increasing demand from the aluminum and steel industries, driven by global infrastructure development and construction activities.
- Technological advancements in CPC production leading to improved quality and efficiency.
- Growing investments in the aluminum and steel sector, particularly in developing countries.
Challenges and Restraints:
- Stricter environmental regulations aimed at reducing carbon emissions and air pollution impacting CPC production. This could lead to xx billion USD in compliance costs by 2033.
- Fluctuations in crude oil prices directly affect CPC production costs and profitability.
- Competition from alternative carbon sources, such as coal and biomass.
Growth Drivers in the Calcined Petroleum Coke Industry Market
The growth trajectory of the Calcined Petroleum Coke industry is predominantly propelled by the relentless expansion of the global aluminum and steel sectors. This growth is particularly pronounced in developing economies, where industrialization and infrastructure development are rapidly advancing. Furthermore, government-backed initiatives aimed at bolstering infrastructure projects worldwide significantly contribute to the escalating demand for CPC. Alongside these macro-level drivers, technological advancements focused on producing higher-grade, more energy-efficient CPC also play a crucial role in bolstering market expansion.
Challenges Impacting Calcined Petroleum Coke Industry Growth
Stringent environmental regulations pose a significant challenge, potentially leading to increased production costs and impacting profitability. Fluctuations in crude oil prices, coupled with competition from alternative carbon sources, further hinder growth. Supply chain disruptions and logistical challenges, particularly during global events, can impact availability and increase costs.
Key Players Shaping the Calcined Petroleum Coke Industry Market
- Oxbow Corporation
- Petrocoque
- Zhenjiang Coking And Gas Group Co Ltd
- CNOOC Limited
- Rain Carbon Inc
- Aluminium Bahrain B S C (Alba)
- Rio Tinto
- Numaligarh Refinery Limited
- Phillips 66 Company
- Maniayargroup
- Saudi Calcined Petroleum Coke Company (SCPC)
- BP PLC
- ELSID SA
Significant Calcined Petroleum Coke Industry Industry Milestones
- June 2022: ExxonMobil and Texas A&M University researchers develop a method to reprocess petroleum coke into graphene. This could revolutionize the industry's applications and value chain.
- January 2023: Phillips 66's acquisition of a larger stake in DCP Midstream strengthens its position in the petroleum coke market, potentially improving production efficiency and market reach.
Future Outlook for Calcined Petroleum Coke Industry Market
The Calcined Petroleum Coke industry is strategically positioned for sustained and robust growth in the foreseeable future. This optimistic outlook is underpinned by the persistent and increasing demand from its core user sectors. Success in this evolving market will be increasingly contingent upon strategic investments in cutting-edge production technologies and a steadfast commitment to environmentally responsible operational practices. The market presents substantial opportunities for forward-thinking companies that demonstrate agility in adapting to shifting regulatory landscapes and evolving consumer preferences, with a pronounced emphasis on sustainability and continuous innovation. The strategic development and promotion of high-value applications for CPC, such as its integration into advanced materials science, will be instrumental in shaping the future trajectory and defining the long-term success of this vital industry.
Calcined Petroleum Coke Industry Segmentation
-
1. Type
- 1.1. Fuel Grade
- 1.2. Calcined Coke
-
2. Application
-
2.1. Green Petroleum Coke
- 2.1.1. Aluminum
- 2.1.2. Fuel
- 2.1.3. Iron and steel
- 2.1.4. Silicon Metal
- 2.1.5. Others (Bricks, Glass, Carbon Products, etc)
-
2.2. Calcined Petroleum Coke
- 2.2.1. Titanium Dioxide
- 2.2.2. Re-carburizing Market
- 2.2.3. Others (Needle Coke, Carbon Products, etc)
-
2.1. Green Petroleum Coke
Calcined Petroleum Coke Industry Segmentation By Geography
-
1. Asia Pacific
- 1.1. China
- 1.2. India
- 1.3. Japan
- 1.4. South Korea
- 1.5. ASEAN Countries
- 1.6. Rest of Asia Pacific
-
2. North America
- 2.1. United States
- 2.2. Canada
- 2.3. Mexico
-
3. Europe
- 3.1. Germany
- 3.2. United Kingdom
- 3.3. Italy
- 3.4. France
- 3.5. Spain
- 3.6. Rest of Europe
-
4. South America
- 4.1. Brazil
- 4.2. Argentina
- 4.3. Rest of South America
-
5. Middle East and Africa
- 5.1. Saudi Arabia
- 5.2. South Africa
- 5.3. Rest of Middle East and Africa
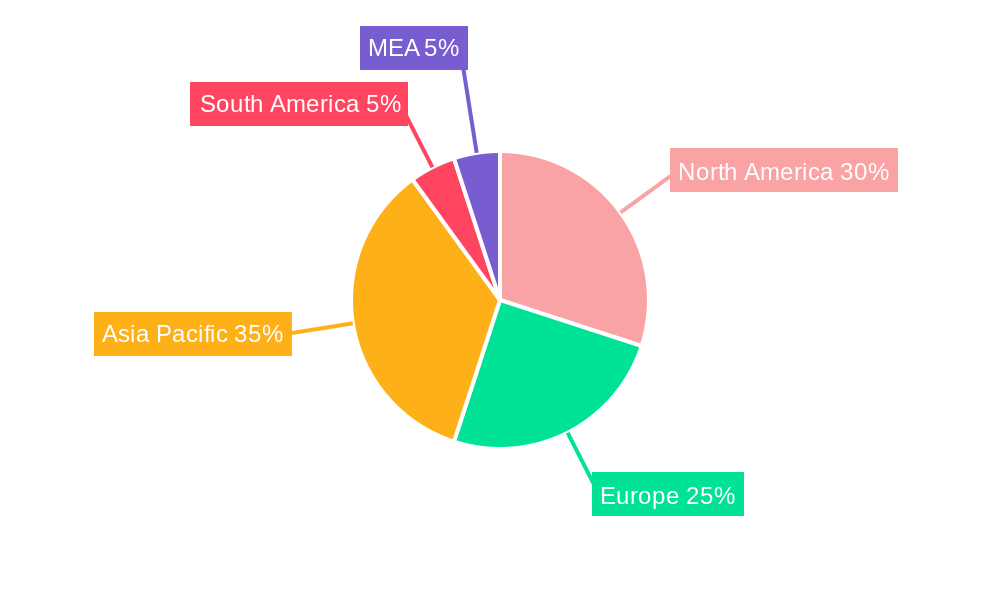
Calcined Petroleum Coke Industry Regional Market Share
Geographic Coverage of Calcined Petroleum Coke Industry
Calcined Petroleum Coke Industry REPORT HIGHLIGHTS
| Aspects | Details |
|---|---|
| Study Period | 2020-2034 |
| Base Year | 2025 |
| Estimated Year | 2026 |
| Forecast Period | 2026-2034 |
| Historical Period | 2020-2025 |
| Growth Rate | CAGR of 5.45% from 2020-2034 |
| Segmentation |
|
Table of Contents
- 1. Introduction
- 1.1. Research Scope
- 1.2. Market Segmentation
- 1.3. Research Objective
- 1.4. Definitions and Assumptions
- 2. Executive Summary
- 2.1. Market Snapshot
- 3. Market Dynamics
- 3.1. Market Drivers
- 3.2. Market Restrains
- 3.3. Market Trends
- 3.4. Market Opportunities
- 4. Market Factor Analysis
- 4.1. Porters Five Forces
- 4.1.1. Bargaining Power of Suppliers
- 4.1.2. Bargaining Power of Buyers
- 4.1.3. Threat of New Entrants
- 4.1.4. Threat of Substitutes
- 4.1.5. Competitive Rivalry
- 4.2. PESTEL analysis
- 4.3. BCG Analysis
- 4.3.1. Stars (High Growth, High Market Share)
- 4.3.2. Cash Cows (Low Growth, High Market Share)
- 4.3.3. Question Mark (High Growth, Low Market Share)
- 4.3.4. Dogs (Low Growth, Low Market Share)
- 4.4. Ansoff Matrix Analysis
- 4.5. Supply Chain Analysis
- 4.6. Regulatory Landscape
- 4.7. Current Market Potential and Opportunity Assessment (TAM–SAM–SOM Framework)
- 4.8. TIR Analyst Note
- 4.1. Porters Five Forces
- 5. Market Analysis, Insights and Forecast 2021-2033
- 5.1. Market Analysis, Insights and Forecast - by Type
- 5.1.1. Fuel Grade
- 5.1.2. Calcined Coke
- 5.2. Market Analysis, Insights and Forecast - by Application
- 5.2.1. Green Petroleum Coke
- 5.2.1.1. Aluminum
- 5.2.1.2. Fuel
- 5.2.1.3. Iron and steel
- 5.2.1.4. Silicon Metal
- 5.2.1.5. Others (Bricks, Glass, Carbon Products, etc)
- 5.2.2. Calcined Petroleum Coke
- 5.2.2.1. Titanium Dioxide
- 5.2.2.2. Re-carburizing Market
- 5.2.2.3. Others (Needle Coke, Carbon Products, etc)
- 5.2.1. Green Petroleum Coke
- 5.3. Market Analysis, Insights and Forecast - by Region
- 5.3.1. Asia Pacific
- 5.3.2. North America
- 5.3.3. Europe
- 5.3.4. South America
- 5.3.5. Middle East and Africa
- 5.1. Market Analysis, Insights and Forecast - by Type
- 6. Global Calcined Petroleum Coke Industry Analysis, Insights and Forecast, 2021-2033
- 6.1. Market Analysis, Insights and Forecast - by Type
- 6.1.1. Fuel Grade
- 6.1.2. Calcined Coke
- 6.2. Market Analysis, Insights and Forecast - by Application
- 6.2.1. Green Petroleum Coke
- 6.2.1.1. Aluminum
- 6.2.1.2. Fuel
- 6.2.1.3. Iron and steel
- 6.2.1.4. Silicon Metal
- 6.2.1.5. Others (Bricks, Glass, Carbon Products, etc)
- 6.2.2. Calcined Petroleum Coke
- 6.2.2.1. Titanium Dioxide
- 6.2.2.2. Re-carburizing Market
- 6.2.2.3. Others (Needle Coke, Carbon Products, etc)
- 6.2.1. Green Petroleum Coke
- 6.1. Market Analysis, Insights and Forecast - by Type
- 7. Asia Pacific Calcined Petroleum Coke Industry Analysis, Insights and Forecast, 2020-2032
- 7.1. Market Analysis, Insights and Forecast - by Type
- 7.1.1. Fuel Grade
- 7.1.2. Calcined Coke
- 7.2. Market Analysis, Insights and Forecast - by Application
- 7.2.1. Green Petroleum Coke
- 7.2.1.1. Aluminum
- 7.2.1.2. Fuel
- 7.2.1.3. Iron and steel
- 7.2.1.4. Silicon Metal
- 7.2.1.5. Others (Bricks, Glass, Carbon Products, etc)
- 7.2.2. Calcined Petroleum Coke
- 7.2.2.1. Titanium Dioxide
- 7.2.2.2. Re-carburizing Market
- 7.2.2.3. Others (Needle Coke, Carbon Products, etc)
- 7.2.1. Green Petroleum Coke
- 7.1. Market Analysis, Insights and Forecast - by Type
- 8. North America Calcined Petroleum Coke Industry Analysis, Insights and Forecast, 2020-2032
- 8.1. Market Analysis, Insights and Forecast - by Type
- 8.1.1. Fuel Grade
- 8.1.2. Calcined Coke
- 8.2. Market Analysis, Insights and Forecast - by Application
- 8.2.1. Green Petroleum Coke
- 8.2.1.1. Aluminum
- 8.2.1.2. Fuel
- 8.2.1.3. Iron and steel
- 8.2.1.4. Silicon Metal
- 8.2.1.5. Others (Bricks, Glass, Carbon Products, etc)
- 8.2.2. Calcined Petroleum Coke
- 8.2.2.1. Titanium Dioxide
- 8.2.2.2. Re-carburizing Market
- 8.2.2.3. Others (Needle Coke, Carbon Products, etc)
- 8.2.1. Green Petroleum Coke
- 8.1. Market Analysis, Insights and Forecast - by Type
- 9. Europe Calcined Petroleum Coke Industry Analysis, Insights and Forecast, 2020-2032
- 9.1. Market Analysis, Insights and Forecast - by Type
- 9.1.1. Fuel Grade
- 9.1.2. Calcined Coke
- 9.2. Market Analysis, Insights and Forecast - by Application
- 9.2.1. Green Petroleum Coke
- 9.2.1.1. Aluminum
- 9.2.1.2. Fuel
- 9.2.1.3. Iron and steel
- 9.2.1.4. Silicon Metal
- 9.2.1.5. Others (Bricks, Glass, Carbon Products, etc)
- 9.2.2. Calcined Petroleum Coke
- 9.2.2.1. Titanium Dioxide
- 9.2.2.2. Re-carburizing Market
- 9.2.2.3. Others (Needle Coke, Carbon Products, etc)
- 9.2.1. Green Petroleum Coke
- 9.1. Market Analysis, Insights and Forecast - by Type
- 10. South America Calcined Petroleum Coke Industry Analysis, Insights and Forecast, 2020-2032
- 10.1. Market Analysis, Insights and Forecast - by Type
- 10.1.1. Fuel Grade
- 10.1.2. Calcined Coke
- 10.2. Market Analysis, Insights and Forecast - by Application
- 10.2.1. Green Petroleum Coke
- 10.2.1.1. Aluminum
- 10.2.1.2. Fuel
- 10.2.1.3. Iron and steel
- 10.2.1.4. Silicon Metal
- 10.2.1.5. Others (Bricks, Glass, Carbon Products, etc)
- 10.2.2. Calcined Petroleum Coke
- 10.2.2.1. Titanium Dioxide
- 10.2.2.2. Re-carburizing Market
- 10.2.2.3. Others (Needle Coke, Carbon Products, etc)
- 10.2.1. Green Petroleum Coke
- 10.1. Market Analysis, Insights and Forecast - by Type
- 11. Middle East and Africa Calcined Petroleum Coke Industry Analysis, Insights and Forecast, 2020-2032
- 11.1. Market Analysis, Insights and Forecast - by Type
- 11.1.1. Fuel Grade
- 11.1.2. Calcined Coke
- 11.2. Market Analysis, Insights and Forecast - by Application
- 11.2.1. Green Petroleum Coke
- 11.2.1.1. Aluminum
- 11.2.1.2. Fuel
- 11.2.1.3. Iron and steel
- 11.2.1.4. Silicon Metal
- 11.2.1.5. Others (Bricks, Glass, Carbon Products, etc)
- 11.2.2. Calcined Petroleum Coke
- 11.2.2.1. Titanium Dioxide
- 11.2.2.2. Re-carburizing Market
- 11.2.2.3. Others (Needle Coke, Carbon Products, etc)
- 11.2.1. Green Petroleum Coke
- 11.1. Market Analysis, Insights and Forecast - by Type
- 12. Competitive Analysis
- 12.1. Company Profiles
- 12.1.1 Oxbow Corporation
- 12.1.1.1. Company Overview
- 12.1.1.2. Products
- 12.1.1.3. Company Financials
- 12.1.1.4. SWOT Analysis
- 12.1.2 Petrocoque
- 12.1.2.1. Company Overview
- 12.1.2.2. Products
- 12.1.2.3. Company Financials
- 12.1.2.4. SWOT Analysis
- 12.1.3 Zhenjiang Coking And Gas Group Co Ltd
- 12.1.3.1. Company Overview
- 12.1.3.2. Products
- 12.1.3.3. Company Financials
- 12.1.3.4. SWOT Analysis
- 12.1.4 CNOOC Limited
- 12.1.4.1. Company Overview
- 12.1.4.2. Products
- 12.1.4.3. Company Financials
- 12.1.4.4. SWOT Analysis
- 12.1.5 Rain Carbon Inc
- 12.1.5.1. Company Overview
- 12.1.5.2. Products
- 12.1.5.3. Company Financials
- 12.1.5.4. SWOT Analysis
- 12.1.6 Aluminium Bahrain B S C (Alba)
- 12.1.6.1. Company Overview
- 12.1.6.2. Products
- 12.1.6.3. Company Financials
- 12.1.6.4. SWOT Analysis
- 12.1.7 Rio Tinto
- 12.1.7.1. Company Overview
- 12.1.7.2. Products
- 12.1.7.3. Company Financials
- 12.1.7.4. SWOT Analysis
- 12.1.8 Numaligarh Refinery Limited
- 12.1.8.1. Company Overview
- 12.1.8.2. Products
- 12.1.8.3. Company Financials
- 12.1.8.4. SWOT Analysis
- 12.1.9 Phillips 66 Company
- 12.1.9.1. Company Overview
- 12.1.9.2. Products
- 12.1.9.3. Company Financials
- 12.1.9.4. SWOT Analysis
- 12.1.10 Maniayargroup
- 12.1.10.1. Company Overview
- 12.1.10.2. Products
- 12.1.10.3. Company Financials
- 12.1.10.4. SWOT Analysis
- 12.1.11 Saudi Calcined Petroleum Coke Company (SCPC)
- 12.1.11.1. Company Overview
- 12.1.11.2. Products
- 12.1.11.3. Company Financials
- 12.1.11.4. SWOT Analysis
- 12.1.12 BP PLC
- 12.1.12.1. Company Overview
- 12.1.12.2. Products
- 12.1.12.3. Company Financials
- 12.1.12.4. SWOT Analysis
- 12.1.13 ELSID SA
- 12.1.13.1. Company Overview
- 12.1.13.2. Products
- 12.1.13.3. Company Financials
- 12.1.13.4. SWOT Analysis
- 12.1.1 Oxbow Corporation
- 12.2. Market Entropy
- 12.2.1 Company's Key Areas Served
- 12.2.2 Recent Developments
- 12.3. Company Market Share Analysis 2025
- 12.3.1 Top 5 Companies Market Share Analysis
- 12.3.2 Top 3 Companies Market Share Analysis
- 12.4. List of Potential Customers
- 13. Research Methodology
List of Figures
- Figure 1: Global Calcined Petroleum Coke Industry Revenue Breakdown (Billion, %) by Region 2025 & 2033
- Figure 2: Global Calcined Petroleum Coke Industry Volume Breakdown (K Tons, %) by Region 2025 & 2033
- Figure 3: Asia Pacific Calcined Petroleum Coke Industry Revenue (Billion), by Type 2025 & 2033
- Figure 4: Asia Pacific Calcined Petroleum Coke Industry Volume (K Tons), by Type 2025 & 2033
- Figure 5: Asia Pacific Calcined Petroleum Coke Industry Revenue Share (%), by Type 2025 & 2033
- Figure 6: Asia Pacific Calcined Petroleum Coke Industry Volume Share (%), by Type 2025 & 2033
- Figure 7: Asia Pacific Calcined Petroleum Coke Industry Revenue (Billion), by Application 2025 & 2033
- Figure 8: Asia Pacific Calcined Petroleum Coke Industry Volume (K Tons), by Application 2025 & 2033
- Figure 9: Asia Pacific Calcined Petroleum Coke Industry Revenue Share (%), by Application 2025 & 2033
- Figure 10: Asia Pacific Calcined Petroleum Coke Industry Volume Share (%), by Application 2025 & 2033
- Figure 11: Asia Pacific Calcined Petroleum Coke Industry Revenue (Billion), by Country 2025 & 2033
- Figure 12: Asia Pacific Calcined Petroleum Coke Industry Volume (K Tons), by Country 2025 & 2033
- Figure 13: Asia Pacific Calcined Petroleum Coke Industry Revenue Share (%), by Country 2025 & 2033
- Figure 14: Asia Pacific Calcined Petroleum Coke Industry Volume Share (%), by Country 2025 & 2033
- Figure 15: North America Calcined Petroleum Coke Industry Revenue (Billion), by Type 2025 & 2033
- Figure 16: North America Calcined Petroleum Coke Industry Volume (K Tons), by Type 2025 & 2033
- Figure 17: North America Calcined Petroleum Coke Industry Revenue Share (%), by Type 2025 & 2033
- Figure 18: North America Calcined Petroleum Coke Industry Volume Share (%), by Type 2025 & 2033
- Figure 19: North America Calcined Petroleum Coke Industry Revenue (Billion), by Application 2025 & 2033
- Figure 20: North America Calcined Petroleum Coke Industry Volume (K Tons), by Application 2025 & 2033
- Figure 21: North America Calcined Petroleum Coke Industry Revenue Share (%), by Application 2025 & 2033
- Figure 22: North America Calcined Petroleum Coke Industry Volume Share (%), by Application 2025 & 2033
- Figure 23: North America Calcined Petroleum Coke Industry Revenue (Billion), by Country 2025 & 2033
- Figure 24: North America Calcined Petroleum Coke Industry Volume (K Tons), by Country 2025 & 2033
- Figure 25: North America Calcined Petroleum Coke Industry Revenue Share (%), by Country 2025 & 2033
- Figure 26: North America Calcined Petroleum Coke Industry Volume Share (%), by Country 2025 & 2033
- Figure 27: Europe Calcined Petroleum Coke Industry Revenue (Billion), by Type 2025 & 2033
- Figure 28: Europe Calcined Petroleum Coke Industry Volume (K Tons), by Type 2025 & 2033
- Figure 29: Europe Calcined Petroleum Coke Industry Revenue Share (%), by Type 2025 & 2033
- Figure 30: Europe Calcined Petroleum Coke Industry Volume Share (%), by Type 2025 & 2033
- Figure 31: Europe Calcined Petroleum Coke Industry Revenue (Billion), by Application 2025 & 2033
- Figure 32: Europe Calcined Petroleum Coke Industry Volume (K Tons), by Application 2025 & 2033
- Figure 33: Europe Calcined Petroleum Coke Industry Revenue Share (%), by Application 2025 & 2033
- Figure 34: Europe Calcined Petroleum Coke Industry Volume Share (%), by Application 2025 & 2033
- Figure 35: Europe Calcined Petroleum Coke Industry Revenue (Billion), by Country 2025 & 2033
- Figure 36: Europe Calcined Petroleum Coke Industry Volume (K Tons), by Country 2025 & 2033
- Figure 37: Europe Calcined Petroleum Coke Industry Revenue Share (%), by Country 2025 & 2033
- Figure 38: Europe Calcined Petroleum Coke Industry Volume Share (%), by Country 2025 & 2033
- Figure 39: South America Calcined Petroleum Coke Industry Revenue (Billion), by Type 2025 & 2033
- Figure 40: South America Calcined Petroleum Coke Industry Volume (K Tons), by Type 2025 & 2033
- Figure 41: South America Calcined Petroleum Coke Industry Revenue Share (%), by Type 2025 & 2033
- Figure 42: South America Calcined Petroleum Coke Industry Volume Share (%), by Type 2025 & 2033
- Figure 43: South America Calcined Petroleum Coke Industry Revenue (Billion), by Application 2025 & 2033
- Figure 44: South America Calcined Petroleum Coke Industry Volume (K Tons), by Application 2025 & 2033
- Figure 45: South America Calcined Petroleum Coke Industry Revenue Share (%), by Application 2025 & 2033
- Figure 46: South America Calcined Petroleum Coke Industry Volume Share (%), by Application 2025 & 2033
- Figure 47: South America Calcined Petroleum Coke Industry Revenue (Billion), by Country 2025 & 2033
- Figure 48: South America Calcined Petroleum Coke Industry Volume (K Tons), by Country 2025 & 2033
- Figure 49: South America Calcined Petroleum Coke Industry Revenue Share (%), by Country 2025 & 2033
- Figure 50: South America Calcined Petroleum Coke Industry Volume Share (%), by Country 2025 & 2033
- Figure 51: Middle East and Africa Calcined Petroleum Coke Industry Revenue (Billion), by Type 2025 & 2033
- Figure 52: Middle East and Africa Calcined Petroleum Coke Industry Volume (K Tons), by Type 2025 & 2033
- Figure 53: Middle East and Africa Calcined Petroleum Coke Industry Revenue Share (%), by Type 2025 & 2033
- Figure 54: Middle East and Africa Calcined Petroleum Coke Industry Volume Share (%), by Type 2025 & 2033
- Figure 55: Middle East and Africa Calcined Petroleum Coke Industry Revenue (Billion), by Application 2025 & 2033
- Figure 56: Middle East and Africa Calcined Petroleum Coke Industry Volume (K Tons), by Application 2025 & 2033
- Figure 57: Middle East and Africa Calcined Petroleum Coke Industry Revenue Share (%), by Application 2025 & 2033
- Figure 58: Middle East and Africa Calcined Petroleum Coke Industry Volume Share (%), by Application 2025 & 2033
- Figure 59: Middle East and Africa Calcined Petroleum Coke Industry Revenue (Billion), by Country 2025 & 2033
- Figure 60: Middle East and Africa Calcined Petroleum Coke Industry Volume (K Tons), by Country 2025 & 2033
- Figure 61: Middle East and Africa Calcined Petroleum Coke Industry Revenue Share (%), by Country 2025 & 2033
- Figure 62: Middle East and Africa Calcined Petroleum Coke Industry Volume Share (%), by Country 2025 & 2033
List of Tables
- Table 1: Global Calcined Petroleum Coke Industry Revenue Billion Forecast, by Type 2020 & 2033
- Table 2: Global Calcined Petroleum Coke Industry Volume K Tons Forecast, by Type 2020 & 2033
- Table 3: Global Calcined Petroleum Coke Industry Revenue Billion Forecast, by Application 2020 & 2033
- Table 4: Global Calcined Petroleum Coke Industry Volume K Tons Forecast, by Application 2020 & 2033
- Table 5: Global Calcined Petroleum Coke Industry Revenue Billion Forecast, by Region 2020 & 2033
- Table 6: Global Calcined Petroleum Coke Industry Volume K Tons Forecast, by Region 2020 & 2033
- Table 7: Global Calcined Petroleum Coke Industry Revenue Billion Forecast, by Type 2020 & 2033
- Table 8: Global Calcined Petroleum Coke Industry Volume K Tons Forecast, by Type 2020 & 2033
- Table 9: Global Calcined Petroleum Coke Industry Revenue Billion Forecast, by Application 2020 & 2033
- Table 10: Global Calcined Petroleum Coke Industry Volume K Tons Forecast, by Application 2020 & 2033
- Table 11: Global Calcined Petroleum Coke Industry Revenue Billion Forecast, by Country 2020 & 2033
- Table 12: Global Calcined Petroleum Coke Industry Volume K Tons Forecast, by Country 2020 & 2033
- Table 13: China Calcined Petroleum Coke Industry Revenue (Billion) Forecast, by Application 2020 & 2033
- Table 14: China Calcined Petroleum Coke Industry Volume (K Tons) Forecast, by Application 2020 & 2033
- Table 15: India Calcined Petroleum Coke Industry Revenue (Billion) Forecast, by Application 2020 & 2033
- Table 16: India Calcined Petroleum Coke Industry Volume (K Tons) Forecast, by Application 2020 & 2033
- Table 17: Japan Calcined Petroleum Coke Industry Revenue (Billion) Forecast, by Application 2020 & 2033
- Table 18: Japan Calcined Petroleum Coke Industry Volume (K Tons) Forecast, by Application 2020 & 2033
- Table 19: South Korea Calcined Petroleum Coke Industry Revenue (Billion) Forecast, by Application 2020 & 2033
- Table 20: South Korea Calcined Petroleum Coke Industry Volume (K Tons) Forecast, by Application 2020 & 2033
- Table 21: ASEAN Countries Calcined Petroleum Coke Industry Revenue (Billion) Forecast, by Application 2020 & 2033
- Table 22: ASEAN Countries Calcined Petroleum Coke Industry Volume (K Tons) Forecast, by Application 2020 & 2033
- Table 23: Rest of Asia Pacific Calcined Petroleum Coke Industry Revenue (Billion) Forecast, by Application 2020 & 2033
- Table 24: Rest of Asia Pacific Calcined Petroleum Coke Industry Volume (K Tons) Forecast, by Application 2020 & 2033
- Table 25: Global Calcined Petroleum Coke Industry Revenue Billion Forecast, by Type 2020 & 2033
- Table 26: Global Calcined Petroleum Coke Industry Volume K Tons Forecast, by Type 2020 & 2033
- Table 27: Global Calcined Petroleum Coke Industry Revenue Billion Forecast, by Application 2020 & 2033
- Table 28: Global Calcined Petroleum Coke Industry Volume K Tons Forecast, by Application 2020 & 2033
- Table 29: Global Calcined Petroleum Coke Industry Revenue Billion Forecast, by Country 2020 & 2033
- Table 30: Global Calcined Petroleum Coke Industry Volume K Tons Forecast, by Country 2020 & 2033
- Table 31: United States Calcined Petroleum Coke Industry Revenue (Billion) Forecast, by Application 2020 & 2033
- Table 32: United States Calcined Petroleum Coke Industry Volume (K Tons) Forecast, by Application 2020 & 2033
- Table 33: Canada Calcined Petroleum Coke Industry Revenue (Billion) Forecast, by Application 2020 & 2033
- Table 34: Canada Calcined Petroleum Coke Industry Volume (K Tons) Forecast, by Application 2020 & 2033
- Table 35: Mexico Calcined Petroleum Coke Industry Revenue (Billion) Forecast, by Application 2020 & 2033
- Table 36: Mexico Calcined Petroleum Coke Industry Volume (K Tons) Forecast, by Application 2020 & 2033
- Table 37: Global Calcined Petroleum Coke Industry Revenue Billion Forecast, by Type 2020 & 2033
- Table 38: Global Calcined Petroleum Coke Industry Volume K Tons Forecast, by Type 2020 & 2033
- Table 39: Global Calcined Petroleum Coke Industry Revenue Billion Forecast, by Application 2020 & 2033
- Table 40: Global Calcined Petroleum Coke Industry Volume K Tons Forecast, by Application 2020 & 2033
- Table 41: Global Calcined Petroleum Coke Industry Revenue Billion Forecast, by Country 2020 & 2033
- Table 42: Global Calcined Petroleum Coke Industry Volume K Tons Forecast, by Country 2020 & 2033
- Table 43: Germany Calcined Petroleum Coke Industry Revenue (Billion) Forecast, by Application 2020 & 2033
- Table 44: Germany Calcined Petroleum Coke Industry Volume (K Tons) Forecast, by Application 2020 & 2033
- Table 45: United Kingdom Calcined Petroleum Coke Industry Revenue (Billion) Forecast, by Application 2020 & 2033
- Table 46: United Kingdom Calcined Petroleum Coke Industry Volume (K Tons) Forecast, by Application 2020 & 2033
- Table 47: Italy Calcined Petroleum Coke Industry Revenue (Billion) Forecast, by Application 2020 & 2033
- Table 48: Italy Calcined Petroleum Coke Industry Volume (K Tons) Forecast, by Application 2020 & 2033
- Table 49: France Calcined Petroleum Coke Industry Revenue (Billion) Forecast, by Application 2020 & 2033
- Table 50: France Calcined Petroleum Coke Industry Volume (K Tons) Forecast, by Application 2020 & 2033
- Table 51: Spain Calcined Petroleum Coke Industry Revenue (Billion) Forecast, by Application 2020 & 2033
- Table 52: Spain Calcined Petroleum Coke Industry Volume (K Tons) Forecast, by Application 2020 & 2033
- Table 53: Rest of Europe Calcined Petroleum Coke Industry Revenue (Billion) Forecast, by Application 2020 & 2033
- Table 54: Rest of Europe Calcined Petroleum Coke Industry Volume (K Tons) Forecast, by Application 2020 & 2033
- Table 55: Global Calcined Petroleum Coke Industry Revenue Billion Forecast, by Type 2020 & 2033
- Table 56: Global Calcined Petroleum Coke Industry Volume K Tons Forecast, by Type 2020 & 2033
- Table 57: Global Calcined Petroleum Coke Industry Revenue Billion Forecast, by Application 2020 & 2033
- Table 58: Global Calcined Petroleum Coke Industry Volume K Tons Forecast, by Application 2020 & 2033
- Table 59: Global Calcined Petroleum Coke Industry Revenue Billion Forecast, by Country 2020 & 2033
- Table 60: Global Calcined Petroleum Coke Industry Volume K Tons Forecast, by Country 2020 & 2033
- Table 61: Brazil Calcined Petroleum Coke Industry Revenue (Billion) Forecast, by Application 2020 & 2033
- Table 62: Brazil Calcined Petroleum Coke Industry Volume (K Tons) Forecast, by Application 2020 & 2033
- Table 63: Argentina Calcined Petroleum Coke Industry Revenue (Billion) Forecast, by Application 2020 & 2033
- Table 64: Argentina Calcined Petroleum Coke Industry Volume (K Tons) Forecast, by Application 2020 & 2033
- Table 65: Rest of South America Calcined Petroleum Coke Industry Revenue (Billion) Forecast, by Application 2020 & 2033
- Table 66: Rest of South America Calcined Petroleum Coke Industry Volume (K Tons) Forecast, by Application 2020 & 2033
- Table 67: Global Calcined Petroleum Coke Industry Revenue Billion Forecast, by Type 2020 & 2033
- Table 68: Global Calcined Petroleum Coke Industry Volume K Tons Forecast, by Type 2020 & 2033
- Table 69: Global Calcined Petroleum Coke Industry Revenue Billion Forecast, by Application 2020 & 2033
- Table 70: Global Calcined Petroleum Coke Industry Volume K Tons Forecast, by Application 2020 & 2033
- Table 71: Global Calcined Petroleum Coke Industry Revenue Billion Forecast, by Country 2020 & 2033
- Table 72: Global Calcined Petroleum Coke Industry Volume K Tons Forecast, by Country 2020 & 2033
- Table 73: Saudi Arabia Calcined Petroleum Coke Industry Revenue (Billion) Forecast, by Application 2020 & 2033
- Table 74: Saudi Arabia Calcined Petroleum Coke Industry Volume (K Tons) Forecast, by Application 2020 & 2033
- Table 75: South Africa Calcined Petroleum Coke Industry Revenue (Billion) Forecast, by Application 2020 & 2033
- Table 76: South Africa Calcined Petroleum Coke Industry Volume (K Tons) Forecast, by Application 2020 & 2033
- Table 77: Rest of Middle East and Africa Calcined Petroleum Coke Industry Revenue (Billion) Forecast, by Application 2020 & 2033
- Table 78: Rest of Middle East and Africa Calcined Petroleum Coke Industry Volume (K Tons) Forecast, by Application 2020 & 2033
Frequently Asked Questions
1. What is the projected Compound Annual Growth Rate (CAGR) of the Calcined Petroleum Coke Industry?
The projected CAGR is approximately 5.45%.
2. Which companies are prominent players in the Calcined Petroleum Coke Industry?
Key companies in the market include Oxbow Corporation, Petrocoque, Zhenjiang Coking And Gas Group Co Ltd, CNOOC Limited, Rain Carbon Inc, Aluminium Bahrain B S C (Alba), Rio Tinto, Numaligarh Refinery Limited, Phillips 66 Company, Maniayargroup, Saudi Calcined Petroleum Coke Company (SCPC), BP PLC, ELSID SA.
3. What are the main segments of the Calcined Petroleum Coke Industry?
The market segments include Type, Application.
4. Can you provide details about the market size?
The market size is estimated to be USD 1.15 Billion as of 2022.
5. What are some drivers contributing to market growth?
Increasing Demand from Aluminum Applications; Other Drivers.
6. What are the notable trends driving market growth?
Aluminium Segment to Drive the Market Growth.
7. Are there any restraints impacting market growth?
Fluctuating Prices for Raw Materials; Other Restraints.
8. Can you provide examples of recent developments in the market?
January 2023: Phillips 66 and DCP Midstream, LP announced a definitive agreement under which Phillips 66 will acquire all publicly traded standard units representing limited partner interests in DCP Midstream for cash consideration of USD 41.75 per standard unit, increasing its economic interest in DCP Midstream to 86.8%. It will strengthen the corporation and, in specific ways, boost the market productivity of petroleum coke.
9. What pricing options are available for accessing the report?
Pricing options include single-user, multi-user, and enterprise licenses priced at USD 4750, USD 5250, and USD 8750 respectively.
10. Is the market size provided in terms of value or volume?
The market size is provided in terms of value, measured in Billion and volume, measured in K Tons.
11. Are there any specific market keywords associated with the report?
Yes, the market keyword associated with the report is "Calcined Petroleum Coke Industry," which aids in identifying and referencing the specific market segment covered.
12. How do I determine which pricing option suits my needs best?
The pricing options vary based on user requirements and access needs. Individual users may opt for single-user licenses, while businesses requiring broader access may choose multi-user or enterprise licenses for cost-effective access to the report.
13. Are there any additional resources or data provided in the Calcined Petroleum Coke Industry report?
While the report offers comprehensive insights, it's advisable to review the specific contents or supplementary materials provided to ascertain if additional resources or data are available.
14. How can I stay updated on further developments or reports in the Calcined Petroleum Coke Industry?
To stay informed about further developments, trends, and reports in the Calcined Petroleum Coke Industry, consider subscribing to industry newsletters, following relevant companies and organizations, or regularly checking reputable industry news sources and publications.
Methodology
Step 1 - Identification of Relevant Samples Size from Population Database


Step 2 - Approaches for Defining Global Market Size (Value, Volume* & Price*)

Note*: In applicable scenarios
Step 3 - Data Sources
Primary Research
- Web Analytics
- Survey Reports
- Research Institute
- Latest Research Reports
- Opinion Leaders
Secondary Research
- Annual Reports
- White Paper
- Latest Press Release
- Industry Association
- Paid Database
- Investor Presentations

Step 4 - Data Triangulation
Involves using different sources of information in order to increase the validity of a study
These sources are likely to be stakeholders in a program - participants, other researchers, program staff, other community members, and so on.
Then we put all data in single framework & apply various statistical tools to find out the dynamic on the market.
During the analysis stage, feedback from the stakeholder groups would be compared to determine areas of agreement as well as areas of divergence