

Key Insights
The global calcium peroxide market, valued at $2.36 billion in 2025, is projected to experience steady growth, driven by its diverse applications across various industries. A compound annual growth rate (CAGR) of 3.64% from 2025 to 2033 indicates a promising outlook, fueled by increasing demand in the food and beverage, agriculture, and pharmaceutical sectors. The food grade segment is a significant contributor, owing to its use as a bleaching agent and dough conditioner in food processing. Simultaneously, the rising adoption of calcium peroxide as a seed disinfectant in agriculture is expected to boost market expansion. The industrial applications, encompassing uses as an oxidizing agent and intermediary chemical in various manufacturing processes, further contribute to market growth. While specific restraint data is unavailable, potential challenges might include price volatility of raw materials, stringent regulatory approvals for certain applications, and the emergence of alternative bleaching and disinfecting agents. Geographic distribution shows a strong presence across North America and Europe, with Asia-Pacific exhibiting significant growth potential due to increasing industrialization and agricultural activities in developing economies. Key players, including Nikunj Chemicals, Pioneer Enterprise, and Carus Group Inc., are strategically investing in research and development and expanding their geographic reach to capture market share.
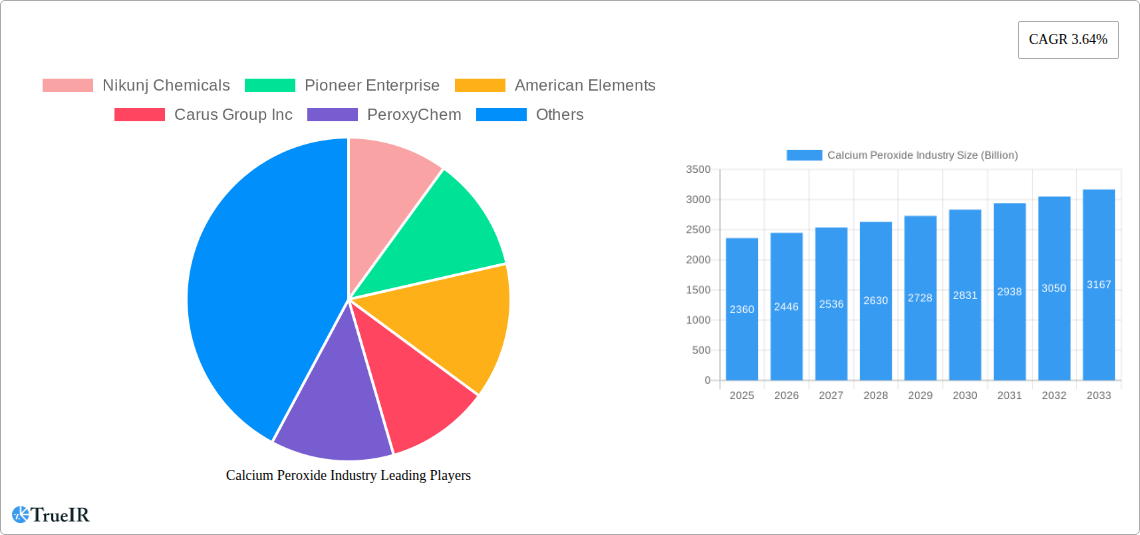
Calcium Peroxide Industry Market Size (In Billion)
The market's future trajectory hinges on several factors. Continued innovation in calcium peroxide production techniques to enhance efficiency and reduce costs will be crucial. Furthermore, growing awareness of environmentally friendly alternatives and the increasing regulatory scrutiny on chemical usage will shape the market’s landscape. Market players are likely to focus on developing sustainable and eco-friendly calcium peroxide production processes to address these concerns. The expansion of applications into newer sectors, such as water treatment and environmental remediation, could also unlock further growth opportunities. A robust supply chain, coupled with targeted marketing strategies, will be pivotal in securing market dominance and capitalizing on the positive market forecasts.

Calcium Peroxide Industry Company Market Share
Calcium Peroxide Industry Market Report: 2019-2033
This comprehensive report provides an in-depth analysis of the global Calcium Peroxide industry, offering invaluable insights for stakeholders seeking to understand market dynamics, competitive landscapes, and future growth opportunities. With a study period spanning 2019-2033, a base year of 2025, and a forecast period of 2025-2033, this report leverages extensive data analysis to project a market valued at over $XX Billion by 2033. This report is essential for businesses involved in the production, distribution, or application of calcium peroxide across diverse sectors.
Calcium Peroxide Industry Market Structure & Competitive Landscape
The global Calcium Peroxide market is moderately concentrated, with key players such as Carus Group Inc, Solvay SA, and PeroxyChem holding significant market share. However, the presence of several regional and smaller players indicates a dynamic competitive landscape. The market structure is influenced by factors such as economies of scale, technological innovation, and regulatory compliance. Innovation drives competitiveness, with companies focusing on developing higher-purity grades and specialized applications. Stringent regulatory frameworks governing chemical production and usage impact operational costs and market entry barriers. Product substitution, primarily from alternative bleaching agents and oxidizing agents, presents a challenge. M&A activity in the Calcium Peroxide industry has been moderate over the past five years, with a total estimated value of $XX Billion in deals. End-user segmentation is diverse, with significant contributions from the food and beverage, agriculture, and pharmaceutical sectors.
- Market Concentration: XX% held by top 5 players (estimated).
- Innovation Drivers: Development of higher-purity grades, tailored applications for niche markets.
- Regulatory Impacts: Stringent safety and environmental regulations impacting manufacturing costs.
- Product Substitutes: Competition from alternative bleaching agents and oxidizing agents.
- End-User Segmentation: Significant contributions from Food & Beverage, Agriculture, and Pharmaceuticals.
- M&A Trends: Moderate activity, with an estimated $XX Billion in deals from 2019-2024.
Calcium Peroxide Industry Market Trends & Opportunities
The global Calcium Peroxide market is poised for substantial growth, with a projected CAGR of XX% during the forecast period (2025-2033). This growth is fueled by rising demand across various end-use industries, particularly in agriculture (seed treatment and soil improvement) and the food and beverage sector (dough conditioning and bleaching). Technological advancements in production processes are enhancing efficiency and reducing costs, leading to increased market penetration. Consumer preference for natural and sustainable products is driving demand for calcium peroxide as a safe and eco-friendly alternative to other chemical agents. The competitive landscape is characterized by both intense rivalry among established players and the emergence of new entrants, stimulating innovation and product differentiation. Market penetration rates vary across different regions and applications, with higher penetration in developed economies compared to developing regions. Further growth is expected from advancements in packaging, extending shelf life and facilitating handling. The increasing adoption of advanced farming techniques and the growing demand for sustainable food and pharmaceutical products will further propel the market growth. The development of new applications in niche industries will also create opportunities for market expansion.
Dominant Markets & Segments in Calcium Peroxide Industry
The Asia Pacific region is currently the dominant market for calcium peroxide, driven by robust growth in the agricultural and food & beverage sectors within countries like China and India. Within the product segments, industrial grade calcium peroxide holds the largest market share due to its widespread use across various applications. The seed disinfectant application segment demonstrates high growth potential due to the increasing focus on improving crop yields and disease control.
- Key Growth Drivers (Asia Pacific): Rapid industrialization, rising agricultural output, expanding food & beverage sector.
- Key Growth Drivers (Industrial Grade): Cost-effectiveness, versatile applications across multiple sectors.
- Key Growth Drivers (Seed Disinfectant): Increasing adoption of improved farming practices, focus on crop yield enhancement.
The European and North American markets are mature but still display steady growth, driven by increased demand from the pharmaceutical and food processing industries, respectively. The industrial-grade segment is consistently dominant because of its widespread use in various applications, including pulp bleaching, mining, and wastewater treatment.
Calcium Peroxide Industry Product Analysis
Calcium peroxide is available in various grades (food, industrial) and forms (powder, granules), catering to diverse applications. Recent innovations focus on improving particle size distribution for enhanced reactivity and solubility, leading to better performance in specific applications. The development of formulations with controlled release properties is also gaining traction, enhancing the efficiency and efficacy of calcium peroxide in specific applications. Key competitive advantages lie in achieving high purity, consistent product quality, and reliable supply chain management.
Key Drivers, Barriers & Challenges in Calcium Peroxide Industry
Key Drivers: Increasing demand from food and beverage industries for safe and effective bleaching agents and dough conditioners. Rising agricultural practices requiring eco-friendly seed disinfectants. Technological advancements enhancing production efficiency and lowering costs. Supportive government policies promoting sustainable agriculture.
Challenges: Stringent regulatory requirements for chemical handling and disposal, potentially increasing production costs. Fluctuations in raw material prices (e.g., hydrogen peroxide) affecting production costs. Intense competition from alternative bleaching and oxidizing agents impacting market share. Supply chain disruptions potentially impacting availability and pricing.
Growth Drivers in the Calcium Peroxide Industry Market
The growth of the Calcium Peroxide industry is primarily driven by the increasing demand for food-grade calcium peroxide in the food and beverage industry, particularly in baking and food preservation applications. The growth of the agriculture sector and the rising need for eco-friendly seed disinfectants and soil conditioners are also major drivers. Additionally, technological advancements in production methods have significantly reduced costs and increased efficiency, boosting market growth. Government regulations and initiatives promoting sustainable agricultural practices are also contributing factors.
Challenges Impacting Calcium Peroxide Industry Growth
The Calcium Peroxide industry faces challenges such as stringent regulatory norms around the handling and disposal of chemicals, which increases production costs. Price fluctuations of hydrogen peroxide, a key raw material, also influence production expenses. Intense competition from other bleaching and oxidizing agents impacts market share. Supply chain vulnerabilities can lead to disruptions and affect both availability and pricing.
Key Players Shaping the Calcium Peroxide Industry Market
- Carus Group Inc
- Solvay SA
- PeroxyChem
- Nikunj Chemicals
- Pioneer Enterprise
- American Elements
- Sunway Lab
- Zhengzhou Huize Biochemical Technology Co Ltd
- Mahalaxmi Enterprise
- Shangyu Jie Hua Chemical Co
- STP Chem Solutions Co Ltd
- Noshly Pty Ltd
Significant Calcium Peroxide Industry Milestones
- 2021: Carus Group Inc. announces expansion of its calcium peroxide production facility.
- 2022: Solvay SA launches a new, high-purity grade of calcium peroxide for the pharmaceutical industry.
- 2023: A significant merger between two smaller calcium peroxide producers in the APAC region is announced. (Specific details unavailable - further research required)
Future Outlook for Calcium Peroxide Industry Market
The Calcium Peroxide market is projected to experience robust growth, driven by the increasing demand across diverse industries and the development of new applications. The focus on sustainable and eco-friendly solutions will further fuel market expansion. Strategic investments in research and development, along with effective supply chain management, will be crucial for companies to capitalize on emerging opportunities and maintain competitiveness. Expansion into emerging markets will present significant potential for growth.
Calcium Peroxide Industry Segmentation
-
1. Grade
- 1.1. Food
- 1.2. Industrial
-
2. Application
- 2.1. Seed Disinfectant
- 2.2. Bleaching Agent
- 2.3. Dough Conditioner
- 2.4. Oxidizing Agent
- 2.5. Intermediary Chemicals
- 2.6. Other Applications
-
3. End-user Industry
- 3.1. Food and Beverages
- 3.2. Agriculture
- 3.3. Mining
- 3.4. Pharmaceuticals
- 3.5. Paper and Pulp
- 3.6. Other End-user Industries
Calcium Peroxide Industry Segmentation By Geography
-
1. Asia Pacific
- 1.1. China
- 1.2. India
- 1.3. Japan
- 1.4. South Korea
- 1.5. Rest of Asia Pacific
-
2. North America
- 2.1. United States
- 2.2. Canada
- 2.3. Mexico
-
3. Europe
- 3.1. Germany
- 3.2. United Kingdom
- 3.3. Italy
- 3.4. France
- 3.5. Rest of Europe
-
4. South America
- 4.1. Brazil
- 4.2. Argentina
- 4.3. Rest of South America
-
5. Middle East and Africa
- 5.1. Saudi Arabia
- 5.2. South Africa
- 5.3. Rest of Middle East and Africa
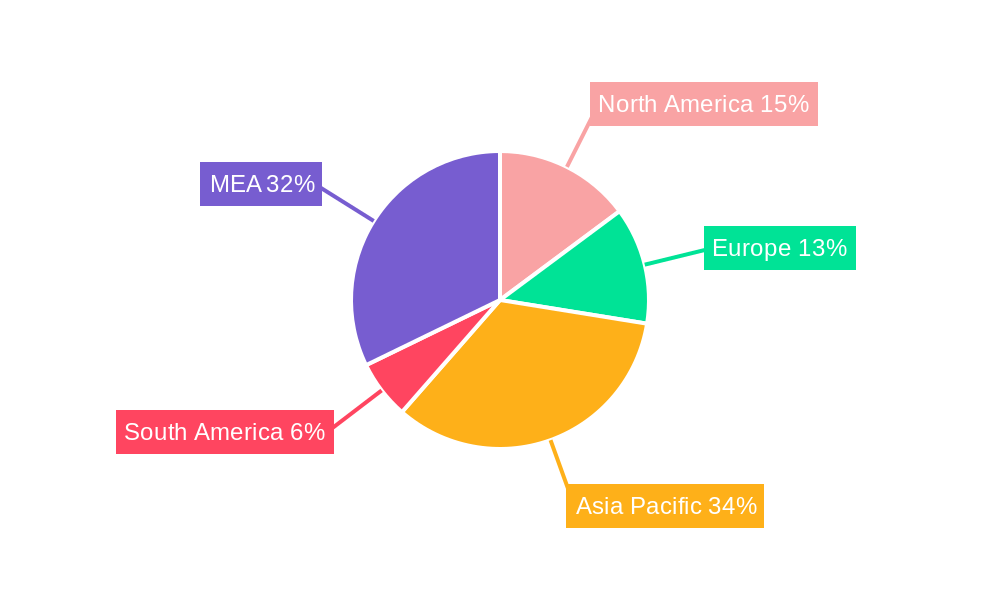
Calcium Peroxide Industry Regional Market Share
Geographic Coverage of Calcium Peroxide Industry
Calcium Peroxide Industry REPORT HIGHLIGHTS
| Aspects | Details |
|---|---|
| Study Period | 2020-2034 |
| Base Year | 2025 |
| Estimated Year | 2026 |
| Forecast Period | 2026-2034 |
| Historical Period | 2020-2025 |
| Growth Rate | CAGR of 3.64% from 2020-2034 |
| Segmentation |
|
Table of Contents
- 1. Introduction
- 1.1. Research Scope
- 1.2. Market Segmentation
- 1.3. Research Objective
- 1.4. Definitions and Assumptions
- 2. Executive Summary
- 2.1. Market Snapshot
- 3. Market Dynamics
- 3.1. Market Drivers
- 3.2. Market Restrains
- 3.3. Market Trends
- 3.4. Market Opportunities
- 4. Market Factor Analysis
- 4.1. Porters Five Forces
- 4.1.1. Bargaining Power of Suppliers
- 4.1.2. Bargaining Power of Buyers
- 4.1.3. Threat of New Entrants
- 4.1.4. Threat of Substitutes
- 4.1.5. Competitive Rivalry
- 4.2. PESTEL analysis
- 4.3. BCG Analysis
- 4.3.1. Stars (High Growth, High Market Share)
- 4.3.2. Cash Cows (Low Growth, High Market Share)
- 4.3.3. Question Mark (High Growth, Low Market Share)
- 4.3.4. Dogs (Low Growth, Low Market Share)
- 4.4. Ansoff Matrix Analysis
- 4.5. Supply Chain Analysis
- 4.6. Regulatory Landscape
- 4.7. Current Market Potential and Opportunity Assessment (TAM–SAM–SOM Framework)
- 4.8. TIR Analyst Note
- 4.1. Porters Five Forces
- 5. Market Analysis, Insights and Forecast 2021-2033
- 5.1. Market Analysis, Insights and Forecast - by Grade
- 5.1.1. Food
- 5.1.2. Industrial
- 5.2. Market Analysis, Insights and Forecast - by Application
- 5.2.1. Seed Disinfectant
- 5.2.2. Bleaching Agent
- 5.2.3. Dough Conditioner
- 5.2.4. Oxidizing Agent
- 5.2.5. Intermediary Chemicals
- 5.2.6. Other Applications
- 5.3. Market Analysis, Insights and Forecast - by End-user Industry
- 5.3.1. Food and Beverages
- 5.3.2. Agriculture
- 5.3.3. Mining
- 5.3.4. Pharmaceuticals
- 5.3.5. Paper and Pulp
- 5.3.6. Other End-user Industries
- 5.4. Market Analysis, Insights and Forecast - by Region
- 5.4.1. Asia Pacific
- 5.4.2. North America
- 5.4.3. Europe
- 5.4.4. South America
- 5.4.5. Middle East and Africa
- 5.1. Market Analysis, Insights and Forecast - by Grade
- 6. Global Calcium Peroxide Industry Analysis, Insights and Forecast, 2021-2033
- 6.1. Market Analysis, Insights and Forecast - by Grade
- 6.1.1. Food
- 6.1.2. Industrial
- 6.2. Market Analysis, Insights and Forecast - by Application
- 6.2.1. Seed Disinfectant
- 6.2.2. Bleaching Agent
- 6.2.3. Dough Conditioner
- 6.2.4. Oxidizing Agent
- 6.2.5. Intermediary Chemicals
- 6.2.6. Other Applications
- 6.3. Market Analysis, Insights and Forecast - by End-user Industry
- 6.3.1. Food and Beverages
- 6.3.2. Agriculture
- 6.3.3. Mining
- 6.3.4. Pharmaceuticals
- 6.3.5. Paper and Pulp
- 6.3.6. Other End-user Industries
- 6.1. Market Analysis, Insights and Forecast - by Grade
- 7. Asia Pacific Calcium Peroxide Industry Analysis, Insights and Forecast, 2020-2032
- 7.1. Market Analysis, Insights and Forecast - by Grade
- 7.1.1. Food
- 7.1.2. Industrial
- 7.2. Market Analysis, Insights and Forecast - by Application
- 7.2.1. Seed Disinfectant
- 7.2.2. Bleaching Agent
- 7.2.3. Dough Conditioner
- 7.2.4. Oxidizing Agent
- 7.2.5. Intermediary Chemicals
- 7.2.6. Other Applications
- 7.3. Market Analysis, Insights and Forecast - by End-user Industry
- 7.3.1. Food and Beverages
- 7.3.2. Agriculture
- 7.3.3. Mining
- 7.3.4. Pharmaceuticals
- 7.3.5. Paper and Pulp
- 7.3.6. Other End-user Industries
- 7.1. Market Analysis, Insights and Forecast - by Grade
- 8. North America Calcium Peroxide Industry Analysis, Insights and Forecast, 2020-2032
- 8.1. Market Analysis, Insights and Forecast - by Grade
- 8.1.1. Food
- 8.1.2. Industrial
- 8.2. Market Analysis, Insights and Forecast - by Application
- 8.2.1. Seed Disinfectant
- 8.2.2. Bleaching Agent
- 8.2.3. Dough Conditioner
- 8.2.4. Oxidizing Agent
- 8.2.5. Intermediary Chemicals
- 8.2.6. Other Applications
- 8.3. Market Analysis, Insights and Forecast - by End-user Industry
- 8.3.1. Food and Beverages
- 8.3.2. Agriculture
- 8.3.3. Mining
- 8.3.4. Pharmaceuticals
- 8.3.5. Paper and Pulp
- 8.3.6. Other End-user Industries
- 8.1. Market Analysis, Insights and Forecast - by Grade
- 9. Europe Calcium Peroxide Industry Analysis, Insights and Forecast, 2020-2032
- 9.1. Market Analysis, Insights and Forecast - by Grade
- 9.1.1. Food
- 9.1.2. Industrial
- 9.2. Market Analysis, Insights and Forecast - by Application
- 9.2.1. Seed Disinfectant
- 9.2.2. Bleaching Agent
- 9.2.3. Dough Conditioner
- 9.2.4. Oxidizing Agent
- 9.2.5. Intermediary Chemicals
- 9.2.6. Other Applications
- 9.3. Market Analysis, Insights and Forecast - by End-user Industry
- 9.3.1. Food and Beverages
- 9.3.2. Agriculture
- 9.3.3. Mining
- 9.3.4. Pharmaceuticals
- 9.3.5. Paper and Pulp
- 9.3.6. Other End-user Industries
- 9.1. Market Analysis, Insights and Forecast - by Grade
- 10. South America Calcium Peroxide Industry Analysis, Insights and Forecast, 2020-2032
- 10.1. Market Analysis, Insights and Forecast - by Grade
- 10.1.1. Food
- 10.1.2. Industrial
- 10.2. Market Analysis, Insights and Forecast - by Application
- 10.2.1. Seed Disinfectant
- 10.2.2. Bleaching Agent
- 10.2.3. Dough Conditioner
- 10.2.4. Oxidizing Agent
- 10.2.5. Intermediary Chemicals
- 10.2.6. Other Applications
- 10.3. Market Analysis, Insights and Forecast - by End-user Industry
- 10.3.1. Food and Beverages
- 10.3.2. Agriculture
- 10.3.3. Mining
- 10.3.4. Pharmaceuticals
- 10.3.5. Paper and Pulp
- 10.3.6. Other End-user Industries
- 10.1. Market Analysis, Insights and Forecast - by Grade
- 11. Middle East and Africa Calcium Peroxide Industry Analysis, Insights and Forecast, 2020-2032
- 11.1. Market Analysis, Insights and Forecast - by Grade
- 11.1.1. Food
- 11.1.2. Industrial
- 11.2. Market Analysis, Insights and Forecast - by Application
- 11.2.1. Seed Disinfectant
- 11.2.2. Bleaching Agent
- 11.2.3. Dough Conditioner
- 11.2.4. Oxidizing Agent
- 11.2.5. Intermediary Chemicals
- 11.2.6. Other Applications
- 11.3. Market Analysis, Insights and Forecast - by End-user Industry
- 11.3.1. Food and Beverages
- 11.3.2. Agriculture
- 11.3.3. Mining
- 11.3.4. Pharmaceuticals
- 11.3.5. Paper and Pulp
- 11.3.6. Other End-user Industries
- 11.1. Market Analysis, Insights and Forecast - by Grade
- 12. Competitive Analysis
- 12.1. Company Profiles
- 12.1.1 Nikunj Chemicals
- 12.1.1.1. Company Overview
- 12.1.1.2. Products
- 12.1.1.3. Company Financials
- 12.1.1.4. SWOT Analysis
- 12.1.2 Pioneer Enterprise
- 12.1.2.1. Company Overview
- 12.1.2.2. Products
- 12.1.2.3. Company Financials
- 12.1.2.4. SWOT Analysis
- 12.1.3 American Elements
- 12.1.3.1. Company Overview
- 12.1.3.2. Products
- 12.1.3.3. Company Financials
- 12.1.3.4. SWOT Analysis
- 12.1.4 Carus Group Inc
- 12.1.4.1. Company Overview
- 12.1.4.2. Products
- 12.1.4.3. Company Financials
- 12.1.4.4. SWOT Analysis
- 12.1.5 PeroxyChem
- 12.1.5.1. Company Overview
- 12.1.5.2. Products
- 12.1.5.3. Company Financials
- 12.1.5.4. SWOT Analysis
- 12.1.6 Sunway Lab
- 12.1.6.1. Company Overview
- 12.1.6.2. Products
- 12.1.6.3. Company Financials
- 12.1.6.4. SWOT Analysis
- 12.1.7 Zhengzhou Huize Biochemical Technology Co Ltd
- 12.1.7.1. Company Overview
- 12.1.7.2. Products
- 12.1.7.3. Company Financials
- 12.1.7.4. SWOT Analysis
- 12.1.8 Solvay SA
- 12.1.8.1. Company Overview
- 12.1.8.2. Products
- 12.1.8.3. Company Financials
- 12.1.8.4. SWOT Analysis
- 12.1.9 Mahalaxmi Enterprise
- 12.1.9.1. Company Overview
- 12.1.9.2. Products
- 12.1.9.3. Company Financials
- 12.1.9.4. SWOT Analysis
- 12.1.10 Shangyu Jie Hua Chemical Co
- 12.1.10.1. Company Overview
- 12.1.10.2. Products
- 12.1.10.3. Company Financials
- 12.1.10.4. SWOT Analysis
- 12.1.11 STP Chem Solutions Co Ltd
- 12.1.11.1. Company Overview
- 12.1.11.2. Products
- 12.1.11.3. Company Financials
- 12.1.11.4. SWOT Analysis
- 12.1.12 Noshly Pty Ltd
- 12.1.12.1. Company Overview
- 12.1.12.2. Products
- 12.1.12.3. Company Financials
- 12.1.12.4. SWOT Analysis
- 12.1.1 Nikunj Chemicals
- 12.2. Market Entropy
- 12.2.1 Company's Key Areas Served
- 12.2.2 Recent Developments
- 12.3. Company Market Share Analysis 2025
- 12.3.1 Top 5 Companies Market Share Analysis
- 12.3.2 Top 3 Companies Market Share Analysis
- 12.4. List of Potential Customers
- 13. Research Methodology
List of Figures
- Figure 1: Global Calcium Peroxide Industry Revenue Breakdown (Billion, %) by Region 2025 & 2033
- Figure 2: Global Calcium Peroxide Industry Volume Breakdown (K Tons, %) by Region 2025 & 2033
- Figure 3: Asia Pacific Calcium Peroxide Industry Revenue (Billion), by Grade 2025 & 2033
- Figure 4: Asia Pacific Calcium Peroxide Industry Volume (K Tons), by Grade 2025 & 2033
- Figure 5: Asia Pacific Calcium Peroxide Industry Revenue Share (%), by Grade 2025 & 2033
- Figure 6: Asia Pacific Calcium Peroxide Industry Volume Share (%), by Grade 2025 & 2033
- Figure 7: Asia Pacific Calcium Peroxide Industry Revenue (Billion), by Application 2025 & 2033
- Figure 8: Asia Pacific Calcium Peroxide Industry Volume (K Tons), by Application 2025 & 2033
- Figure 9: Asia Pacific Calcium Peroxide Industry Revenue Share (%), by Application 2025 & 2033
- Figure 10: Asia Pacific Calcium Peroxide Industry Volume Share (%), by Application 2025 & 2033
- Figure 11: Asia Pacific Calcium Peroxide Industry Revenue (Billion), by End-user Industry 2025 & 2033
- Figure 12: Asia Pacific Calcium Peroxide Industry Volume (K Tons), by End-user Industry 2025 & 2033
- Figure 13: Asia Pacific Calcium Peroxide Industry Revenue Share (%), by End-user Industry 2025 & 2033
- Figure 14: Asia Pacific Calcium Peroxide Industry Volume Share (%), by End-user Industry 2025 & 2033
- Figure 15: Asia Pacific Calcium Peroxide Industry Revenue (Billion), by Country 2025 & 2033
- Figure 16: Asia Pacific Calcium Peroxide Industry Volume (K Tons), by Country 2025 & 2033
- Figure 17: Asia Pacific Calcium Peroxide Industry Revenue Share (%), by Country 2025 & 2033
- Figure 18: Asia Pacific Calcium Peroxide Industry Volume Share (%), by Country 2025 & 2033
- Figure 19: North America Calcium Peroxide Industry Revenue (Billion), by Grade 2025 & 2033
- Figure 20: North America Calcium Peroxide Industry Volume (K Tons), by Grade 2025 & 2033
- Figure 21: North America Calcium Peroxide Industry Revenue Share (%), by Grade 2025 & 2033
- Figure 22: North America Calcium Peroxide Industry Volume Share (%), by Grade 2025 & 2033
- Figure 23: North America Calcium Peroxide Industry Revenue (Billion), by Application 2025 & 2033
- Figure 24: North America Calcium Peroxide Industry Volume (K Tons), by Application 2025 & 2033
- Figure 25: North America Calcium Peroxide Industry Revenue Share (%), by Application 2025 & 2033
- Figure 26: North America Calcium Peroxide Industry Volume Share (%), by Application 2025 & 2033
- Figure 27: North America Calcium Peroxide Industry Revenue (Billion), by End-user Industry 2025 & 2033
- Figure 28: North America Calcium Peroxide Industry Volume (K Tons), by End-user Industry 2025 & 2033
- Figure 29: North America Calcium Peroxide Industry Revenue Share (%), by End-user Industry 2025 & 2033
- Figure 30: North America Calcium Peroxide Industry Volume Share (%), by End-user Industry 2025 & 2033
- Figure 31: North America Calcium Peroxide Industry Revenue (Billion), by Country 2025 & 2033
- Figure 32: North America Calcium Peroxide Industry Volume (K Tons), by Country 2025 & 2033
- Figure 33: North America Calcium Peroxide Industry Revenue Share (%), by Country 2025 & 2033
- Figure 34: North America Calcium Peroxide Industry Volume Share (%), by Country 2025 & 2033
- Figure 35: Europe Calcium Peroxide Industry Revenue (Billion), by Grade 2025 & 2033
- Figure 36: Europe Calcium Peroxide Industry Volume (K Tons), by Grade 2025 & 2033
- Figure 37: Europe Calcium Peroxide Industry Revenue Share (%), by Grade 2025 & 2033
- Figure 38: Europe Calcium Peroxide Industry Volume Share (%), by Grade 2025 & 2033
- Figure 39: Europe Calcium Peroxide Industry Revenue (Billion), by Application 2025 & 2033
- Figure 40: Europe Calcium Peroxide Industry Volume (K Tons), by Application 2025 & 2033
- Figure 41: Europe Calcium Peroxide Industry Revenue Share (%), by Application 2025 & 2033
- Figure 42: Europe Calcium Peroxide Industry Volume Share (%), by Application 2025 & 2033
- Figure 43: Europe Calcium Peroxide Industry Revenue (Billion), by End-user Industry 2025 & 2033
- Figure 44: Europe Calcium Peroxide Industry Volume (K Tons), by End-user Industry 2025 & 2033
- Figure 45: Europe Calcium Peroxide Industry Revenue Share (%), by End-user Industry 2025 & 2033
- Figure 46: Europe Calcium Peroxide Industry Volume Share (%), by End-user Industry 2025 & 2033
- Figure 47: Europe Calcium Peroxide Industry Revenue (Billion), by Country 2025 & 2033
- Figure 48: Europe Calcium Peroxide Industry Volume (K Tons), by Country 2025 & 2033
- Figure 49: Europe Calcium Peroxide Industry Revenue Share (%), by Country 2025 & 2033
- Figure 50: Europe Calcium Peroxide Industry Volume Share (%), by Country 2025 & 2033
- Figure 51: South America Calcium Peroxide Industry Revenue (Billion), by Grade 2025 & 2033
- Figure 52: South America Calcium Peroxide Industry Volume (K Tons), by Grade 2025 & 2033
- Figure 53: South America Calcium Peroxide Industry Revenue Share (%), by Grade 2025 & 2033
- Figure 54: South America Calcium Peroxide Industry Volume Share (%), by Grade 2025 & 2033
- Figure 55: South America Calcium Peroxide Industry Revenue (Billion), by Application 2025 & 2033
- Figure 56: South America Calcium Peroxide Industry Volume (K Tons), by Application 2025 & 2033
- Figure 57: South America Calcium Peroxide Industry Revenue Share (%), by Application 2025 & 2033
- Figure 58: South America Calcium Peroxide Industry Volume Share (%), by Application 2025 & 2033
- Figure 59: South America Calcium Peroxide Industry Revenue (Billion), by End-user Industry 2025 & 2033
- Figure 60: South America Calcium Peroxide Industry Volume (K Tons), by End-user Industry 2025 & 2033
- Figure 61: South America Calcium Peroxide Industry Revenue Share (%), by End-user Industry 2025 & 2033
- Figure 62: South America Calcium Peroxide Industry Volume Share (%), by End-user Industry 2025 & 2033
- Figure 63: South America Calcium Peroxide Industry Revenue (Billion), by Country 2025 & 2033
- Figure 64: South America Calcium Peroxide Industry Volume (K Tons), by Country 2025 & 2033
- Figure 65: South America Calcium Peroxide Industry Revenue Share (%), by Country 2025 & 2033
- Figure 66: South America Calcium Peroxide Industry Volume Share (%), by Country 2025 & 2033
- Figure 67: Middle East and Africa Calcium Peroxide Industry Revenue (Billion), by Grade 2025 & 2033
- Figure 68: Middle East and Africa Calcium Peroxide Industry Volume (K Tons), by Grade 2025 & 2033
- Figure 69: Middle East and Africa Calcium Peroxide Industry Revenue Share (%), by Grade 2025 & 2033
- Figure 70: Middle East and Africa Calcium Peroxide Industry Volume Share (%), by Grade 2025 & 2033
- Figure 71: Middle East and Africa Calcium Peroxide Industry Revenue (Billion), by Application 2025 & 2033
- Figure 72: Middle East and Africa Calcium Peroxide Industry Volume (K Tons), by Application 2025 & 2033
- Figure 73: Middle East and Africa Calcium Peroxide Industry Revenue Share (%), by Application 2025 & 2033
- Figure 74: Middle East and Africa Calcium Peroxide Industry Volume Share (%), by Application 2025 & 2033
- Figure 75: Middle East and Africa Calcium Peroxide Industry Revenue (Billion), by End-user Industry 2025 & 2033
- Figure 76: Middle East and Africa Calcium Peroxide Industry Volume (K Tons), by End-user Industry 2025 & 2033
- Figure 77: Middle East and Africa Calcium Peroxide Industry Revenue Share (%), by End-user Industry 2025 & 2033
- Figure 78: Middle East and Africa Calcium Peroxide Industry Volume Share (%), by End-user Industry 2025 & 2033
- Figure 79: Middle East and Africa Calcium Peroxide Industry Revenue (Billion), by Country 2025 & 2033
- Figure 80: Middle East and Africa Calcium Peroxide Industry Volume (K Tons), by Country 2025 & 2033
- Figure 81: Middle East and Africa Calcium Peroxide Industry Revenue Share (%), by Country 2025 & 2033
- Figure 82: Middle East and Africa Calcium Peroxide Industry Volume Share (%), by Country 2025 & 2033
List of Tables
- Table 1: Global Calcium Peroxide Industry Revenue Billion Forecast, by Grade 2020 & 2033
- Table 2: Global Calcium Peroxide Industry Volume K Tons Forecast, by Grade 2020 & 2033
- Table 3: Global Calcium Peroxide Industry Revenue Billion Forecast, by Application 2020 & 2033
- Table 4: Global Calcium Peroxide Industry Volume K Tons Forecast, by Application 2020 & 2033
- Table 5: Global Calcium Peroxide Industry Revenue Billion Forecast, by End-user Industry 2020 & 2033
- Table 6: Global Calcium Peroxide Industry Volume K Tons Forecast, by End-user Industry 2020 & 2033
- Table 7: Global Calcium Peroxide Industry Revenue Billion Forecast, by Region 2020 & 2033
- Table 8: Global Calcium Peroxide Industry Volume K Tons Forecast, by Region 2020 & 2033
- Table 9: Global Calcium Peroxide Industry Revenue Billion Forecast, by Grade 2020 & 2033
- Table 10: Global Calcium Peroxide Industry Volume K Tons Forecast, by Grade 2020 & 2033
- Table 11: Global Calcium Peroxide Industry Revenue Billion Forecast, by Application 2020 & 2033
- Table 12: Global Calcium Peroxide Industry Volume K Tons Forecast, by Application 2020 & 2033
- Table 13: Global Calcium Peroxide Industry Revenue Billion Forecast, by End-user Industry 2020 & 2033
- Table 14: Global Calcium Peroxide Industry Volume K Tons Forecast, by End-user Industry 2020 & 2033
- Table 15: Global Calcium Peroxide Industry Revenue Billion Forecast, by Country 2020 & 2033
- Table 16: Global Calcium Peroxide Industry Volume K Tons Forecast, by Country 2020 & 2033
- Table 17: China Calcium Peroxide Industry Revenue (Billion) Forecast, by Application 2020 & 2033
- Table 18: China Calcium Peroxide Industry Volume (K Tons) Forecast, by Application 2020 & 2033
- Table 19: India Calcium Peroxide Industry Revenue (Billion) Forecast, by Application 2020 & 2033
- Table 20: India Calcium Peroxide Industry Volume (K Tons) Forecast, by Application 2020 & 2033
- Table 21: Japan Calcium Peroxide Industry Revenue (Billion) Forecast, by Application 2020 & 2033
- Table 22: Japan Calcium Peroxide Industry Volume (K Tons) Forecast, by Application 2020 & 2033
- Table 23: South Korea Calcium Peroxide Industry Revenue (Billion) Forecast, by Application 2020 & 2033
- Table 24: South Korea Calcium Peroxide Industry Volume (K Tons) Forecast, by Application 2020 & 2033
- Table 25: Rest of Asia Pacific Calcium Peroxide Industry Revenue (Billion) Forecast, by Application 2020 & 2033
- Table 26: Rest of Asia Pacific Calcium Peroxide Industry Volume (K Tons) Forecast, by Application 2020 & 2033
- Table 27: Global Calcium Peroxide Industry Revenue Billion Forecast, by Grade 2020 & 2033
- Table 28: Global Calcium Peroxide Industry Volume K Tons Forecast, by Grade 2020 & 2033
- Table 29: Global Calcium Peroxide Industry Revenue Billion Forecast, by Application 2020 & 2033
- Table 30: Global Calcium Peroxide Industry Volume K Tons Forecast, by Application 2020 & 2033
- Table 31: Global Calcium Peroxide Industry Revenue Billion Forecast, by End-user Industry 2020 & 2033
- Table 32: Global Calcium Peroxide Industry Volume K Tons Forecast, by End-user Industry 2020 & 2033
- Table 33: Global Calcium Peroxide Industry Revenue Billion Forecast, by Country 2020 & 2033
- Table 34: Global Calcium Peroxide Industry Volume K Tons Forecast, by Country 2020 & 2033
- Table 35: United States Calcium Peroxide Industry Revenue (Billion) Forecast, by Application 2020 & 2033
- Table 36: United States Calcium Peroxide Industry Volume (K Tons) Forecast, by Application 2020 & 2033
- Table 37: Canada Calcium Peroxide Industry Revenue (Billion) Forecast, by Application 2020 & 2033
- Table 38: Canada Calcium Peroxide Industry Volume (K Tons) Forecast, by Application 2020 & 2033
- Table 39: Mexico Calcium Peroxide Industry Revenue (Billion) Forecast, by Application 2020 & 2033
- Table 40: Mexico Calcium Peroxide Industry Volume (K Tons) Forecast, by Application 2020 & 2033
- Table 41: Global Calcium Peroxide Industry Revenue Billion Forecast, by Grade 2020 & 2033
- Table 42: Global Calcium Peroxide Industry Volume K Tons Forecast, by Grade 2020 & 2033
- Table 43: Global Calcium Peroxide Industry Revenue Billion Forecast, by Application 2020 & 2033
- Table 44: Global Calcium Peroxide Industry Volume K Tons Forecast, by Application 2020 & 2033
- Table 45: Global Calcium Peroxide Industry Revenue Billion Forecast, by End-user Industry 2020 & 2033
- Table 46: Global Calcium Peroxide Industry Volume K Tons Forecast, by End-user Industry 2020 & 2033
- Table 47: Global Calcium Peroxide Industry Revenue Billion Forecast, by Country 2020 & 2033
- Table 48: Global Calcium Peroxide Industry Volume K Tons Forecast, by Country 2020 & 2033
- Table 49: Germany Calcium Peroxide Industry Revenue (Billion) Forecast, by Application 2020 & 2033
- Table 50: Germany Calcium Peroxide Industry Volume (K Tons) Forecast, by Application 2020 & 2033
- Table 51: United Kingdom Calcium Peroxide Industry Revenue (Billion) Forecast, by Application 2020 & 2033
- Table 52: United Kingdom Calcium Peroxide Industry Volume (K Tons) Forecast, by Application 2020 & 2033
- Table 53: Italy Calcium Peroxide Industry Revenue (Billion) Forecast, by Application 2020 & 2033
- Table 54: Italy Calcium Peroxide Industry Volume (K Tons) Forecast, by Application 2020 & 2033
- Table 55: France Calcium Peroxide Industry Revenue (Billion) Forecast, by Application 2020 & 2033
- Table 56: France Calcium Peroxide Industry Volume (K Tons) Forecast, by Application 2020 & 2033
- Table 57: Rest of Europe Calcium Peroxide Industry Revenue (Billion) Forecast, by Application 2020 & 2033
- Table 58: Rest of Europe Calcium Peroxide Industry Volume (K Tons) Forecast, by Application 2020 & 2033
- Table 59: Global Calcium Peroxide Industry Revenue Billion Forecast, by Grade 2020 & 2033
- Table 60: Global Calcium Peroxide Industry Volume K Tons Forecast, by Grade 2020 & 2033
- Table 61: Global Calcium Peroxide Industry Revenue Billion Forecast, by Application 2020 & 2033
- Table 62: Global Calcium Peroxide Industry Volume K Tons Forecast, by Application 2020 & 2033
- Table 63: Global Calcium Peroxide Industry Revenue Billion Forecast, by End-user Industry 2020 & 2033
- Table 64: Global Calcium Peroxide Industry Volume K Tons Forecast, by End-user Industry 2020 & 2033
- Table 65: Global Calcium Peroxide Industry Revenue Billion Forecast, by Country 2020 & 2033
- Table 66: Global Calcium Peroxide Industry Volume K Tons Forecast, by Country 2020 & 2033
- Table 67: Brazil Calcium Peroxide Industry Revenue (Billion) Forecast, by Application 2020 & 2033
- Table 68: Brazil Calcium Peroxide Industry Volume (K Tons) Forecast, by Application 2020 & 2033
- Table 69: Argentina Calcium Peroxide Industry Revenue (Billion) Forecast, by Application 2020 & 2033
- Table 70: Argentina Calcium Peroxide Industry Volume (K Tons) Forecast, by Application 2020 & 2033
- Table 71: Rest of South America Calcium Peroxide Industry Revenue (Billion) Forecast, by Application 2020 & 2033
- Table 72: Rest of South America Calcium Peroxide Industry Volume (K Tons) Forecast, by Application 2020 & 2033
- Table 73: Global Calcium Peroxide Industry Revenue Billion Forecast, by Grade 2020 & 2033
- Table 74: Global Calcium Peroxide Industry Volume K Tons Forecast, by Grade 2020 & 2033
- Table 75: Global Calcium Peroxide Industry Revenue Billion Forecast, by Application 2020 & 2033
- Table 76: Global Calcium Peroxide Industry Volume K Tons Forecast, by Application 2020 & 2033
- Table 77: Global Calcium Peroxide Industry Revenue Billion Forecast, by End-user Industry 2020 & 2033
- Table 78: Global Calcium Peroxide Industry Volume K Tons Forecast, by End-user Industry 2020 & 2033
- Table 79: Global Calcium Peroxide Industry Revenue Billion Forecast, by Country 2020 & 2033
- Table 80: Global Calcium Peroxide Industry Volume K Tons Forecast, by Country 2020 & 2033
- Table 81: Saudi Arabia Calcium Peroxide Industry Revenue (Billion) Forecast, by Application 2020 & 2033
- Table 82: Saudi Arabia Calcium Peroxide Industry Volume (K Tons) Forecast, by Application 2020 & 2033
- Table 83: South Africa Calcium Peroxide Industry Revenue (Billion) Forecast, by Application 2020 & 2033
- Table 84: South Africa Calcium Peroxide Industry Volume (K Tons) Forecast, by Application 2020 & 2033
- Table 85: Rest of Middle East and Africa Calcium Peroxide Industry Revenue (Billion) Forecast, by Application 2020 & 2033
- Table 86: Rest of Middle East and Africa Calcium Peroxide Industry Volume (K Tons) Forecast, by Application 2020 & 2033
Frequently Asked Questions
1. What is the projected Compound Annual Growth Rate (CAGR) of the Calcium Peroxide Industry?
The projected CAGR is approximately 3.64%.
2. Which companies are prominent players in the Calcium Peroxide Industry?
Key companies in the market include Nikunj Chemicals, Pioneer Enterprise, American Elements, Carus Group Inc, PeroxyChem, Sunway Lab, Zhengzhou Huize Biochemical Technology Co Ltd, Solvay SA, Mahalaxmi Enterprise, Shangyu Jie Hua Chemical Co, STP Chem Solutions Co Ltd, Noshly Pty Ltd.
3. What are the main segments of the Calcium Peroxide Industry?
The market segments include Grade, Application, End-user Industry.
4. Can you provide details about the market size?
The market size is estimated to be USD 2.36 Billion as of 2022.
5. What are some drivers contributing to market growth?
; Increase in Utilization as Dough Conditioner in the Food Industry; Increase in Usage in the Oral Care Industry.
6. What are the notable trends driving market growth?
Increasing Demand from Food and Beverage Industry.
7. Are there any restraints impacting market growth?
; Potential Hazardous Effects of Calcium Peroxide.
8. Can you provide examples of recent developments in the market?
N/A
9. What pricing options are available for accessing the report?
Pricing options include single-user, multi-user, and enterprise licenses priced at USD 4750, USD 5250, and USD 8750 respectively.
10. Is the market size provided in terms of value or volume?
The market size is provided in terms of value, measured in Billion and volume, measured in K Tons.
11. Are there any specific market keywords associated with the report?
Yes, the market keyword associated with the report is "Calcium Peroxide Industry," which aids in identifying and referencing the specific market segment covered.
12. How do I determine which pricing option suits my needs best?
The pricing options vary based on user requirements and access needs. Individual users may opt for single-user licenses, while businesses requiring broader access may choose multi-user or enterprise licenses for cost-effective access to the report.
13. Are there any additional resources or data provided in the Calcium Peroxide Industry report?
While the report offers comprehensive insights, it's advisable to review the specific contents or supplementary materials provided to ascertain if additional resources or data are available.
14. How can I stay updated on further developments or reports in the Calcium Peroxide Industry?
To stay informed about further developments, trends, and reports in the Calcium Peroxide Industry, consider subscribing to industry newsletters, following relevant companies and organizations, or regularly checking reputable industry news sources and publications.
Methodology
Step 1 - Identification of Relevant Samples Size from Population Database


Step 2 - Approaches for Defining Global Market Size (Value, Volume* & Price*)

Note*: In applicable scenarios
Step 3 - Data Sources
Primary Research
- Web Analytics
- Survey Reports
- Research Institute
- Latest Research Reports
- Opinion Leaders
Secondary Research
- Annual Reports
- White Paper
- Latest Press Release
- Industry Association
- Paid Database
- Investor Presentations

Step 4 - Data Triangulation
Involves using different sources of information in order to increase the validity of a study
These sources are likely to be stakeholders in a program - participants, other researchers, program staff, other community members, and so on.
Then we put all data in single framework & apply various statistical tools to find out the dynamic on the market.
During the analysis stage, feedback from the stakeholder groups would be compared to determine areas of agreement as well as areas of divergence