

Key Insights
The Ceramic Matrix Composites (CMC) market is experiencing robust growth, driven by increasing demand across diverse sectors. The market's expansion is fueled by several key factors. Firstly, the inherent properties of CMCs—high temperature resistance, excellent strength-to-weight ratio, and superior corrosion resistance—make them ideal for demanding applications in aerospace, automotive, and energy sectors. The aerospace industry, in particular, is a major driver, with CMCs increasingly used in aircraft engines and other high-temperature components to improve fuel efficiency and performance. The automotive industry is also adopting CMCs for brake systems and exhaust components, aiming to enhance durability and reduce emissions. Furthermore, advancements in manufacturing techniques and the development of new CMC materials with improved properties are contributing to market growth. The high initial cost of production remains a significant restraint, but ongoing research and development efforts are focused on reducing manufacturing costs and making CMCs more widely accessible. Given the projected CAGR exceeding 10%, the market is expected to witness substantial expansion in the coming years.
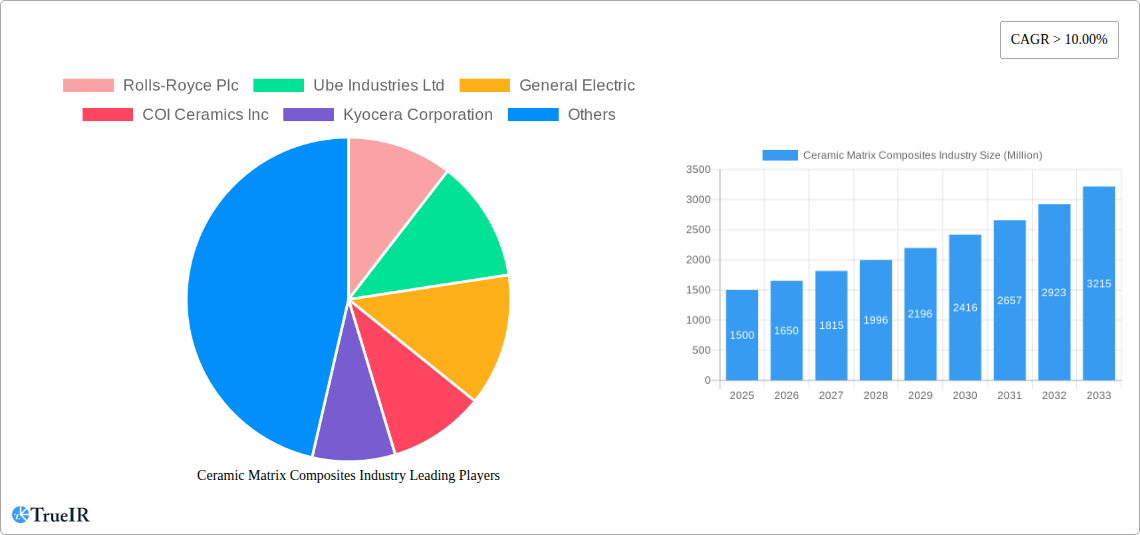
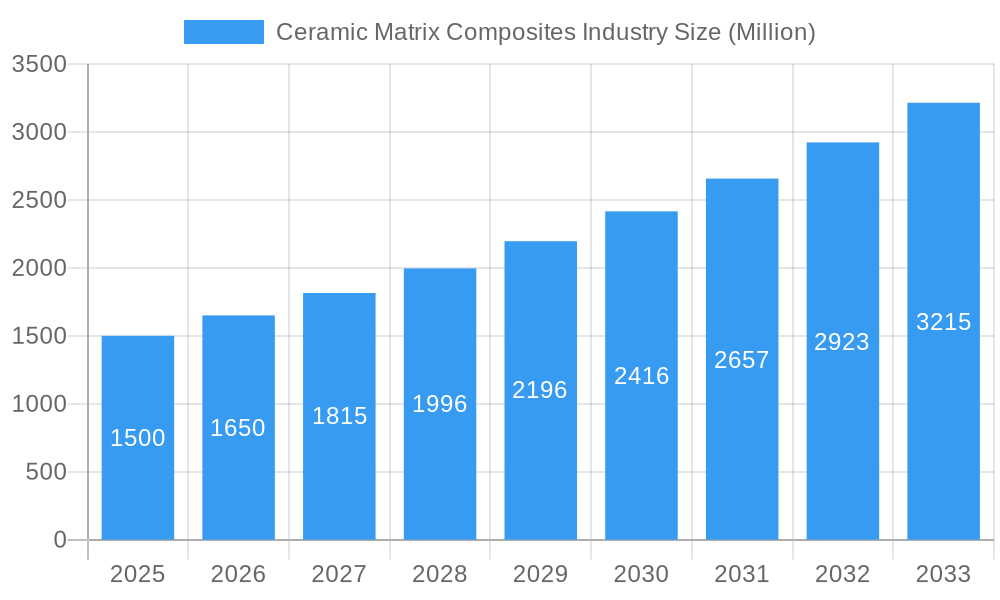
Ceramic Matrix Composites Industry Market Size (In Billion)
The market segmentation reveals a diverse landscape. C/C and C/SiC CMCs are currently dominating the product type segment due to their established applications and relative maturity. However, Oxide/Oxide and SiC/SiC CMCs are gaining traction due to their superior properties in specific applications. Geographically, the Asia-Pacific region, particularly China and Japan, is expected to lead market growth, fueled by substantial investments in infrastructure development and technological advancements within the aerospace and automotive sectors. North America and Europe are also significant markets, with established players and ongoing research activities driving innovation and adoption. The competitive landscape features a mix of established materials companies, aerospace giants, and specialized CMC manufacturers. The industry is witnessing strategic partnerships and collaborations to accelerate innovation and market penetration. Overall, the CMC market is poised for considerable growth, driven by technological advancements, increasing demand from various end-user industries, and favorable government policies supporting the development of advanced materials.
Ceramic Matrix Composites Industry Company Market Share
Ceramic Matrix Composites (CMC) Industry Market Report: 2019-2033
This comprehensive report provides a detailed analysis of the global Ceramic Matrix Composites (CMC) industry, offering invaluable insights for investors, manufacturers, and industry stakeholders. The study period spans 2019-2033, with a base year of 2025 and a forecast period of 2025-2033. The report leverages extensive data analysis to project a robust market growth trajectory, pinpointing key segments and influential players. With a focus on high-impact keywords like "Ceramic Matrix Composites market size," "C/SIC CMC," "Aerospace CMC applications," and more, this report is meticulously crafted for optimal search engine visibility and industry relevance. The report projects a xx Million market value by 2033.
Ceramic Matrix Composites Industry Market Structure & Competitive Landscape
The global Ceramic Matrix Composites (CMC) market is characterized by a moderately consolidated structure, with a few major players holding significant market share. The Herfindahl-Hirschman Index (HHI) is estimated at xx, indicating a moderately concentrated market. Key drivers of innovation include advancements in material science, particularly in high-temperature capabilities and improved durability. Stringent regulatory compliance, particularly in aerospace and defense, shapes industry practices. Product substitutes, such as advanced metal alloys and polymers, pose a competitive challenge, although CMCs maintain a strong advantage in high-temperature applications.
- Market Concentration: HHI estimated at xx.
- Innovation Drivers: Advancements in material science, high-temperature capabilities.
- Regulatory Impacts: Stringent aerospace and defense regulations.
- Product Substitutes: Advanced metal alloys, polymers.
- End-User Segmentation: Dominated by Aerospace, followed by Automotive and Energy.
- M&A Trends: An estimated xx Million in M&A activity from 2019-2024, with a projected increase in the forecast period driven by consolidation efforts within the industry.
Ceramic Matrix Composites Industry Market Trends & Opportunities
The global Ceramic Matrix Composites market is experiencing significant growth, driven by increasing demand across diverse sectors, particularly aerospace and defense. The Compound Annual Growth Rate (CAGR) is projected at xx% during the forecast period (2025-2033), reaching a market size of xx Million by 2033. Technological advancements, like the development of new CMC types with enhanced properties, are key growth catalysts. Consumer preferences for lightweight, high-performance materials in various industries are fueling demand. Competitive dynamics involve continuous improvements in cost-effectiveness and the expansion of applications across industries. Market penetration in emerging sectors, such as renewable energy, is a key growth opportunity.
Dominant Markets & Segments in Ceramic Matrix Composites Industry
The aerospace industry represents the largest end-user segment for CMCs, accounting for approximately xx% of the market share in 2025. This is followed by the automotive and energy sectors. Geographically, North America and Europe currently hold the largest market share, driven by robust aerospace industries and strong government support for advanced material development. However, Asia-Pacific is expected to witness the fastest growth during the forecast period, due to increasing investments in infrastructure and technological advancements.
Key Growth Drivers:
- Aerospace: Demand for lightweight, high-temperature components in aircraft engines and structures.
- Automotive: Increased use in high-performance engine components and brake systems.
- Energy: Applications in advanced gas turbines and nuclear reactors.
- Technological Advancements: Improvements in processing techniques and material properties.
Market Dominance:
North America and Europe currently dominate the market due to established aerospace industries and government funding. However, Asia-Pacific is poised for significant growth driven by infrastructure investments and technological expansion. Within product types, C/SIC and SiC/SiC Ceramic Matrix Composites hold significant market share due to superior performance characteristics.
Ceramic Matrix Composites Industry Product Analysis
Significant advancements in CMC technology are driving market growth. Innovations focus on enhancing mechanical properties, durability at elevated temperatures, and reducing manufacturing costs. New CMC variants demonstrate superior strength, thermal shock resistance, and oxidation resistance, expanding their applicability beyond traditional aerospace to automotive, energy, and electronics sectors. The competitive advantage lies in delivering enhanced performance characteristics while maintaining cost competitiveness compared to traditional materials.
Key Drivers, Barriers & Challenges in Ceramic Matrix Composites Industry
Key Drivers:
- Technological Advancements: Development of novel CMC materials with enhanced performance.
- Government Support: Funding for R&D and deployment across various sectors.
- Increased Demand: Growing adoption in aerospace, automotive, and energy applications.
Challenges and Restraints:
- High Manufacturing Costs: Complex processing techniques contribute to high production costs.
- Limited Scalability: Scaling up manufacturing to meet increasing demand remains a challenge.
- Supply Chain Disruptions: Dependence on raw materials and specialized processing equipment can lead to disruptions. The impact of these disruptions is estimated to have reduced market growth by xx% in 2022.
Growth Drivers in the Ceramic Matrix Composites Industry Market
The industry's growth is fueled by technological advancements, government incentives promoting advanced materials adoption, and strong demand from end-use sectors. The development of high-performance, cost-effective CMCs, coupled with supportive policies from governments globally, is projected to continue driving market expansion in the coming years.
Challenges Impacting Ceramic Matrix Composites Industry Growth
High manufacturing costs and supply chain vulnerabilities are major challenges. The complex processing required for CMCs leads to higher production costs compared to traditional materials. Disruptions in the supply of raw materials and specialized equipment can severely impact production timelines and market availability. Overcoming these cost and supply chain challenges are crucial for sustainable market growth.
Key Players Shaping the Ceramic Matrix Composites Industry Market
- Rolls-Royce Plc
- Ube Industries Ltd
- General Electric
- COI Ceramics Inc
- Kyocera Corporation
- 3M
- Ultramet Inc
- SGL Carbon Company
- CoorsTek Inc
- Lancer Systems LP
- Starfire Systems Inc
- CeramTec
- Applied Thin Films Inc
Significant Ceramic Matrix Composites Industry Industry Milestones
- 2020: Introduction of a new SiC/SiC CMC by Company X with enhanced oxidation resistance.
- 2021: Partnership between Company Y and Company Z to develop a new manufacturing process for C/C CMCs.
- 2022: Successful testing of a CMC component in a commercial aircraft engine by Company A.
- 2023: Investment in a new CMC manufacturing facility by Company B.
Future Outlook for Ceramic Matrix Composites Industry Market
The Ceramic Matrix Composites market is poised for continued growth, driven by technological innovations, expanding applications across various sectors, and supportive government policies. Strategic partnerships and investments in advanced manufacturing techniques will play crucial roles in overcoming challenges and unlocking significant market potential, projected to be xx Million by 2033.
Ceramic Matrix Composites Industry Segmentation
-
1. Product Type
- 1.1. C/C Ceramic Matrix Composites
- 1.2. C/SIC Ceramic Matrix Composites
- 1.3. Oxide/Oxide Ceramic Matrix Composites
- 1.4. SIC/SIC Ceramic Matrix Composites
-
2. End-user Industry
- 2.1. Automotive
- 2.2. Aerospace
- 2.3. Defense
- 2.4. Energy and Power
- 2.5. Electrical and Electronics
- 2.6. Other End-user Industries
Ceramic Matrix Composites Industry Segmentation By Geography
-
1. Asia Pacific
- 1.1. China
- 1.2. India
- 1.3. Japan
- 1.4. South Korea
- 1.5. Malaysia
- 1.6. Thailand
- 1.7. Indonesia
- 1.8. Vietnam
- 1.9. Rest of Asia Pacific
-
2. North America
- 2.1. United States
- 2.2. Canada
- 2.3. Mexico
-
3. Europe
- 3.1. Germany
- 3.2. United Kingdom
- 3.3. France
- 3.4. Italy
- 3.5. Spain
- 3.6. Turkey
- 3.7. Russia
- 3.8. Nordic Countries
- 3.9. Rest of Europe
-
4. South America
- 4.1. Brazil
- 4.2. Argentina
- 4.3. Colombia
- 4.4. Rest of South America
-
5. Middle East and Africa
- 5.1. Saudi Arabia
- 5.2. Nigeria
- 5.3. Qatar
- 5.4. Egypt
- 5.5. United Arab Emirates
- 5.6. South Africa
- 5.7. Rest of Middle East and Africa
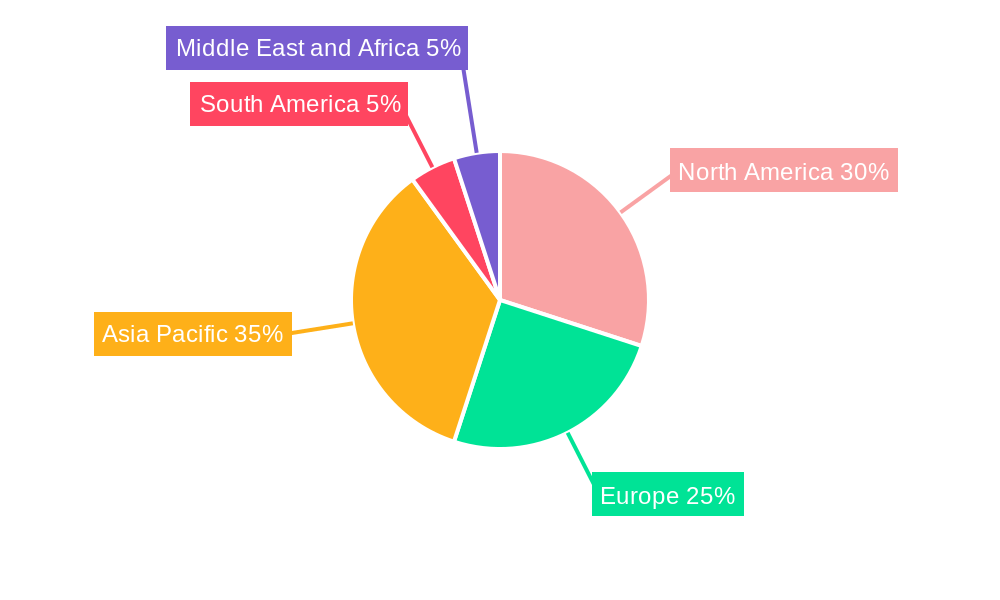
Ceramic Matrix Composites Industry Regional Market Share
Geographic Coverage of Ceramic Matrix Composites Industry
Ceramic Matrix Composites Industry REPORT HIGHLIGHTS
| Aspects | Details |
|---|---|
| Study Period | 2020-2034 |
| Base Year | 2025 |
| Estimated Year | 2026 |
| Forecast Period | 2026-2034 |
| Historical Period | 2020-2025 |
| Growth Rate | CAGR of > 10.00% from 2020-2034 |
| Segmentation |
|
Table of Contents
- 1. Introduction
- 1.1. Research Scope
- 1.2. Market Segmentation
- 1.3. Research Objective
- 1.4. Definitions and Assumptions
- 2. Executive Summary
- 2.1. Market Snapshot
- 3. Market Dynamics
- 3.1. Market Drivers
- 3.2. Market Restrains
- 3.3. Market Trends
- 3.4. Market Opportunities
- 4. Market Factor Analysis
- 4.1. Porters Five Forces
- 4.1.1. Bargaining Power of Suppliers
- 4.1.2. Bargaining Power of Buyers
- 4.1.3. Threat of New Entrants
- 4.1.4. Threat of Substitutes
- 4.1.5. Competitive Rivalry
- 4.2. PESTEL analysis
- 4.3. BCG Analysis
- 4.3.1. Stars (High Growth, High Market Share)
- 4.3.2. Cash Cows (Low Growth, High Market Share)
- 4.3.3. Question Mark (High Growth, Low Market Share)
- 4.3.4. Dogs (Low Growth, Low Market Share)
- 4.4. Ansoff Matrix Analysis
- 4.5. Supply Chain Analysis
- 4.6. Regulatory Landscape
- 4.7. Current Market Potential and Opportunity Assessment (TAM–SAM–SOM Framework)
- 4.8. TIR Analyst Note
- 4.1. Porters Five Forces
- 5. Market Analysis, Insights and Forecast 2021-2033
- 5.1. Market Analysis, Insights and Forecast - by Product Type
- 5.1.1. C/C Ceramic Matrix Composites
- 5.1.2. C/SIC Ceramic Matrix Composites
- 5.1.3. Oxide/Oxide Ceramic Matrix Composites
- 5.1.4. SIC/SIC Ceramic Matrix Composites
- 5.2. Market Analysis, Insights and Forecast - by End-user Industry
- 5.2.1. Automotive
- 5.2.2. Aerospace
- 5.2.3. Defense
- 5.2.4. Energy and Power
- 5.2.5. Electrical and Electronics
- 5.2.6. Other End-user Industries
- 5.3. Market Analysis, Insights and Forecast - by Region
- 5.3.1. Asia Pacific
- 5.3.2. North America
- 5.3.3. Europe
- 5.3.4. South America
- 5.3.5. Middle East and Africa
- 5.1. Market Analysis, Insights and Forecast - by Product Type
- 6. Global Ceramic Matrix Composites Industry Analysis, Insights and Forecast, 2021-2033
- 6.1. Market Analysis, Insights and Forecast - by Product Type
- 6.1.1. C/C Ceramic Matrix Composites
- 6.1.2. C/SIC Ceramic Matrix Composites
- 6.1.3. Oxide/Oxide Ceramic Matrix Composites
- 6.1.4. SIC/SIC Ceramic Matrix Composites
- 6.2. Market Analysis, Insights and Forecast - by End-user Industry
- 6.2.1. Automotive
- 6.2.2. Aerospace
- 6.2.3. Defense
- 6.2.4. Energy and Power
- 6.2.5. Electrical and Electronics
- 6.2.6. Other End-user Industries
- 6.1. Market Analysis, Insights and Forecast - by Product Type
- 7. Asia Pacific Ceramic Matrix Composites Industry Analysis, Insights and Forecast, 2020-2032
- 7.1. Market Analysis, Insights and Forecast - by Product Type
- 7.1.1. C/C Ceramic Matrix Composites
- 7.1.2. C/SIC Ceramic Matrix Composites
- 7.1.3. Oxide/Oxide Ceramic Matrix Composites
- 7.1.4. SIC/SIC Ceramic Matrix Composites
- 7.2. Market Analysis, Insights and Forecast - by End-user Industry
- 7.2.1. Automotive
- 7.2.2. Aerospace
- 7.2.3. Defense
- 7.2.4. Energy and Power
- 7.2.5. Electrical and Electronics
- 7.2.6. Other End-user Industries
- 7.1. Market Analysis, Insights and Forecast - by Product Type
- 8. North America Ceramic Matrix Composites Industry Analysis, Insights and Forecast, 2020-2032
- 8.1. Market Analysis, Insights and Forecast - by Product Type
- 8.1.1. C/C Ceramic Matrix Composites
- 8.1.2. C/SIC Ceramic Matrix Composites
- 8.1.3. Oxide/Oxide Ceramic Matrix Composites
- 8.1.4. SIC/SIC Ceramic Matrix Composites
- 8.2. Market Analysis, Insights and Forecast - by End-user Industry
- 8.2.1. Automotive
- 8.2.2. Aerospace
- 8.2.3. Defense
- 8.2.4. Energy and Power
- 8.2.5. Electrical and Electronics
- 8.2.6. Other End-user Industries
- 8.1. Market Analysis, Insights and Forecast - by Product Type
- 9. Europe Ceramic Matrix Composites Industry Analysis, Insights and Forecast, 2020-2032
- 9.1. Market Analysis, Insights and Forecast - by Product Type
- 9.1.1. C/C Ceramic Matrix Composites
- 9.1.2. C/SIC Ceramic Matrix Composites
- 9.1.3. Oxide/Oxide Ceramic Matrix Composites
- 9.1.4. SIC/SIC Ceramic Matrix Composites
- 9.2. Market Analysis, Insights and Forecast - by End-user Industry
- 9.2.1. Automotive
- 9.2.2. Aerospace
- 9.2.3. Defense
- 9.2.4. Energy and Power
- 9.2.5. Electrical and Electronics
- 9.2.6. Other End-user Industries
- 9.1. Market Analysis, Insights and Forecast - by Product Type
- 10. South America Ceramic Matrix Composites Industry Analysis, Insights and Forecast, 2020-2032
- 10.1. Market Analysis, Insights and Forecast - by Product Type
- 10.1.1. C/C Ceramic Matrix Composites
- 10.1.2. C/SIC Ceramic Matrix Composites
- 10.1.3. Oxide/Oxide Ceramic Matrix Composites
- 10.1.4. SIC/SIC Ceramic Matrix Composites
- 10.2. Market Analysis, Insights and Forecast - by End-user Industry
- 10.2.1. Automotive
- 10.2.2. Aerospace
- 10.2.3. Defense
- 10.2.4. Energy and Power
- 10.2.5. Electrical and Electronics
- 10.2.6. Other End-user Industries
- 10.1. Market Analysis, Insights and Forecast - by Product Type
- 11. Middle East and Africa Ceramic Matrix Composites Industry Analysis, Insights and Forecast, 2020-2032
- 11.1. Market Analysis, Insights and Forecast - by Product Type
- 11.1.1. C/C Ceramic Matrix Composites
- 11.1.2. C/SIC Ceramic Matrix Composites
- 11.1.3. Oxide/Oxide Ceramic Matrix Composites
- 11.1.4. SIC/SIC Ceramic Matrix Composites
- 11.2. Market Analysis, Insights and Forecast - by End-user Industry
- 11.2.1. Automotive
- 11.2.2. Aerospace
- 11.2.3. Defense
- 11.2.4. Energy and Power
- 11.2.5. Electrical and Electronics
- 11.2.6. Other End-user Industries
- 11.1. Market Analysis, Insights and Forecast - by Product Type
- 12. Competitive Analysis
- 12.1. Company Profiles
- 12.1.1 Rolls-Royce Plc
- 12.1.1.1. Company Overview
- 12.1.1.2. Products
- 12.1.1.3. Company Financials
- 12.1.1.4. SWOT Analysis
- 12.1.2 Ube Industries Ltd
- 12.1.2.1. Company Overview
- 12.1.2.2. Products
- 12.1.2.3. Company Financials
- 12.1.2.4. SWOT Analysis
- 12.1.3 General Electric
- 12.1.3.1. Company Overview
- 12.1.3.2. Products
- 12.1.3.3. Company Financials
- 12.1.3.4. SWOT Analysis
- 12.1.4 COI Ceramics Inc
- 12.1.4.1. Company Overview
- 12.1.4.2. Products
- 12.1.4.3. Company Financials
- 12.1.4.4. SWOT Analysis
- 12.1.5 Kyocera Corporation
- 12.1.5.1. Company Overview
- 12.1.5.2. Products
- 12.1.5.3. Company Financials
- 12.1.5.4. SWOT Analysis
- 12.1.6 3M
- 12.1.6.1. Company Overview
- 12.1.6.2. Products
- 12.1.6.3. Company Financials
- 12.1.6.4. SWOT Analysis
- 12.1.7 Ultramet Inc *List Not Exhaustive
- 12.1.7.1. Company Overview
- 12.1.7.2. Products
- 12.1.7.3. Company Financials
- 12.1.7.4. SWOT Analysis
- 12.1.8 SGL Carbon Company
- 12.1.8.1. Company Overview
- 12.1.8.2. Products
- 12.1.8.3. Company Financials
- 12.1.8.4. SWOT Analysis
- 12.1.9 CoorsTek Inc
- 12.1.9.1. Company Overview
- 12.1.9.2. Products
- 12.1.9.3. Company Financials
- 12.1.9.4. SWOT Analysis
- 12.1.10 Lancer Systems LP
- 12.1.10.1. Company Overview
- 12.1.10.2. Products
- 12.1.10.3. Company Financials
- 12.1.10.4. SWOT Analysis
- 12.1.11 Starfire Systems Inc
- 12.1.11.1. Company Overview
- 12.1.11.2. Products
- 12.1.11.3. Company Financials
- 12.1.11.4. SWOT Analysis
- 12.1.12 CeramTec
- 12.1.12.1. Company Overview
- 12.1.12.2. Products
- 12.1.12.3. Company Financials
- 12.1.12.4. SWOT Analysis
- 12.1.13 Applied Thin Films Inc
- 12.1.13.1. Company Overview
- 12.1.13.2. Products
- 12.1.13.3. Company Financials
- 12.1.13.4. SWOT Analysis
- 12.1.1 Rolls-Royce Plc
- 12.2. Market Entropy
- 12.2.1 Company's Key Areas Served
- 12.2.2 Recent Developments
- 12.3. Company Market Share Analysis 2025
- 12.3.1 Top 5 Companies Market Share Analysis
- 12.3.2 Top 3 Companies Market Share Analysis
- 12.4. List of Potential Customers
- 13. Research Methodology
List of Figures
- Figure 1: Global Ceramic Matrix Composites Industry Revenue Breakdown (Million, %) by Region 2025 & 2033
- Figure 2: Asia Pacific Ceramic Matrix Composites Industry Revenue (Million), by Product Type 2025 & 2033
- Figure 3: Asia Pacific Ceramic Matrix Composites Industry Revenue Share (%), by Product Type 2025 & 2033
- Figure 4: Asia Pacific Ceramic Matrix Composites Industry Revenue (Million), by End-user Industry 2025 & 2033
- Figure 5: Asia Pacific Ceramic Matrix Composites Industry Revenue Share (%), by End-user Industry 2025 & 2033
- Figure 6: Asia Pacific Ceramic Matrix Composites Industry Revenue (Million), by Country 2025 & 2033
- Figure 7: Asia Pacific Ceramic Matrix Composites Industry Revenue Share (%), by Country 2025 & 2033
- Figure 8: North America Ceramic Matrix Composites Industry Revenue (Million), by Product Type 2025 & 2033
- Figure 9: North America Ceramic Matrix Composites Industry Revenue Share (%), by Product Type 2025 & 2033
- Figure 10: North America Ceramic Matrix Composites Industry Revenue (Million), by End-user Industry 2025 & 2033
- Figure 11: North America Ceramic Matrix Composites Industry Revenue Share (%), by End-user Industry 2025 & 2033
- Figure 12: North America Ceramic Matrix Composites Industry Revenue (Million), by Country 2025 & 2033
- Figure 13: North America Ceramic Matrix Composites Industry Revenue Share (%), by Country 2025 & 2033
- Figure 14: Europe Ceramic Matrix Composites Industry Revenue (Million), by Product Type 2025 & 2033
- Figure 15: Europe Ceramic Matrix Composites Industry Revenue Share (%), by Product Type 2025 & 2033
- Figure 16: Europe Ceramic Matrix Composites Industry Revenue (Million), by End-user Industry 2025 & 2033
- Figure 17: Europe Ceramic Matrix Composites Industry Revenue Share (%), by End-user Industry 2025 & 2033
- Figure 18: Europe Ceramic Matrix Composites Industry Revenue (Million), by Country 2025 & 2033
- Figure 19: Europe Ceramic Matrix Composites Industry Revenue Share (%), by Country 2025 & 2033
- Figure 20: South America Ceramic Matrix Composites Industry Revenue (Million), by Product Type 2025 & 2033
- Figure 21: South America Ceramic Matrix Composites Industry Revenue Share (%), by Product Type 2025 & 2033
- Figure 22: South America Ceramic Matrix Composites Industry Revenue (Million), by End-user Industry 2025 & 2033
- Figure 23: South America Ceramic Matrix Composites Industry Revenue Share (%), by End-user Industry 2025 & 2033
- Figure 24: South America Ceramic Matrix Composites Industry Revenue (Million), by Country 2025 & 2033
- Figure 25: South America Ceramic Matrix Composites Industry Revenue Share (%), by Country 2025 & 2033
- Figure 26: Middle East and Africa Ceramic Matrix Composites Industry Revenue (Million), by Product Type 2025 & 2033
- Figure 27: Middle East and Africa Ceramic Matrix Composites Industry Revenue Share (%), by Product Type 2025 & 2033
- Figure 28: Middle East and Africa Ceramic Matrix Composites Industry Revenue (Million), by End-user Industry 2025 & 2033
- Figure 29: Middle East and Africa Ceramic Matrix Composites Industry Revenue Share (%), by End-user Industry 2025 & 2033
- Figure 30: Middle East and Africa Ceramic Matrix Composites Industry Revenue (Million), by Country 2025 & 2033
- Figure 31: Middle East and Africa Ceramic Matrix Composites Industry Revenue Share (%), by Country 2025 & 2033
List of Tables
- Table 1: Global Ceramic Matrix Composites Industry Revenue Million Forecast, by Product Type 2020 & 2033
- Table 2: Global Ceramic Matrix Composites Industry Revenue Million Forecast, by End-user Industry 2020 & 2033
- Table 3: Global Ceramic Matrix Composites Industry Revenue Million Forecast, by Region 2020 & 2033
- Table 4: Global Ceramic Matrix Composites Industry Revenue Million Forecast, by Product Type 2020 & 2033
- Table 5: Global Ceramic Matrix Composites Industry Revenue Million Forecast, by End-user Industry 2020 & 2033
- Table 6: Global Ceramic Matrix Composites Industry Revenue Million Forecast, by Country 2020 & 2033
- Table 7: China Ceramic Matrix Composites Industry Revenue (Million) Forecast, by Application 2020 & 2033
- Table 8: India Ceramic Matrix Composites Industry Revenue (Million) Forecast, by Application 2020 & 2033
- Table 9: Japan Ceramic Matrix Composites Industry Revenue (Million) Forecast, by Application 2020 & 2033
- Table 10: South Korea Ceramic Matrix Composites Industry Revenue (Million) Forecast, by Application 2020 & 2033
- Table 11: Malaysia Ceramic Matrix Composites Industry Revenue (Million) Forecast, by Application 2020 & 2033
- Table 12: Thailand Ceramic Matrix Composites Industry Revenue (Million) Forecast, by Application 2020 & 2033
- Table 13: Indonesia Ceramic Matrix Composites Industry Revenue (Million) Forecast, by Application 2020 & 2033
- Table 14: Vietnam Ceramic Matrix Composites Industry Revenue (Million) Forecast, by Application 2020 & 2033
- Table 15: Rest of Asia Pacific Ceramic Matrix Composites Industry Revenue (Million) Forecast, by Application 2020 & 2033
- Table 16: Global Ceramic Matrix Composites Industry Revenue Million Forecast, by Product Type 2020 & 2033
- Table 17: Global Ceramic Matrix Composites Industry Revenue Million Forecast, by End-user Industry 2020 & 2033
- Table 18: Global Ceramic Matrix Composites Industry Revenue Million Forecast, by Country 2020 & 2033
- Table 19: United States Ceramic Matrix Composites Industry Revenue (Million) Forecast, by Application 2020 & 2033
- Table 20: Canada Ceramic Matrix Composites Industry Revenue (Million) Forecast, by Application 2020 & 2033
- Table 21: Mexico Ceramic Matrix Composites Industry Revenue (Million) Forecast, by Application 2020 & 2033
- Table 22: Global Ceramic Matrix Composites Industry Revenue Million Forecast, by Product Type 2020 & 2033
- Table 23: Global Ceramic Matrix Composites Industry Revenue Million Forecast, by End-user Industry 2020 & 2033
- Table 24: Global Ceramic Matrix Composites Industry Revenue Million Forecast, by Country 2020 & 2033
- Table 25: Germany Ceramic Matrix Composites Industry Revenue (Million) Forecast, by Application 2020 & 2033
- Table 26: United Kingdom Ceramic Matrix Composites Industry Revenue (Million) Forecast, by Application 2020 & 2033
- Table 27: France Ceramic Matrix Composites Industry Revenue (Million) Forecast, by Application 2020 & 2033
- Table 28: Italy Ceramic Matrix Composites Industry Revenue (Million) Forecast, by Application 2020 & 2033
- Table 29: Spain Ceramic Matrix Composites Industry Revenue (Million) Forecast, by Application 2020 & 2033
- Table 30: Turkey Ceramic Matrix Composites Industry Revenue (Million) Forecast, by Application 2020 & 2033
- Table 31: Russia Ceramic Matrix Composites Industry Revenue (Million) Forecast, by Application 2020 & 2033
- Table 32: Nordic Countries Ceramic Matrix Composites Industry Revenue (Million) Forecast, by Application 2020 & 2033
- Table 33: Rest of Europe Ceramic Matrix Composites Industry Revenue (Million) Forecast, by Application 2020 & 2033
- Table 34: Global Ceramic Matrix Composites Industry Revenue Million Forecast, by Product Type 2020 & 2033
- Table 35: Global Ceramic Matrix Composites Industry Revenue Million Forecast, by End-user Industry 2020 & 2033
- Table 36: Global Ceramic Matrix Composites Industry Revenue Million Forecast, by Country 2020 & 2033
- Table 37: Brazil Ceramic Matrix Composites Industry Revenue (Million) Forecast, by Application 2020 & 2033
- Table 38: Argentina Ceramic Matrix Composites Industry Revenue (Million) Forecast, by Application 2020 & 2033
- Table 39: Colombia Ceramic Matrix Composites Industry Revenue (Million) Forecast, by Application 2020 & 2033
- Table 40: Rest of South America Ceramic Matrix Composites Industry Revenue (Million) Forecast, by Application 2020 & 2033
- Table 41: Global Ceramic Matrix Composites Industry Revenue Million Forecast, by Product Type 2020 & 2033
- Table 42: Global Ceramic Matrix Composites Industry Revenue Million Forecast, by End-user Industry 2020 & 2033
- Table 43: Global Ceramic Matrix Composites Industry Revenue Million Forecast, by Country 2020 & 2033
- Table 44: Saudi Arabia Ceramic Matrix Composites Industry Revenue (Million) Forecast, by Application 2020 & 2033
- Table 45: Nigeria Ceramic Matrix Composites Industry Revenue (Million) Forecast, by Application 2020 & 2033
- Table 46: Qatar Ceramic Matrix Composites Industry Revenue (Million) Forecast, by Application 2020 & 2033
- Table 47: Egypt Ceramic Matrix Composites Industry Revenue (Million) Forecast, by Application 2020 & 2033
- Table 48: United Arab Emirates Ceramic Matrix Composites Industry Revenue (Million) Forecast, by Application 2020 & 2033
- Table 49: South Africa Ceramic Matrix Composites Industry Revenue (Million) Forecast, by Application 2020 & 2033
- Table 50: Rest of Middle East and Africa Ceramic Matrix Composites Industry Revenue (Million) Forecast, by Application 2020 & 2033
Frequently Asked Questions
1. What is the projected Compound Annual Growth Rate (CAGR) of the Ceramic Matrix Composites Industry?
The projected CAGR is approximately > 10.00%.
2. Which companies are prominent players in the Ceramic Matrix Composites Industry?
Key companies in the market include Rolls-Royce Plc, Ube Industries Ltd, General Electric, COI Ceramics Inc, Kyocera Corporation, 3M, Ultramet Inc *List Not Exhaustive, SGL Carbon Company, CoorsTek Inc, Lancer Systems LP, Starfire Systems Inc, CeramTec, Applied Thin Films Inc.
3. What are the main segments of the Ceramic Matrix Composites Industry?
The market segments include Product Type, End-user Industry.
4. Can you provide details about the market size?
The market size is estimated to be USD XX Million as of 2022.
5. What are some drivers contributing to market growth?
; Increasing Application of Ceramic Matrix Composites in Defense Sector; Exceptional Performance Properties at Very High Temperatures.
6. What are the notable trends driving market growth?
SIC/SIC Ceramic Matrix Composites to Drive the Market Growth.
7. Are there any restraints impacting market growth?
; Higher Cost of Production as Compared to Other Metals & Alloys; Impact of COVID-19 on the Market Studied.
8. Can you provide examples of recent developments in the market?
N/A
9. What pricing options are available for accessing the report?
Pricing options include single-user, multi-user, and enterprise licenses priced at USD 4750, USD 5250, and USD 8750 respectively.
10. Is the market size provided in terms of value or volume?
The market size is provided in terms of value, measured in Million.
11. Are there any specific market keywords associated with the report?
Yes, the market keyword associated with the report is "Ceramic Matrix Composites Industry," which aids in identifying and referencing the specific market segment covered.
12. How do I determine which pricing option suits my needs best?
The pricing options vary based on user requirements and access needs. Individual users may opt for single-user licenses, while businesses requiring broader access may choose multi-user or enterprise licenses for cost-effective access to the report.
13. Are there any additional resources or data provided in the Ceramic Matrix Composites Industry report?
While the report offers comprehensive insights, it's advisable to review the specific contents or supplementary materials provided to ascertain if additional resources or data are available.
14. How can I stay updated on further developments or reports in the Ceramic Matrix Composites Industry?
To stay informed about further developments, trends, and reports in the Ceramic Matrix Composites Industry, consider subscribing to industry newsletters, following relevant companies and organizations, or regularly checking reputable industry news sources and publications.
Methodology
Step 1 - Identification of Relevant Samples Size from Population Database


Step 2 - Approaches for Defining Global Market Size (Value, Volume* & Price*)

Note*: In applicable scenarios
Step 3 - Data Sources
Primary Research
- Web Analytics
- Survey Reports
- Research Institute
- Latest Research Reports
- Opinion Leaders
Secondary Research
- Annual Reports
- White Paper
- Latest Press Release
- Industry Association
- Paid Database
- Investor Presentations

Step 4 - Data Triangulation
Involves using different sources of information in order to increase the validity of a study
These sources are likely to be stakeholders in a program - participants, other researchers, program staff, other community members, and so on.
Then we put all data in single framework & apply various statistical tools to find out the dynamic on the market.
During the analysis stage, feedback from the stakeholder groups would be compared to determine areas of agreement as well as areas of divergence