

Key Insights
The global cooling tower rental market is poised for significant expansion, projected to reach a market size of $1.39 billion by 2033, with a compound annual growth rate (CAGR) of 6.2% from the base year 2025. This robust growth is propelled by escalating demand across diverse industries requiring efficient thermal management. Key drivers include the increasing adoption of cooling towers in power generation, manufacturing, and data centers, alongside a growing preference for rental solutions due to their cost-effectiveness, flexibility, and reduced capital expenditure, especially for projects with variable cooling needs. Technological advancements in energy-efficient cooling towers and enhanced rental service offerings further stimulate market development. The market is segmented by type (wet, dry, hybrid) and end-user (commercial, industrial), with the industrial sector expected to maintain a dominant share owing to substantial cooling requirements. Geographically, while North America and Europe currently lead, the Asia-Pacific region is exhibiting rapid growth fueled by industrialization and infrastructure development.
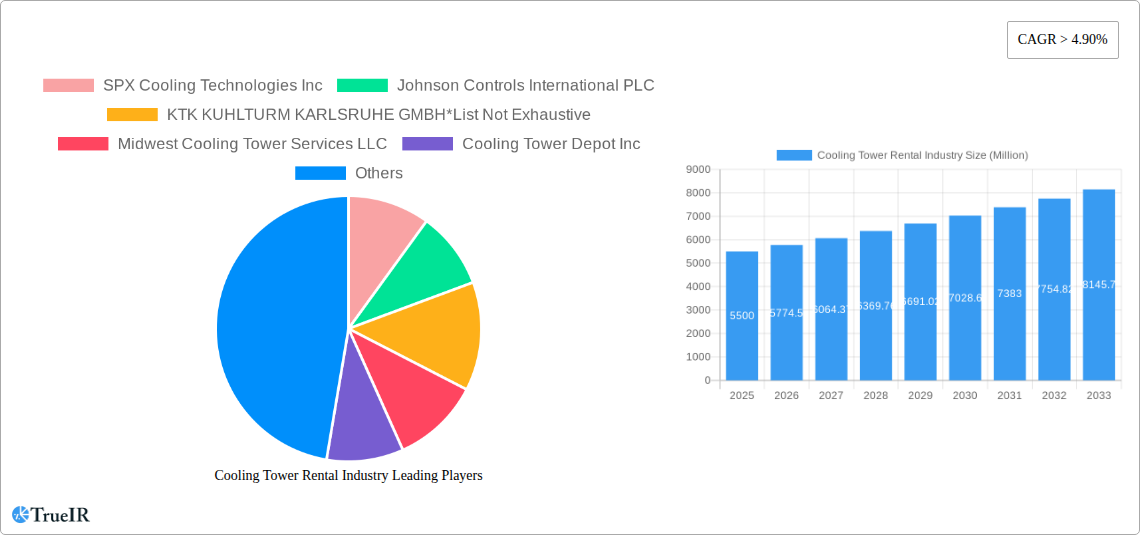
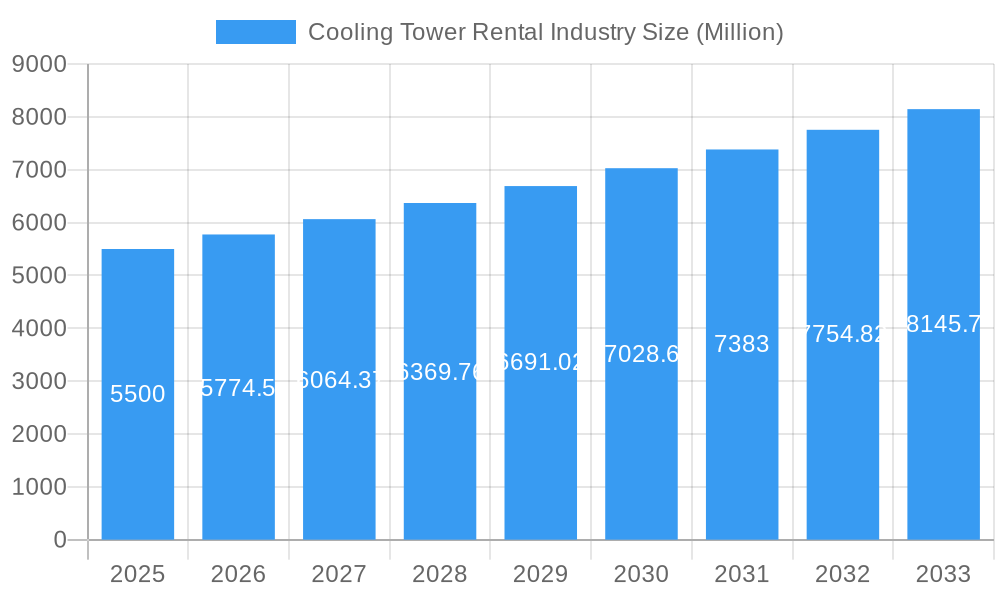
Cooling Tower Rental Industry Market Size (In Billion)
The competitive environment features established global players and specialized rental providers. Mergers and acquisitions are prevalent, enabling companies to broaden their market reach and service portfolios. Challenges such as raw material price volatility, stringent environmental regulations, and economic fluctuations impacting rental demand persist. However, the market outlook remains highly positive, driven by continuous innovation, increasing global industrial activity, and the growing emphasis on sustainable cooling solutions, presenting attractive opportunities for stakeholders.
Cooling Tower Rental Industry Company Market Share
Cooling Tower Rental Market Analysis: 2025-2033
This comprehensive report details the cooling tower rental market, projecting a market size of $1.39 billion by 2033. The analysis spans 2025-2033, with 2025 designated as the base year. This in-depth study offers critical insights for stakeholders navigating the dynamic cooling tower rental landscape.
Cooling Tower Rental Industry Market Structure & Competitive Landscape
The global cooling tower rental market is moderately fragmented, with several major players and numerous smaller regional operators. Market concentration is estimated at a Herfindahl-Hirschman Index (HHI) of XX, indicating a relatively competitive landscape. Key players such as SPX Cooling Technologies Inc, Johnson Controls International PLC, and KTK KUHLTURM KARLSRUHE GMBH, along with other prominent players like Midwest Cooling Tower Services LLC, Cooling Tower Depot Inc, Caterpillar Inc, Aggreko PLC, Baltimore Aircoil Co, Carrier Rental Systems Inc, and United Rentals Inc., compete primarily on pricing, service quality, and geographic reach.
Innovation drivers within the industry include the development of more efficient and environmentally friendly cooling technologies, including hybrid cooling towers. Regulatory impacts, particularly those related to environmental regulations and energy efficiency standards, significantly influence market dynamics. Product substitutes, such as evaporative condensers and air-cooled condensers, pose a degree of competitive pressure. The industry exhibits moderate M&A activity, with an estimated XX number of transactions recorded between 2019 and 2024. End-user segmentation is primarily divided between commercial and industrial sectors, with the industrial sector accounting for a larger share.
- Market Concentration: HHI of XX
- M&A Activity (2019-2024): XX transactions
- Key Competitive Strategies: Pricing, service quality, geographic reach, technological innovation.
- Major Players: SPX Cooling Technologies Inc, Johnson Controls International PLC, KTK KUHLTURM KARLSRUHE GMBH, Midwest Cooling Tower Services LLC, Cooling Tower Depot Inc, Caterpillar Inc, Aggreko PLC, Baltimore Aircoil Co, Carrier Rental Systems Inc, United Rentals Inc.
Cooling Tower Rental Industry Market Trends & Opportunities
The cooling tower rental market is expected to experience robust growth, with a Compound Annual Growth Rate (CAGR) of XX% during the forecast period (2025-2033). This growth is fueled by increasing demand from various industrial sectors, including manufacturing, power generation, and data centers. Technological advancements, such as the development of more energy-efficient and environmentally friendly cooling towers, are driving market penetration rates, particularly in the industrial sector. The rising adoption of hybrid cooling towers, which combine the benefits of wet and dry cooling technologies, is also contributing to market expansion. Consumer preference for sustainable and cost-effective solutions is bolstering the demand for rental services, offering a cost-effective alternative to outright purchasing for seasonal or short-term needs. Intense competition among existing players is pushing innovation and driving down costs, making the technology more accessible to a broader client base. The growing focus on energy efficiency and sustainability regulations is creating new opportunities for energy-efficient cooling tower rentals. Market penetration in emerging economies is expected to increase significantly due to rising industrialization and infrastructure development. The market size is anticipated to reach $XX Million by 2033, representing a substantial increase from the $XX Million recorded in 2024.
Dominant Markets & Segments in Cooling Tower Rental Industry
The industrial sector is the dominant end-user segment for cooling tower rentals, driven by high demand from manufacturing facilities, power plants, and refineries. Geographically, North America and Europe currently hold a significant market share. However, rapid industrialization in Asia-Pacific is projected to drive substantial growth in this region over the forecast period. The wet cooling tower type dominates the market currently due to its relatively lower cost and established technology, though hybrid systems are gaining traction.
- Key Growth Drivers (Industrial Sector): Rising industrial output, expansion of manufacturing facilities, increasing energy consumption in industries.
- Key Growth Drivers (Asia-Pacific): Rapid industrialization, expanding infrastructure development, rising energy demand.
- Dominant Cooling Tower Type: Wet cooling towers
- Emerging Trend: Growing adoption of hybrid cooling towers.
Cooling Tower Rental Industry Product Analysis
The cooling tower rental market offers a variety of wet, dry, and hybrid cooling tower options, each tailored to specific application needs and environmental conditions. Technological advancements focus on improving energy efficiency, reducing water consumption, and minimizing environmental impact. Competitive advantages are derived from factors such as superior energy efficiency, optimized cooling capacity, ease of installation, and comprehensive maintenance services. The market offers both standard and customized rental solutions to meet diverse customer requirements, creating a niche for specialized services and specialized tower designs that cater to specific industrial cooling demands.
Key Drivers, Barriers & Challenges in Cooling Tower Rental Industry
Key Drivers: Rising industrialization and urbanization are driving increased demand for cooling solutions. Stringent environmental regulations are encouraging the adoption of energy-efficient cooling technologies, and the cost-effectiveness of rental services compared to direct purchase boosts market growth. The increasing adoption of sophisticated monitoring and control systems is also driving market expansion.
Key Barriers & Challenges: Fluctuations in raw material prices and supply chain disruptions can impact rental costs. Intense competition among market players can depress profit margins, and stringent environmental regulations may increase operational costs. The COVID-19 pandemic significantly affected market demand due to temporary factory shutdowns and reduced industrial activity. This impacted the market with a reduction of XX Million in revenue.
Growth Drivers in the Cooling Tower Rental Industry Market
The key growth drivers include: expanding industrialization and urbanization leading to increased demand for efficient cooling solutions, stringent environmental regulations promoting energy-efficient technologies, and the cost-effectiveness of rental services as opposed to purchasing. Government incentives for energy efficiency also contribute to growth.
Challenges Impacting Cooling Tower Rental Industry Growth
Challenges include volatile raw material prices, supply chain vulnerabilities, intense competition among rental providers, and the high initial investment costs associated with adopting new technologies. The impact of economic downturns and global events (like the COVID-19 pandemic) also poses a substantial risk to market stability.
Key Players Shaping the Cooling Tower Rental Industry Market
- SPX Cooling Technologies Inc
- Johnson Controls International PLC
- KTK KUHLTURM KARLSRUHE GMBH
- Midwest Cooling Tower Services LLC
- Cooling Tower Depot Inc
- Caterpillar Inc
- Aggreko PLC
- Baltimore Aircoil Co
- Carrier Rental Systems Inc
- United Rentals Inc
Significant Cooling Tower Rental Industry Industry Milestones
- 2020 Q2: COVID-19 pandemic causes a significant drop in demand due to widespread lockdowns and reduced industrial activity.
- 2021 Q3: Industry begins to recover as economies reopen and industrial activity resumes.
- 2022: Increased focus on sustainability drives the adoption of energy-efficient cooling tower technologies.
- 2023: Several mergers and acquisitions consolidate market share among major players. (Estimated XX transactions).
Future Outlook for Cooling Tower Rental Industry Market
The cooling tower rental market is poised for continued growth, driven by factors such as increasing industrial activity, rising urbanization, and stricter environmental regulations. Strategic opportunities lie in expanding into emerging markets and developing innovative, sustainable cooling solutions. The market’s potential for growth is significant, particularly in regions experiencing rapid economic development and industrial expansion. The projected growth trajectory suggests a highly promising future for the industry.
Cooling Tower Rental Industry Segmentation
-
1. Type
- 1.1. Wet
- 1.2. Dry
- 1.3. Hybrid
-
2. End User
- 2.1. Commercial
- 2.2. Industrial
Cooling Tower Rental Industry Segmentation By Geography
- 1. North America
- 2. Europe
- 3. Asia Pacific
- 4. Middle East and Africa
- 5. South America
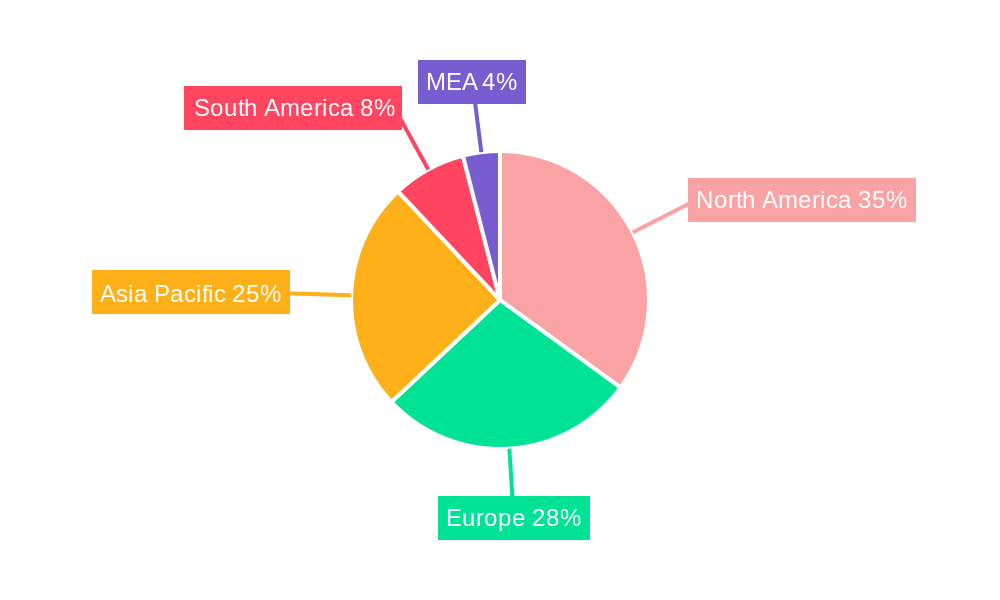
Cooling Tower Rental Industry Regional Market Share
Geographic Coverage of Cooling Tower Rental Industry
Cooling Tower Rental Industry REPORT HIGHLIGHTS
| Aspects | Details |
|---|---|
| Study Period | 2020-2034 |
| Base Year | 2025 |
| Estimated Year | 2026 |
| Forecast Period | 2026-2034 |
| Historical Period | 2020-2025 |
| Growth Rate | CAGR of 6.2% from 2020-2034 |
| Segmentation |
|
Table of Contents
- 1. Introduction
- 1.1. Research Scope
- 1.2. Market Segmentation
- 1.3. Research Objective
- 1.4. Definitions and Assumptions
- 2. Executive Summary
- 2.1. Market Snapshot
- 3. Market Dynamics
- 3.1. Market Drivers
- 3.2. Market Restrains
- 3.3. Market Trends
- 3.4. Market Opportunities
- 4. Market Factor Analysis
- 4.1. Porters Five Forces
- 4.1.1. Bargaining Power of Suppliers
- 4.1.2. Bargaining Power of Buyers
- 4.1.3. Threat of New Entrants
- 4.1.4. Threat of Substitutes
- 4.1.5. Competitive Rivalry
- 4.2. PESTEL analysis
- 4.3. BCG Analysis
- 4.3.1. Stars (High Growth, High Market Share)
- 4.3.2. Cash Cows (Low Growth, High Market Share)
- 4.3.3. Question Mark (High Growth, Low Market Share)
- 4.3.4. Dogs (Low Growth, Low Market Share)
- 4.4. Ansoff Matrix Analysis
- 4.5. Supply Chain Analysis
- 4.6. Regulatory Landscape
- 4.7. Current Market Potential and Opportunity Assessment (TAM–SAM–SOM Framework)
- 4.8. TIR Analyst Note
- 4.1. Porters Five Forces
- 5. Market Analysis, Insights and Forecast 2021-2033
- 5.1. Market Analysis, Insights and Forecast - by Type
- 5.1.1. Wet
- 5.1.2. Dry
- 5.1.3. Hybrid
- 5.2. Market Analysis, Insights and Forecast - by End User
- 5.2.1. Commercial
- 5.2.2. Industrial
- 5.3. Market Analysis, Insights and Forecast - by Region
- 5.3.1. North America
- 5.3.2. Europe
- 5.3.3. Asia Pacific
- 5.3.4. Middle East and Africa
- 5.3.5. South America
- 5.1. Market Analysis, Insights and Forecast - by Type
- 6. Global Cooling Tower Rental Industry Analysis, Insights and Forecast, 2021-2033
- 6.1. Market Analysis, Insights and Forecast - by Type
- 6.1.1. Wet
- 6.1.2. Dry
- 6.1.3. Hybrid
- 6.2. Market Analysis, Insights and Forecast - by End User
- 6.2.1. Commercial
- 6.2.2. Industrial
- 6.1. Market Analysis, Insights and Forecast - by Type
- 7. North America Cooling Tower Rental Industry Analysis, Insights and Forecast, 2020-2032
- 7.1. Market Analysis, Insights and Forecast - by Type
- 7.1.1. Wet
- 7.1.2. Dry
- 7.1.3. Hybrid
- 7.2. Market Analysis, Insights and Forecast - by End User
- 7.2.1. Commercial
- 7.2.2. Industrial
- 7.1. Market Analysis, Insights and Forecast - by Type
- 8. Europe Cooling Tower Rental Industry Analysis, Insights and Forecast, 2020-2032
- 8.1. Market Analysis, Insights and Forecast - by Type
- 8.1.1. Wet
- 8.1.2. Dry
- 8.1.3. Hybrid
- 8.2. Market Analysis, Insights and Forecast - by End User
- 8.2.1. Commercial
- 8.2.2. Industrial
- 8.1. Market Analysis, Insights and Forecast - by Type
- 9. Asia Pacific Cooling Tower Rental Industry Analysis, Insights and Forecast, 2020-2032
- 9.1. Market Analysis, Insights and Forecast - by Type
- 9.1.1. Wet
- 9.1.2. Dry
- 9.1.3. Hybrid
- 9.2. Market Analysis, Insights and Forecast - by End User
- 9.2.1. Commercial
- 9.2.2. Industrial
- 9.1. Market Analysis, Insights and Forecast - by Type
- 10. Middle East and Africa Cooling Tower Rental Industry Analysis, Insights and Forecast, 2020-2032
- 10.1. Market Analysis, Insights and Forecast - by Type
- 10.1.1. Wet
- 10.1.2. Dry
- 10.1.3. Hybrid
- 10.2. Market Analysis, Insights and Forecast - by End User
- 10.2.1. Commercial
- 10.2.2. Industrial
- 10.1. Market Analysis, Insights and Forecast - by Type
- 11. South America Cooling Tower Rental Industry Analysis, Insights and Forecast, 2020-2032
- 11.1. Market Analysis, Insights and Forecast - by Type
- 11.1.1. Wet
- 11.1.2. Dry
- 11.1.3. Hybrid
- 11.2. Market Analysis, Insights and Forecast - by End User
- 11.2.1. Commercial
- 11.2.2. Industrial
- 11.1. Market Analysis, Insights and Forecast - by Type
- 12. Competitive Analysis
- 12.1. Company Profiles
- 12.1.1 SPX Cooling Technologies Inc
- 12.1.1.1. Company Overview
- 12.1.1.2. Products
- 12.1.1.3. Company Financials
- 12.1.1.4. SWOT Analysis
- 12.1.2 Johnson Controls International PLC
- 12.1.2.1. Company Overview
- 12.1.2.2. Products
- 12.1.2.3. Company Financials
- 12.1.2.4. SWOT Analysis
- 12.1.3 KTK KUHLTURM KARLSRUHE GMBH*List Not Exhaustive
- 12.1.3.1. Company Overview
- 12.1.3.2. Products
- 12.1.3.3. Company Financials
- 12.1.3.4. SWOT Analysis
- 12.1.4 Midwest Cooling Tower Services LLC
- 12.1.4.1. Company Overview
- 12.1.4.2. Products
- 12.1.4.3. Company Financials
- 12.1.4.4. SWOT Analysis
- 12.1.5 Cooling Tower Depot Inc
- 12.1.5.1. Company Overview
- 12.1.5.2. Products
- 12.1.5.3. Company Financials
- 12.1.5.4. SWOT Analysis
- 12.1.6 Caterpillar Inc
- 12.1.6.1. Company Overview
- 12.1.6.2. Products
- 12.1.6.3. Company Financials
- 12.1.6.4. SWOT Analysis
- 12.1.7 Aggreko PLC
- 12.1.7.1. Company Overview
- 12.1.7.2. Products
- 12.1.7.3. Company Financials
- 12.1.7.4. SWOT Analysis
- 12.1.8 Baltimore Aircoil Co
- 12.1.8.1. Company Overview
- 12.1.8.2. Products
- 12.1.8.3. Company Financials
- 12.1.8.4. SWOT Analysis
- 12.1.9 Carrier Rental Systems Inc
- 12.1.9.1. Company Overview
- 12.1.9.2. Products
- 12.1.9.3. Company Financials
- 12.1.9.4. SWOT Analysis
- 12.1.10 United Rentals Inc
- 12.1.10.1. Company Overview
- 12.1.10.2. Products
- 12.1.10.3. Company Financials
- 12.1.10.4. SWOT Analysis
- 12.1.1 SPX Cooling Technologies Inc
- 12.2. Market Entropy
- 12.2.1 Company's Key Areas Served
- 12.2.2 Recent Developments
- 12.3. Company Market Share Analysis 2025
- 12.3.1 Top 5 Companies Market Share Analysis
- 12.3.2 Top 3 Companies Market Share Analysis
- 12.4. List of Potential Customers
- 13. Research Methodology
List of Figures
- Figure 1: Global Cooling Tower Rental Industry Revenue Breakdown (billion, %) by Region 2025 & 2033
- Figure 2: North America Cooling Tower Rental Industry Revenue (billion), by Type 2025 & 2033
- Figure 3: North America Cooling Tower Rental Industry Revenue Share (%), by Type 2025 & 2033
- Figure 4: North America Cooling Tower Rental Industry Revenue (billion), by End User 2025 & 2033
- Figure 5: North America Cooling Tower Rental Industry Revenue Share (%), by End User 2025 & 2033
- Figure 6: North America Cooling Tower Rental Industry Revenue (billion), by Country 2025 & 2033
- Figure 7: North America Cooling Tower Rental Industry Revenue Share (%), by Country 2025 & 2033
- Figure 8: Europe Cooling Tower Rental Industry Revenue (billion), by Type 2025 & 2033
- Figure 9: Europe Cooling Tower Rental Industry Revenue Share (%), by Type 2025 & 2033
- Figure 10: Europe Cooling Tower Rental Industry Revenue (billion), by End User 2025 & 2033
- Figure 11: Europe Cooling Tower Rental Industry Revenue Share (%), by End User 2025 & 2033
- Figure 12: Europe Cooling Tower Rental Industry Revenue (billion), by Country 2025 & 2033
- Figure 13: Europe Cooling Tower Rental Industry Revenue Share (%), by Country 2025 & 2033
- Figure 14: Asia Pacific Cooling Tower Rental Industry Revenue (billion), by Type 2025 & 2033
- Figure 15: Asia Pacific Cooling Tower Rental Industry Revenue Share (%), by Type 2025 & 2033
- Figure 16: Asia Pacific Cooling Tower Rental Industry Revenue (billion), by End User 2025 & 2033
- Figure 17: Asia Pacific Cooling Tower Rental Industry Revenue Share (%), by End User 2025 & 2033
- Figure 18: Asia Pacific Cooling Tower Rental Industry Revenue (billion), by Country 2025 & 2033
- Figure 19: Asia Pacific Cooling Tower Rental Industry Revenue Share (%), by Country 2025 & 2033
- Figure 20: Middle East and Africa Cooling Tower Rental Industry Revenue (billion), by Type 2025 & 2033
- Figure 21: Middle East and Africa Cooling Tower Rental Industry Revenue Share (%), by Type 2025 & 2033
- Figure 22: Middle East and Africa Cooling Tower Rental Industry Revenue (billion), by End User 2025 & 2033
- Figure 23: Middle East and Africa Cooling Tower Rental Industry Revenue Share (%), by End User 2025 & 2033
- Figure 24: Middle East and Africa Cooling Tower Rental Industry Revenue (billion), by Country 2025 & 2033
- Figure 25: Middle East and Africa Cooling Tower Rental Industry Revenue Share (%), by Country 2025 & 2033
- Figure 26: South America Cooling Tower Rental Industry Revenue (billion), by Type 2025 & 2033
- Figure 27: South America Cooling Tower Rental Industry Revenue Share (%), by Type 2025 & 2033
- Figure 28: South America Cooling Tower Rental Industry Revenue (billion), by End User 2025 & 2033
- Figure 29: South America Cooling Tower Rental Industry Revenue Share (%), by End User 2025 & 2033
- Figure 30: South America Cooling Tower Rental Industry Revenue (billion), by Country 2025 & 2033
- Figure 31: South America Cooling Tower Rental Industry Revenue Share (%), by Country 2025 & 2033
List of Tables
- Table 1: Global Cooling Tower Rental Industry Revenue billion Forecast, by Type 2020 & 2033
- Table 2: Global Cooling Tower Rental Industry Revenue billion Forecast, by End User 2020 & 2033
- Table 3: Global Cooling Tower Rental Industry Revenue billion Forecast, by Region 2020 & 2033
- Table 4: Global Cooling Tower Rental Industry Revenue billion Forecast, by Type 2020 & 2033
- Table 5: Global Cooling Tower Rental Industry Revenue billion Forecast, by End User 2020 & 2033
- Table 6: Global Cooling Tower Rental Industry Revenue billion Forecast, by Country 2020 & 2033
- Table 7: Global Cooling Tower Rental Industry Revenue billion Forecast, by Type 2020 & 2033
- Table 8: Global Cooling Tower Rental Industry Revenue billion Forecast, by End User 2020 & 2033
- Table 9: Global Cooling Tower Rental Industry Revenue billion Forecast, by Country 2020 & 2033
- Table 10: Global Cooling Tower Rental Industry Revenue billion Forecast, by Type 2020 & 2033
- Table 11: Global Cooling Tower Rental Industry Revenue billion Forecast, by End User 2020 & 2033
- Table 12: Global Cooling Tower Rental Industry Revenue billion Forecast, by Country 2020 & 2033
- Table 13: Global Cooling Tower Rental Industry Revenue billion Forecast, by Type 2020 & 2033
- Table 14: Global Cooling Tower Rental Industry Revenue billion Forecast, by End User 2020 & 2033
- Table 15: Global Cooling Tower Rental Industry Revenue billion Forecast, by Country 2020 & 2033
- Table 16: Global Cooling Tower Rental Industry Revenue billion Forecast, by Type 2020 & 2033
- Table 17: Global Cooling Tower Rental Industry Revenue billion Forecast, by End User 2020 & 2033
- Table 18: Global Cooling Tower Rental Industry Revenue billion Forecast, by Country 2020 & 2033
Frequently Asked Questions
1. What is the projected Compound Annual Growth Rate (CAGR) of the Cooling Tower Rental Industry?
The projected CAGR is approximately 6.2%.
2. Which companies are prominent players in the Cooling Tower Rental Industry?
Key companies in the market include SPX Cooling Technologies Inc, Johnson Controls International PLC, KTK KUHLTURM KARLSRUHE GMBH*List Not Exhaustive, Midwest Cooling Tower Services LLC, Cooling Tower Depot Inc, Caterpillar Inc, Aggreko PLC, Baltimore Aircoil Co, Carrier Rental Systems Inc, United Rentals Inc.
3. What are the main segments of the Cooling Tower Rental Industry?
The market segments include Type, End User.
4. Can you provide details about the market size?
The market size is estimated to be USD 1.39 billion as of 2022.
5. What are some drivers contributing to market growth?
4.; Favorable Government Policies.
6. What are the notable trends driving market growth?
Industrial Segment to Dominate the Market.
7. Are there any restraints impacting market growth?
4.; Rising Emphasis on Other Alternative Clean Energy Sources.
8. Can you provide examples of recent developments in the market?
Restrictions and impacts related to COVID-19 significantly reduced activities like air travel and commuting. This reduced the demand for fuels for transportation, and the shutdown restrictions on refineries affected the downstream sector in 2020. Since cooling towers play a major role in refinery operations, the shutdowns and reduced production rates affected the market for cooling tower rental.
9. What pricing options are available for accessing the report?
Pricing options include single-user, multi-user, and enterprise licenses priced at USD 4750, USD 5250, and USD 8750 respectively.
10. Is the market size provided in terms of value or volume?
The market size is provided in terms of value, measured in billion.
11. Are there any specific market keywords associated with the report?
Yes, the market keyword associated with the report is "Cooling Tower Rental Industry," which aids in identifying and referencing the specific market segment covered.
12. How do I determine which pricing option suits my needs best?
The pricing options vary based on user requirements and access needs. Individual users may opt for single-user licenses, while businesses requiring broader access may choose multi-user or enterprise licenses for cost-effective access to the report.
13. Are there any additional resources or data provided in the Cooling Tower Rental Industry report?
While the report offers comprehensive insights, it's advisable to review the specific contents or supplementary materials provided to ascertain if additional resources or data are available.
14. How can I stay updated on further developments or reports in the Cooling Tower Rental Industry?
To stay informed about further developments, trends, and reports in the Cooling Tower Rental Industry, consider subscribing to industry newsletters, following relevant companies and organizations, or regularly checking reputable industry news sources and publications.
Methodology
Step 1 - Identification of Relevant Samples Size from Population Database


Step 2 - Approaches for Defining Global Market Size (Value, Volume* & Price*)

Note*: In applicable scenarios
Step 3 - Data Sources
Primary Research
- Web Analytics
- Survey Reports
- Research Institute
- Latest Research Reports
- Opinion Leaders
Secondary Research
- Annual Reports
- White Paper
- Latest Press Release
- Industry Association
- Paid Database
- Investor Presentations

Step 4 - Data Triangulation
Involves using different sources of information in order to increase the validity of a study
These sources are likely to be stakeholders in a program - participants, other researchers, program staff, other community members, and so on.
Then we put all data in single framework & apply various statistical tools to find out the dynamic on the market.
During the analysis stage, feedback from the stakeholder groups would be compared to determine areas of agreement as well as areas of divergence