

Key Insights
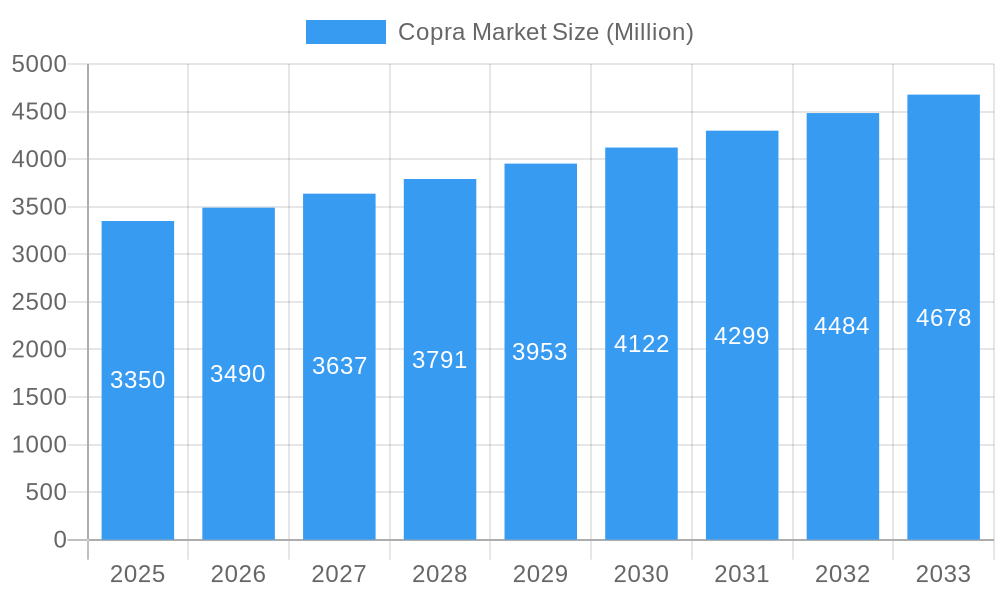
The global copra market, valued at $3.35 billion in 2025, is projected to experience steady growth, driven primarily by increasing demand from the food and beverage industry, particularly in the production of coconut oil and other coconut-derived products. The rising popularity of coconut-based products due to their perceived health benefits, including high levels of healthy fats and dietary fiber, fuels this demand. Growth is further propelled by the expanding cosmetics industry, which utilizes copra oil in various skincare and haircare products. While the animal feed segment contributes significantly, its growth trajectory is expected to be moderately paced compared to the food and beverage and cosmetics sectors. The market is segmented by product type (milling copra, ball copra, edible copra) and application, reflecting varied processing methods and end-use applications. Major players like Cargill, Sime Darby Plantation, and Adani Wilmar dominate the market landscape, leveraging their established supply chains and processing capabilities. Geographical distribution indicates significant market shares for regions like Asia-Pacific (driven by large-scale coconut production in countries like Indonesia and the Philippines), North America (driven by high consumption of coconut products), and Europe (driven by increasing health consciousness and demand for natural ingredients). However, fluctuating copra prices due to factors like weather patterns and global supply chain dynamics pose a potential restraint to market expansion. Furthermore, competition from alternative oils and ingredients presents a challenge.
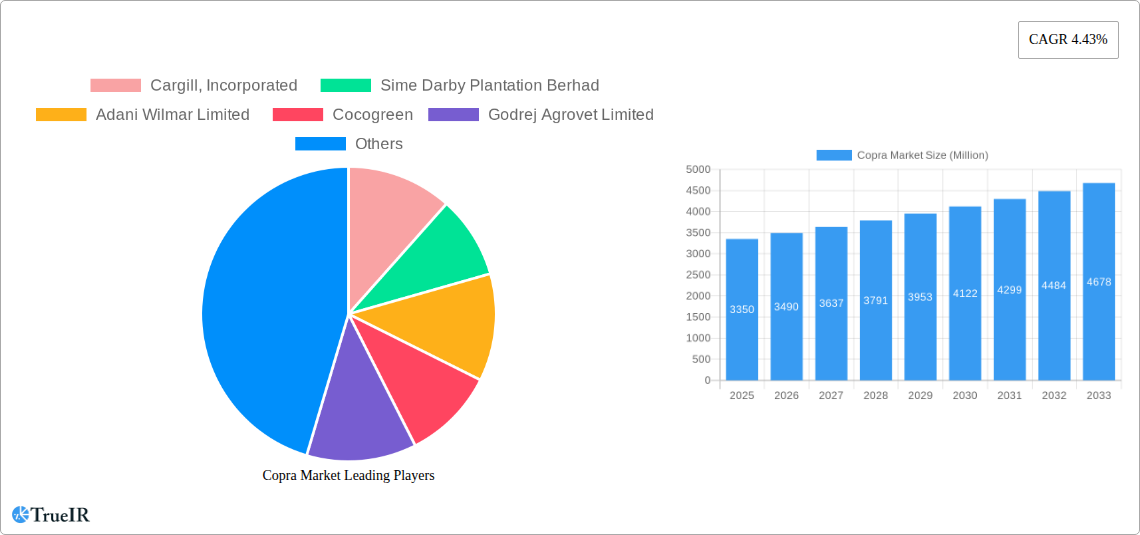
Copra Market Market Size (In Billion)
The projected Compound Annual Growth Rate (CAGR) of 4.43% from 2025 to 2033 suggests a continuous expansion of the copra market. However, achieving this growth will necessitate overcoming challenges such as sustainable sourcing and production practices, ensuring consistent quality, and addressing price volatility. Innovation in copra processing and the development of value-added copra products will play crucial roles in driving market growth. The increasing awareness of the environmental impact of agricultural practices will also influence market dynamics, pushing for the adoption of sustainable coconut farming techniques. The long-term outlook for the copra market remains positive, driven by a sustained increase in demand from key sectors and a growing appreciation for the versatility and beneficial properties of coconut products.
Copra Market Company Market Share
Dynamic Copra Market Report: 2019-2033 Forecast
This comprehensive report provides an in-depth analysis of the global copra market, offering invaluable insights for businesses, investors, and researchers. Covering the period from 2019 to 2033, with a focus on 2025, this report unveils the market's structure, competitive landscape, dominant segments, and future trajectory. Expect detailed analysis of market size (reaching xx Million by 2033), CAGR, and key trends impacting copra production and consumption across various applications. The report also highlights crucial industry developments and profiles key players such as Cargill, Incorporated, Sime Darby Plantation Berhad, Adani Wilmar Limited, Cocogreen, and Godrej Agrovet Limited.
Copra Market Market Structure & Competitive Landscape
The global copra market exhibits a moderately concentrated structure, with a few large players holding significant market share. The Herfindahl-Hirschman Index (HHI) for 2024 is estimated at xx, indicating a competitive yet consolidated market. Innovation in copra processing techniques, particularly in milling and extraction, drives market growth. Stringent regulatory frameworks concerning food safety and sustainability impact market operations. Product substitutes, such as vegetable oils, pose competitive pressure, particularly in certain applications like animal feed.
The market is segmented by product type (milling copra, ball copra, edible copra) and application (food and beverage, cosmetics, animal feed), with food and beverage dominating. End-users include food manufacturers, cosmetics manufacturers, and animal feed producers. Mergers and acquisitions (M&A) activity has been moderate in recent years, with approximately xx M&A deals recorded between 2019 and 2024, mostly involving smaller players consolidating within regional markets.
- Market Concentration: HHI of xx in 2024.
- Innovation Drivers: Improved extraction methods, sustainable farming practices.
- Regulatory Impacts: Food safety standards, environmental regulations.
- Product Substitutes: Vegetable oils, alternative fats.
- End-User Segmentation: Food manufacturers (xx% market share), Cosmetics manufacturers (xx%), Animal feed producers (xx%).
- M&A Trends: Approximately xx deals between 2019 and 2024, with consolidation among smaller players.
Copra Market Market Trends & Opportunities
The global copra market is experiencing substantial growth, driven by increasing demand from the food and beverage industry, particularly in developing economies. The market size reached xx Million in 2024 and is projected to reach xx Million by 2033, exhibiting a CAGR of xx% during the forecast period (2025-2033). Technological advancements in copra processing and extraction are improving efficiency and product quality. Consumer preferences for natural and sustainable products are fueling demand for copra-derived ingredients. The competitive landscape is characterized by both large multinational corporations and smaller regional players, leading to dynamic market interactions. Market penetration rates vary across regions and segments, with highest penetration observed in South Asia and Southeast Asia.
Dominant Markets & Segments in Copra Market
The Asia-Pacific region, particularly Southeast Asia and India, stands as the dominant force in the global copra market, accounting for an estimated XX% of global consumption in 2024. Within product types, milling copra commands the largest market share, a testament to its widespread and versatile applications across the food and animal feed industries. The food and beverage sector emerges as the most significant application segment, fueled by an escalating consumer appetite for coconut oil and a diverse array of coconut-derived products.
- Key Growth Drivers in Asia-Pacific:
- Deep-rooted historical foundation in coconut cultivation and robust production capacity.
- A burgeoning demand for coconut-based food products, reflecting evolving consumer preferences.
- Proactive government initiatives and support systems designed to bolster coconut farming across various nations.
- Continuous expansion of infrastructure dedicated to enhancing copra processing capabilities.
- Key Growth Drivers in India: A significant factor is the consistent increase in minimum support prices (MSP) for copra, incentivizing farmers and stabilizing supply.
- Key Growth Drivers in Southeast Asia: The region benefits from rising consumption of coconut oil, coupled with the strategic expansion of its food processing industries.
Copra Market Product Analysis
Copra processing technologies are continuously evolving, focusing on improving oil extraction efficiency and minimizing waste. Innovations include advanced milling techniques, solvent extraction methods, and sustainable processing practices. These advancements deliver higher oil yields, improved product quality, and reduced environmental impact. The market is witnessing a shift towards value-added copra products like refined coconut oil, coconut flour, and desiccated coconut, catering to diverse consumer needs. Competitive advantage hinges on efficient processing, sustainable sourcing, and consistent product quality.
Key Drivers, Barriers & Challenges in Copra Market
Key Drivers: The copra market is propelled by a confluence of factors including the surging global demand for coconut oil, a discernible shift in consumer preference towards natural and health-conscious food options, and ongoing technological advancements that are revolutionizing copra processing efficiency. Furthermore, government incentives, exemplified by the price support mechanisms introduced in Papua New Guinea, play a crucial role in stimulating production and market activity.
Challenges: The market faces headwinds from inherent price volatility in copra, largely influenced by unpredictable weather patterns and supply chain disruptions. Stringent regulatory frameworks governing food safety and environmental protection present ongoing compliance hurdles. Moreover, intense competition from alternative oils and fats exerts pressure on market dynamics. The cumulative impact of these challenges is projected to temper market growth by an estimated XX% annually in the short term.
Growth Drivers in the Copra Market Market
Rising global demand for coconut oil, fuelled by its perceived health benefits and versatile applications in food, cosmetics, and other industries, is a key driver. Technological advancements in efficient copra processing and extraction methods contribute to improved yields and product quality, boosting market growth. Government policies, like the increased minimum support prices (MSP) in India, stimulate domestic production and positively influence the market.
Challenges Impacting Copra Market Growth
The vulnerability of supply chains, particularly concerning the efficient transportation and storage of a perishable commodity like copra, presents substantial obstacles. Unpredictable fluctuations in coconut yields, often exacerbated by climatic variability, directly impact copra availability and consequently, price stability. Adhering to stringent regulatory compliance for food safety and environmental standards adds to production costs. The persistent competition from alternative oils and fats continues to place a constraint on overall market expansion.
Key Players Shaping the Copra Market Market
- Cargill, Incorporated
- Sime Darby Plantation Berhad
- Adani Wilmar Limited
- Cocogreen
- Godrej Agrovet Limited
Significant Copra Market Industry Milestones
- December 2022: The Indian government announced a notable increase in the minimum support price (MSP) for both milling copra and ball copra, by USD 3.3 (270 INR) and USD 9.05 (750 INR) respectively. This strategic move is anticipated to provide a positive impetus to copra production.
- January 2023: Papua New Guinea introduced a price incentive program for copra, with the primary objective of providing crucial support to local coconut farmers and fostering an increase in copra production volumes.
Future Outlook for Copra Market Market
The copra market is on a trajectory of sustained growth, propelled by an ever-increasing demand from a wide spectrum of industries and the continuous implementation of technological advancements that enhance both efficiency and sustainability. Strategic investments in upgrading copra processing infrastructure and championing sustainable farming methodologies are poised to unlock further market potential. Significant opportunities lie in the development of value-added copra products and the strategic expansion into nascent and emerging markets. The market is expected to experience substantial growth in the forthcoming years, with particularly promising prospects in emerging economies.
Copra Market Segmentation
- 1. Production Analysis
- 2. Consumption Analysis
- 3. Import Market Analysis (Value & Volume)
- 4. Export Market Analysis (Value & Volume)
- 5. Price Trend Analysis
Copra Market Segmentation By Geography
-
1. North America
- 1.1. United States
-
2. Europe
- 2.1. Germany
-
3. Asia Pacific
- 3.1. China
-
4. South America
- 4.1. Brazil
-
5. Middle East and Africa
- 5.1. South Africa
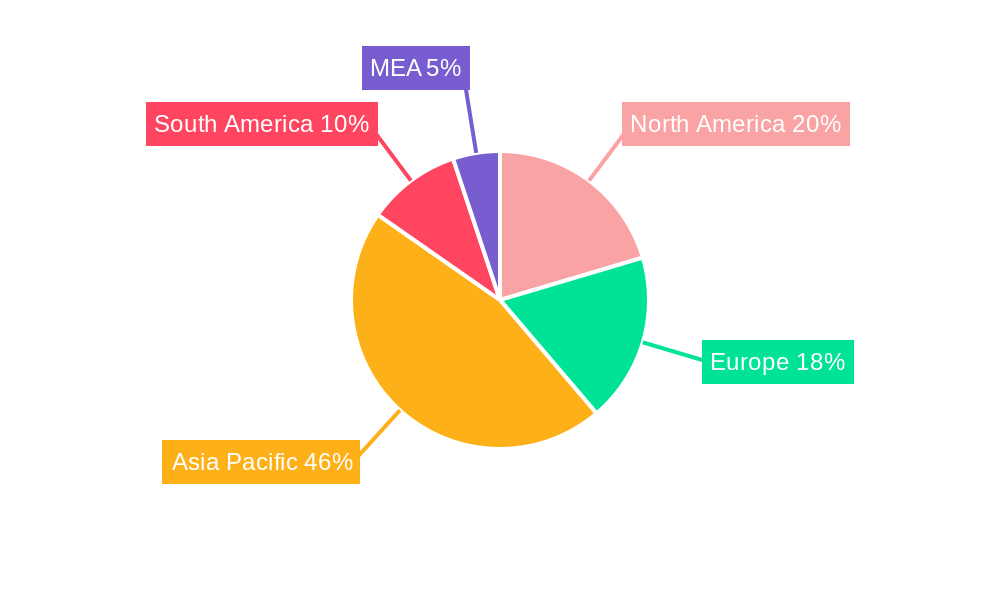
Copra Market Regional Market Share
Geographic Coverage of Copra Market
Copra Market REPORT HIGHLIGHTS
| Aspects | Details |
|---|---|
| Study Period | 2020-2034 |
| Base Year | 2025 |
| Estimated Year | 2026 |
| Forecast Period | 2026-2034 |
| Historical Period | 2020-2025 |
| Growth Rate | CAGR of 4.43% from 2020-2034 |
| Segmentation |
|
Table of Contents
- 1. Introduction
- 1.1. Research Scope
- 1.2. Market Segmentation
- 1.3. Research Methodology
- 1.4. Definitions and Assumptions
- 2. Executive Summary
- 2.1. Introduction
- 3. Market Dynamics
- 3.1. Introduction
- 3.2. Market Drivers
- 3.2.1. Increasing Demand for Garlic Due to Various Uses in Industries; Rising Demad of Organic Garlic; Increasing Government Initiatives
- 3.3. Market Restrains
- 3.3.1. Lack of Technical Knowledge of Farmers; Price Fluctuations
- 3.4. Market Trends
- 3.4.1. Growing Inclination towards Animal Sourced Food
- 4. Market Factor Analysis
- 4.1. Porters Five Forces
- 4.2. Supply/Value Chain
- 4.3. PESTEL analysis
- 4.4. Market Entropy
- 4.5. Patent/Trademark Analysis
- 5. Global Copra Market Analysis, Insights and Forecast, 2020-2032
- 5.1. Market Analysis, Insights and Forecast - by Production Analysis
- 5.2. Market Analysis, Insights and Forecast - by Consumption Analysis
- 5.3. Market Analysis, Insights and Forecast - by Import Market Analysis (Value & Volume)
- 5.4. Market Analysis, Insights and Forecast - by Export Market Analysis (Value & Volume)
- 5.5. Market Analysis, Insights and Forecast - by Price Trend Analysis
- 5.6. Market Analysis, Insights and Forecast - by Region
- 5.6.1. North America
- 5.6.2. Europe
- 5.6.3. Asia Pacific
- 5.6.4. South America
- 5.6.5. Middle East and Africa
- 5.1. Market Analysis, Insights and Forecast - by Production Analysis
- 6. North America Copra Market Analysis, Insights and Forecast, 2020-2032
- 6.1. Market Analysis, Insights and Forecast - by Production Analysis
- 6.2. Market Analysis, Insights and Forecast - by Consumption Analysis
- 6.3. Market Analysis, Insights and Forecast - by Import Market Analysis (Value & Volume)
- 6.4. Market Analysis, Insights and Forecast - by Export Market Analysis (Value & Volume)
- 6.5. Market Analysis, Insights and Forecast - by Price Trend Analysis
- 6.1. Market Analysis, Insights and Forecast - by Production Analysis
- 7. Europe Copra Market Analysis, Insights and Forecast, 2020-2032
- 7.1. Market Analysis, Insights and Forecast - by Production Analysis
- 7.2. Market Analysis, Insights and Forecast - by Consumption Analysis
- 7.3. Market Analysis, Insights and Forecast - by Import Market Analysis (Value & Volume)
- 7.4. Market Analysis, Insights and Forecast - by Export Market Analysis (Value & Volume)
- 7.5. Market Analysis, Insights and Forecast - by Price Trend Analysis
- 7.1. Market Analysis, Insights and Forecast - by Production Analysis
- 8. Asia Pacific Copra Market Analysis, Insights and Forecast, 2020-2032
- 8.1. Market Analysis, Insights and Forecast - by Production Analysis
- 8.2. Market Analysis, Insights and Forecast - by Consumption Analysis
- 8.3. Market Analysis, Insights and Forecast - by Import Market Analysis (Value & Volume)
- 8.4. Market Analysis, Insights and Forecast - by Export Market Analysis (Value & Volume)
- 8.5. Market Analysis, Insights and Forecast - by Price Trend Analysis
- 8.1. Market Analysis, Insights and Forecast - by Production Analysis
- 9. South America Copra Market Analysis, Insights and Forecast, 2020-2032
- 9.1. Market Analysis, Insights and Forecast - by Production Analysis
- 9.2. Market Analysis, Insights and Forecast - by Consumption Analysis
- 9.3. Market Analysis, Insights and Forecast - by Import Market Analysis (Value & Volume)
- 9.4. Market Analysis, Insights and Forecast - by Export Market Analysis (Value & Volume)
- 9.5. Market Analysis, Insights and Forecast - by Price Trend Analysis
- 9.1. Market Analysis, Insights and Forecast - by Production Analysis
- 10. Middle East and Africa Copra Market Analysis, Insights and Forecast, 2020-2032
- 10.1. Market Analysis, Insights and Forecast - by Production Analysis
- 10.2. Market Analysis, Insights and Forecast - by Consumption Analysis
- 10.3. Market Analysis, Insights and Forecast - by Import Market Analysis (Value & Volume)
- 10.4. Market Analysis, Insights and Forecast - by Export Market Analysis (Value & Volume)
- 10.5. Market Analysis, Insights and Forecast - by Price Trend Analysis
- 10.1. Market Analysis, Insights and Forecast - by Production Analysis
- 11. Competitive Analysis
- 11.1. Global Market Share Analysis 2025
- 11.2. Company Profiles
- 11.2.1 Cargill Incorporated
- 11.2.1.1. Overview
- 11.2.1.2. Products
- 11.2.1.3. SWOT Analysis
- 11.2.1.4. Recent Developments
- 11.2.1.5. Financials (Based on Availability)
- 11.2.2 Sime Darby Plantation Berhad
- 11.2.2.1. Overview
- 11.2.2.2. Products
- 11.2.2.3. SWOT Analysis
- 11.2.2.4. Recent Developments
- 11.2.2.5. Financials (Based on Availability)
- 11.2.3 Adani Wilmar Limited
- 11.2.3.1. Overview
- 11.2.3.2. Products
- 11.2.3.3. SWOT Analysis
- 11.2.3.4. Recent Developments
- 11.2.3.5. Financials (Based on Availability)
- 11.2.4 Cocogreen
- 11.2.4.1. Overview
- 11.2.4.2. Products
- 11.2.4.3. SWOT Analysis
- 11.2.4.4. Recent Developments
- 11.2.4.5. Financials (Based on Availability)
- 11.2.5 Godrej Agrovet Limited
- 11.2.5.1. Overview
- 11.2.5.2. Products
- 11.2.5.3. SWOT Analysis
- 11.2.5.4. Recent Developments
- 11.2.5.5. Financials (Based on Availability)
- 11.2.1 Cargill Incorporated
List of Figures
- Figure 1: Global Copra Market Revenue Breakdown (Million, %) by Region 2025 & 2033
- Figure 2: North America Copra Market Revenue (Million), by Production Analysis 2025 & 2033
- Figure 3: North America Copra Market Revenue Share (%), by Production Analysis 2025 & 2033
- Figure 4: North America Copra Market Revenue (Million), by Consumption Analysis 2025 & 2033
- Figure 5: North America Copra Market Revenue Share (%), by Consumption Analysis 2025 & 2033
- Figure 6: North America Copra Market Revenue (Million), by Import Market Analysis (Value & Volume) 2025 & 2033
- Figure 7: North America Copra Market Revenue Share (%), by Import Market Analysis (Value & Volume) 2025 & 2033
- Figure 8: North America Copra Market Revenue (Million), by Export Market Analysis (Value & Volume) 2025 & 2033
- Figure 9: North America Copra Market Revenue Share (%), by Export Market Analysis (Value & Volume) 2025 & 2033
- Figure 10: North America Copra Market Revenue (Million), by Price Trend Analysis 2025 & 2033
- Figure 11: North America Copra Market Revenue Share (%), by Price Trend Analysis 2025 & 2033
- Figure 12: North America Copra Market Revenue (Million), by Country 2025 & 2033
- Figure 13: North America Copra Market Revenue Share (%), by Country 2025 & 2033
- Figure 14: Europe Copra Market Revenue (Million), by Production Analysis 2025 & 2033
- Figure 15: Europe Copra Market Revenue Share (%), by Production Analysis 2025 & 2033
- Figure 16: Europe Copra Market Revenue (Million), by Consumption Analysis 2025 & 2033
- Figure 17: Europe Copra Market Revenue Share (%), by Consumption Analysis 2025 & 2033
- Figure 18: Europe Copra Market Revenue (Million), by Import Market Analysis (Value & Volume) 2025 & 2033
- Figure 19: Europe Copra Market Revenue Share (%), by Import Market Analysis (Value & Volume) 2025 & 2033
- Figure 20: Europe Copra Market Revenue (Million), by Export Market Analysis (Value & Volume) 2025 & 2033
- Figure 21: Europe Copra Market Revenue Share (%), by Export Market Analysis (Value & Volume) 2025 & 2033
- Figure 22: Europe Copra Market Revenue (Million), by Price Trend Analysis 2025 & 2033
- Figure 23: Europe Copra Market Revenue Share (%), by Price Trend Analysis 2025 & 2033
- Figure 24: Europe Copra Market Revenue (Million), by Country 2025 & 2033
- Figure 25: Europe Copra Market Revenue Share (%), by Country 2025 & 2033
- Figure 26: Asia Pacific Copra Market Revenue (Million), by Production Analysis 2025 & 2033
- Figure 27: Asia Pacific Copra Market Revenue Share (%), by Production Analysis 2025 & 2033
- Figure 28: Asia Pacific Copra Market Revenue (Million), by Consumption Analysis 2025 & 2033
- Figure 29: Asia Pacific Copra Market Revenue Share (%), by Consumption Analysis 2025 & 2033
- Figure 30: Asia Pacific Copra Market Revenue (Million), by Import Market Analysis (Value & Volume) 2025 & 2033
- Figure 31: Asia Pacific Copra Market Revenue Share (%), by Import Market Analysis (Value & Volume) 2025 & 2033
- Figure 32: Asia Pacific Copra Market Revenue (Million), by Export Market Analysis (Value & Volume) 2025 & 2033
- Figure 33: Asia Pacific Copra Market Revenue Share (%), by Export Market Analysis (Value & Volume) 2025 & 2033
- Figure 34: Asia Pacific Copra Market Revenue (Million), by Price Trend Analysis 2025 & 2033
- Figure 35: Asia Pacific Copra Market Revenue Share (%), by Price Trend Analysis 2025 & 2033
- Figure 36: Asia Pacific Copra Market Revenue (Million), by Country 2025 & 2033
- Figure 37: Asia Pacific Copra Market Revenue Share (%), by Country 2025 & 2033
- Figure 38: South America Copra Market Revenue (Million), by Production Analysis 2025 & 2033
- Figure 39: South America Copra Market Revenue Share (%), by Production Analysis 2025 & 2033
- Figure 40: South America Copra Market Revenue (Million), by Consumption Analysis 2025 & 2033
- Figure 41: South America Copra Market Revenue Share (%), by Consumption Analysis 2025 & 2033
- Figure 42: South America Copra Market Revenue (Million), by Import Market Analysis (Value & Volume) 2025 & 2033
- Figure 43: South America Copra Market Revenue Share (%), by Import Market Analysis (Value & Volume) 2025 & 2033
- Figure 44: South America Copra Market Revenue (Million), by Export Market Analysis (Value & Volume) 2025 & 2033
- Figure 45: South America Copra Market Revenue Share (%), by Export Market Analysis (Value & Volume) 2025 & 2033
- Figure 46: South America Copra Market Revenue (Million), by Price Trend Analysis 2025 & 2033
- Figure 47: South America Copra Market Revenue Share (%), by Price Trend Analysis 2025 & 2033
- Figure 48: South America Copra Market Revenue (Million), by Country 2025 & 2033
- Figure 49: South America Copra Market Revenue Share (%), by Country 2025 & 2033
- Figure 50: Middle East and Africa Copra Market Revenue (Million), by Production Analysis 2025 & 2033
- Figure 51: Middle East and Africa Copra Market Revenue Share (%), by Production Analysis 2025 & 2033
- Figure 52: Middle East and Africa Copra Market Revenue (Million), by Consumption Analysis 2025 & 2033
- Figure 53: Middle East and Africa Copra Market Revenue Share (%), by Consumption Analysis 2025 & 2033
- Figure 54: Middle East and Africa Copra Market Revenue (Million), by Import Market Analysis (Value & Volume) 2025 & 2033
- Figure 55: Middle East and Africa Copra Market Revenue Share (%), by Import Market Analysis (Value & Volume) 2025 & 2033
- Figure 56: Middle East and Africa Copra Market Revenue (Million), by Export Market Analysis (Value & Volume) 2025 & 2033
- Figure 57: Middle East and Africa Copra Market Revenue Share (%), by Export Market Analysis (Value & Volume) 2025 & 2033
- Figure 58: Middle East and Africa Copra Market Revenue (Million), by Price Trend Analysis 2025 & 2033
- Figure 59: Middle East and Africa Copra Market Revenue Share (%), by Price Trend Analysis 2025 & 2033
- Figure 60: Middle East and Africa Copra Market Revenue (Million), by Country 2025 & 2033
- Figure 61: Middle East and Africa Copra Market Revenue Share (%), by Country 2025 & 2033
List of Tables
- Table 1: Global Copra Market Revenue Million Forecast, by Production Analysis 2020 & 2033
- Table 2: Global Copra Market Revenue Million Forecast, by Consumption Analysis 2020 & 2033
- Table 3: Global Copra Market Revenue Million Forecast, by Import Market Analysis (Value & Volume) 2020 & 2033
- Table 4: Global Copra Market Revenue Million Forecast, by Export Market Analysis (Value & Volume) 2020 & 2033
- Table 5: Global Copra Market Revenue Million Forecast, by Price Trend Analysis 2020 & 2033
- Table 6: Global Copra Market Revenue Million Forecast, by Region 2020 & 2033
- Table 7: Global Copra Market Revenue Million Forecast, by Production Analysis 2020 & 2033
- Table 8: Global Copra Market Revenue Million Forecast, by Consumption Analysis 2020 & 2033
- Table 9: Global Copra Market Revenue Million Forecast, by Import Market Analysis (Value & Volume) 2020 & 2033
- Table 10: Global Copra Market Revenue Million Forecast, by Export Market Analysis (Value & Volume) 2020 & 2033
- Table 11: Global Copra Market Revenue Million Forecast, by Price Trend Analysis 2020 & 2033
- Table 12: Global Copra Market Revenue Million Forecast, by Country 2020 & 2033
- Table 13: United States Copra Market Revenue (Million) Forecast, by Application 2020 & 2033
- Table 14: Global Copra Market Revenue Million Forecast, by Production Analysis 2020 & 2033
- Table 15: Global Copra Market Revenue Million Forecast, by Consumption Analysis 2020 & 2033
- Table 16: Global Copra Market Revenue Million Forecast, by Import Market Analysis (Value & Volume) 2020 & 2033
- Table 17: Global Copra Market Revenue Million Forecast, by Export Market Analysis (Value & Volume) 2020 & 2033
- Table 18: Global Copra Market Revenue Million Forecast, by Price Trend Analysis 2020 & 2033
- Table 19: Global Copra Market Revenue Million Forecast, by Country 2020 & 2033
- Table 20: Germany Copra Market Revenue (Million) Forecast, by Application 2020 & 2033
- Table 21: Global Copra Market Revenue Million Forecast, by Production Analysis 2020 & 2033
- Table 22: Global Copra Market Revenue Million Forecast, by Consumption Analysis 2020 & 2033
- Table 23: Global Copra Market Revenue Million Forecast, by Import Market Analysis (Value & Volume) 2020 & 2033
- Table 24: Global Copra Market Revenue Million Forecast, by Export Market Analysis (Value & Volume) 2020 & 2033
- Table 25: Global Copra Market Revenue Million Forecast, by Price Trend Analysis 2020 & 2033
- Table 26: Global Copra Market Revenue Million Forecast, by Country 2020 & 2033
- Table 27: China Copra Market Revenue (Million) Forecast, by Application 2020 & 2033
- Table 28: Global Copra Market Revenue Million Forecast, by Production Analysis 2020 & 2033
- Table 29: Global Copra Market Revenue Million Forecast, by Consumption Analysis 2020 & 2033
- Table 30: Global Copra Market Revenue Million Forecast, by Import Market Analysis (Value & Volume) 2020 & 2033
- Table 31: Global Copra Market Revenue Million Forecast, by Export Market Analysis (Value & Volume) 2020 & 2033
- Table 32: Global Copra Market Revenue Million Forecast, by Price Trend Analysis 2020 & 2033
- Table 33: Global Copra Market Revenue Million Forecast, by Country 2020 & 2033
- Table 34: Brazil Copra Market Revenue (Million) Forecast, by Application 2020 & 2033
- Table 35: Global Copra Market Revenue Million Forecast, by Production Analysis 2020 & 2033
- Table 36: Global Copra Market Revenue Million Forecast, by Consumption Analysis 2020 & 2033
- Table 37: Global Copra Market Revenue Million Forecast, by Import Market Analysis (Value & Volume) 2020 & 2033
- Table 38: Global Copra Market Revenue Million Forecast, by Export Market Analysis (Value & Volume) 2020 & 2033
- Table 39: Global Copra Market Revenue Million Forecast, by Price Trend Analysis 2020 & 2033
- Table 40: Global Copra Market Revenue Million Forecast, by Country 2020 & 2033
- Table 41: South Africa Copra Market Revenue (Million) Forecast, by Application 2020 & 2033
Frequently Asked Questions
1. What is the projected Compound Annual Growth Rate (CAGR) of the Copra Market?
The projected CAGR is approximately 4.43%.
2. Which companies are prominent players in the Copra Market?
Key companies in the market include Cargill, Incorporated , Sime Darby Plantation Berhad , Adani Wilmar Limited , Cocogreen, Godrej Agrovet Limited .
3. What are the main segments of the Copra Market?
The market segments include Production Analysis, Consumption Analysis, Import Market Analysis (Value & Volume), Export Market Analysis (Value & Volume), Price Trend Analysis.
4. Can you provide details about the market size?
The market size is estimated to be USD 3.35 Million as of 2022.
5. What are some drivers contributing to market growth?
Increasing Demand for Garlic Due to Various Uses in Industries; Rising Demad of Organic Garlic; Increasing Government Initiatives.
6. What are the notable trends driving market growth?
Growing Inclination towards Animal Sourced Food.
7. Are there any restraints impacting market growth?
Lack of Technical Knowledge of Farmers; Price Fluctuations.
8. Can you provide examples of recent developments in the market?
January 2023: The Papua New Guinea Minister for Agriculture implemented a price incentive for copra. Minister for Agriculture Aiya Tambua announced the new price support for copra or coconut farmers in the country.
9. What pricing options are available for accessing the report?
Pricing options include single-user, multi-user, and enterprise licenses priced at USD 4750, USD 5250, and USD 8750 respectively.
10. Is the market size provided in terms of value or volume?
The market size is provided in terms of value, measured in Million.
11. Are there any specific market keywords associated with the report?
Yes, the market keyword associated with the report is "Copra Market," which aids in identifying and referencing the specific market segment covered.
12. How do I determine which pricing option suits my needs best?
The pricing options vary based on user requirements and access needs. Individual users may opt for single-user licenses, while businesses requiring broader access may choose multi-user or enterprise licenses for cost-effective access to the report.
13. Are there any additional resources or data provided in the Copra Market report?
While the report offers comprehensive insights, it's advisable to review the specific contents or supplementary materials provided to ascertain if additional resources or data are available.
14. How can I stay updated on further developments or reports in the Copra Market?
To stay informed about further developments, trends, and reports in the Copra Market, consider subscribing to industry newsletters, following relevant companies and organizations, or regularly checking reputable industry news sources and publications.
Methodology
Step 1 - Identification of Relevant Samples Size from Population Database


Step 2 - Approaches for Defining Global Market Size (Value, Volume* & Price*)

Note*: In applicable scenarios
Step 3 - Data Sources
Primary Research
- Web Analytics
- Survey Reports
- Research Institute
- Latest Research Reports
- Opinion Leaders
Secondary Research
- Annual Reports
- White Paper
- Latest Press Release
- Industry Association
- Paid Database
- Investor Presentations

Step 4 - Data Triangulation
Involves using different sources of information in order to increase the validity of a study
These sources are likely to be stakeholders in a program - participants, other researchers, program staff, other community members, and so on.
Then we put all data in single framework & apply various statistical tools to find out the dynamic on the market.
During the analysis stage, feedback from the stakeholder groups would be compared to determine areas of agreement as well as areas of divergence