

Key Insights
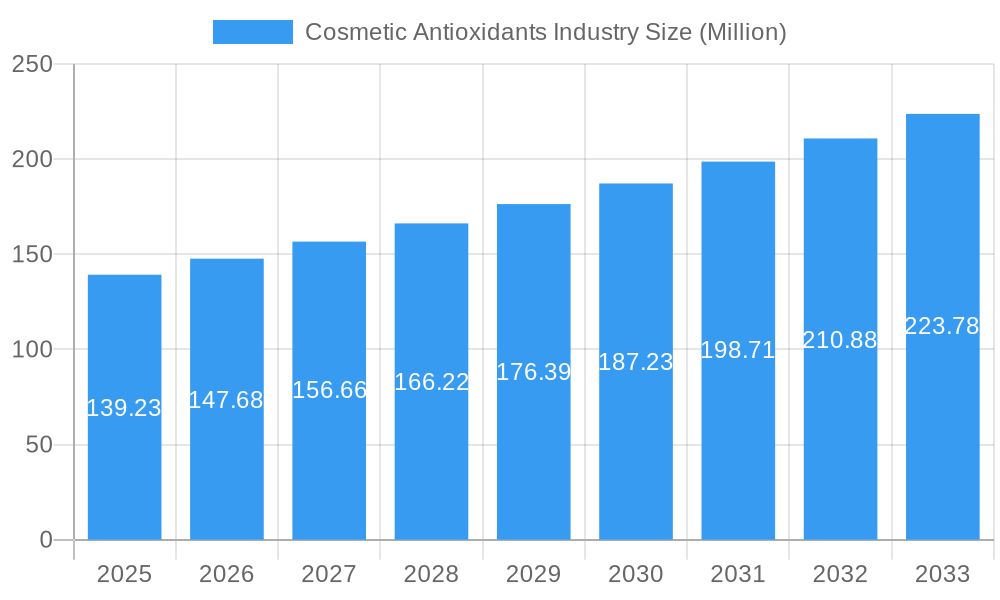
The global cosmetic antioxidants market, valued at $139.23 million in 2025, is projected to experience robust growth, driven by increasing consumer awareness of skincare benefits and the rising demand for natural and sustainable cosmetic products. A compound annual growth rate (CAGR) of 5.95% from 2025 to 2033 indicates a significant market expansion, exceeding $200 million by the end of the forecast period. Key drivers include the growing prevalence of skin aging concerns, increasing disposable incomes in emerging economies fueling premium cosmetic purchases, and the ongoing innovation in antioxidant formulations, particularly those derived from natural sources. The market segmentation reveals a strong preference for naturally-derived antioxidants, reflecting the broader consumer trend towards clean beauty and ingredient transparency. Vitamins and polyphenols dominate the types segment, while skin care constitutes the largest application area, indicating substantial growth potential in this sector. Leading companies like DSM, Lonza, and Kemin Industries are actively investing in research and development to enhance the efficacy and sustainability of their offerings, further solidifying market competition. The Asia-Pacific region, especially China and India, is expected to witness significant growth due to a burgeoning middle class and rising demand for cosmetic products.
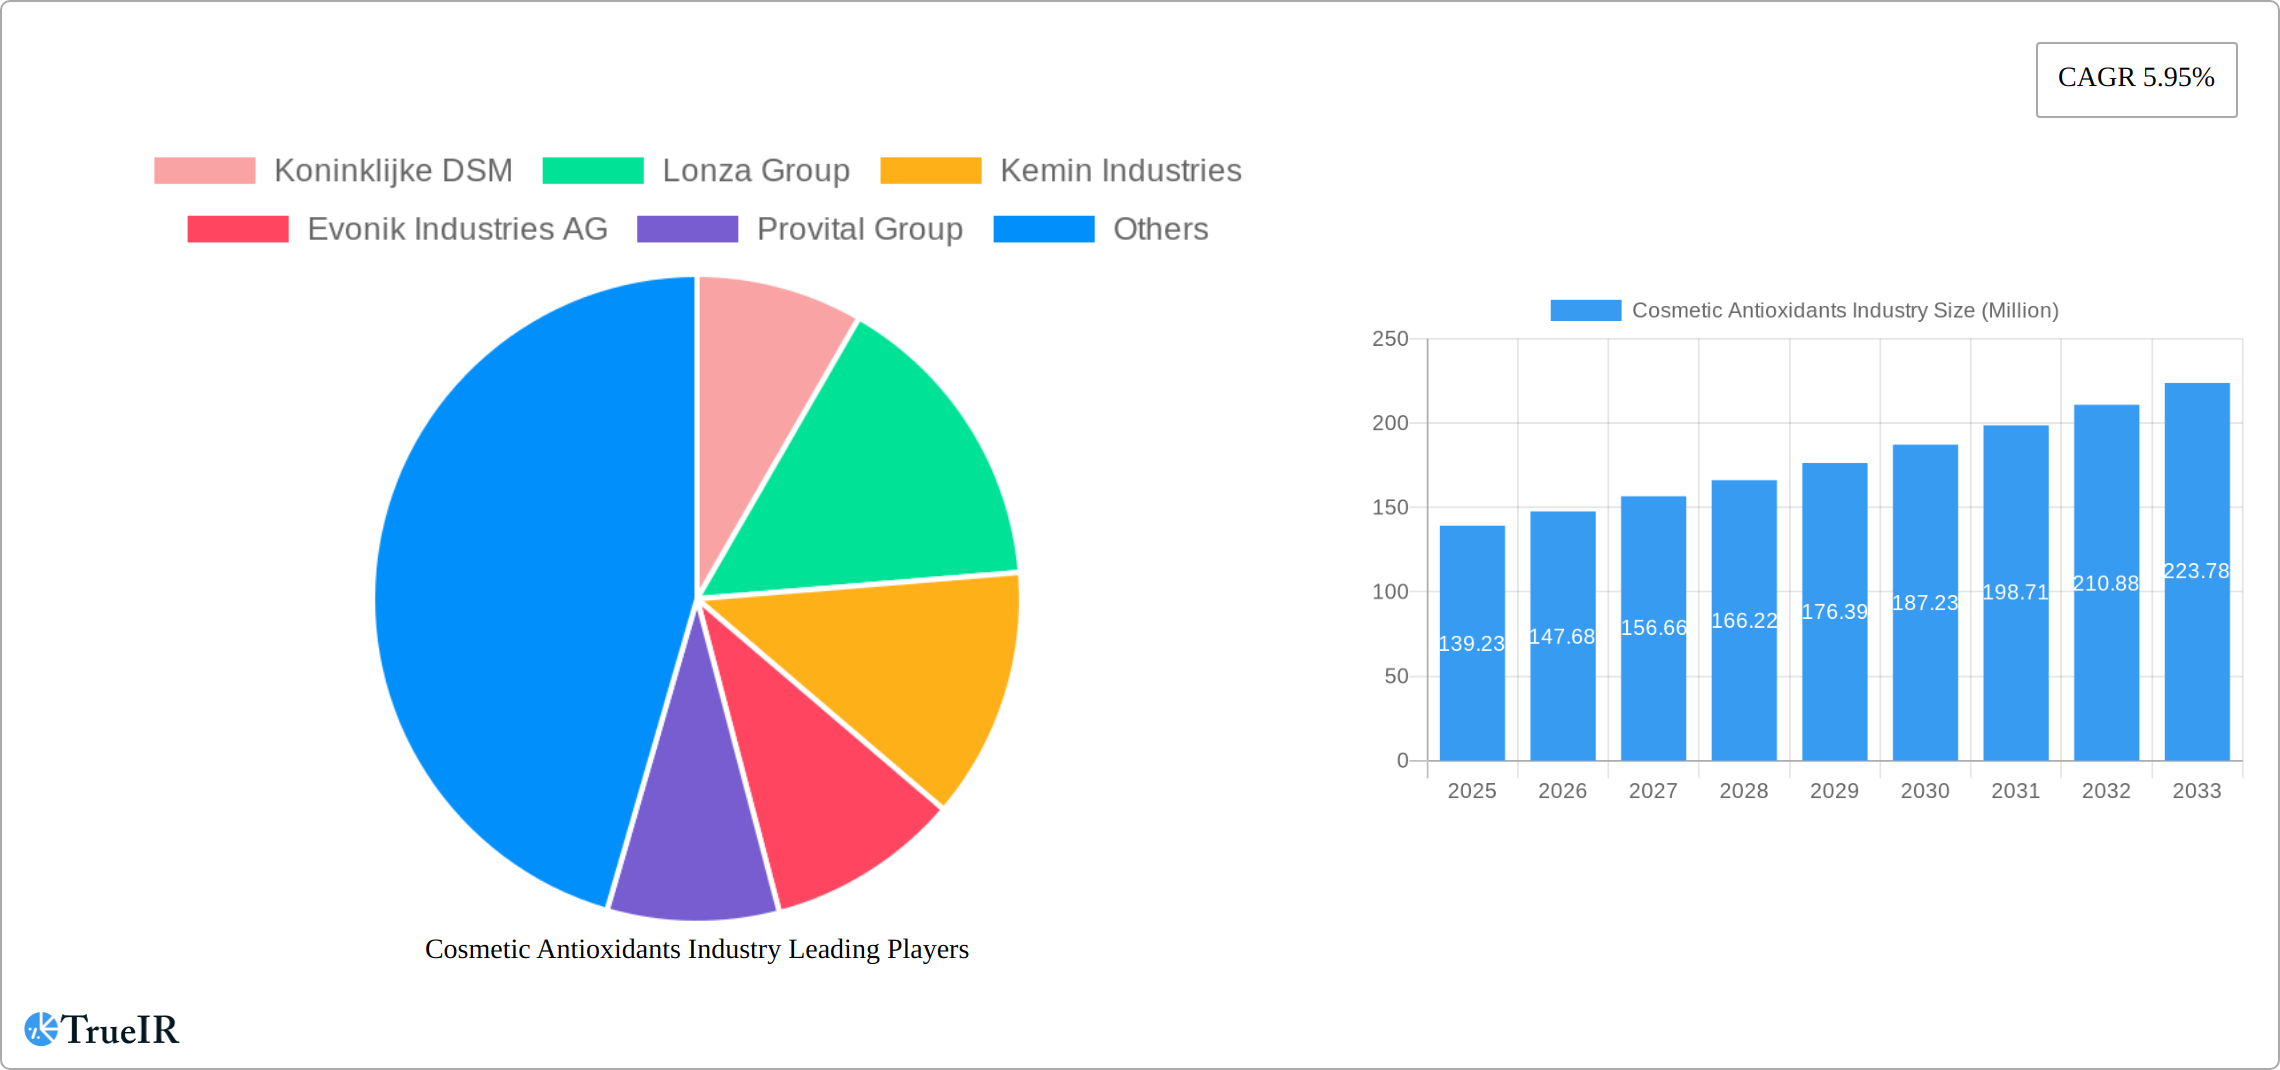
Cosmetic Antioxidants Industry Market Size (In Million)
The competitive landscape is characterized by a mix of large multinational corporations and specialized ingredient suppliers. These companies are strategically focusing on partnerships and acquisitions to expand their product portfolio and geographical reach. The restraints to market growth are primarily associated with stringent regulatory compliance requirements for cosmetic ingredients and fluctuating raw material prices. However, innovative solutions like encapsulated antioxidants and targeted delivery systems are likely to overcome these challenges, creating new opportunities for market expansion. The continuous research into the efficacy of various antioxidant types and their applications in different cosmetic formulations is further driving market growth. The focus on personalized skincare and the increasing use of cosmetic antioxidants in injectables and other advanced cosmetic procedures are also contributing factors. Future growth will depend on the successful development and commercialization of effective and sustainable antioxidant-based products which cater to the evolving demands of the consumer market.
Cosmetic Antioxidants Industry Company Market Share
Cosmetic Antioxidants Industry Market Report: 2019-2033
This comprehensive report provides an in-depth analysis of the global cosmetic antioxidants market, projecting robust growth from 2019 to 2033. With a focus on key market segments, leading players, and emerging trends, this report is an essential resource for industry stakeholders, investors, and researchers seeking actionable insights into this dynamic sector. The report covers a market valued at $XX Million in 2025, with a projected Compound Annual Growth Rate (CAGR) of XX% from 2025 to 2033.
Cosmetic Antioxidants Industry Market Structure & Competitive Landscape
The cosmetic antioxidants market presents a moderately consolidated structure, dominated by several multinational corporations wielding significant market share. Key players such as Koninklijke DSM, Lonza Group, Kemin Industries, Evonik Industries AG, and BASF SE engage in intense competition, fueling innovation and shaping market dynamics. While a precise Herfindahl-Hirschman Index (HHI) is proprietary, the market's moderately concentrated nature is evident in the significant share held by a limited number of players.
- Market Concentration: The leading five players command a substantial portion of the global market share (precise figures are commercially sensitive but suggest a considerable level of concentration).
- Innovation Drivers: Market growth is fueled by continuous advancements in antioxidant formulations, prioritizing efficacy, stability, and sustainability. This includes the development of innovative delivery systems (e.g., liposomes, nanoemulsions) and eco-conscious extraction methods (e.g., supercritical CO2 extraction).
- Regulatory Impacts: Stringent regulations regarding ingredient safety and labeling (e.g., EU's COSMOS standard, FDA regulations) significantly influence market dynamics, favoring companies with robust compliance and regulatory expertise.
- Product Substitutes: Although alternatives exist, the unique properties of cosmetic antioxidants – their potent free radical scavenging abilities and diverse applications – make them difficult to completely replace. Competition arises primarily from other cosmetic ingredients with comparable functions, but often lack the established efficacy and safety profiles of established antioxidants.
- End-User Segmentation: The market is segmented by application (skincare, haircare, makeup, injectables, and others), with skincare currently holding the largest share. The rising demand for natural and organic cosmetics is a substantial growth driver, impacting ingredient sourcing and formulation choices.
- M&A Trends: Recent years have witnessed a considerable number of mergers and acquisitions (M&A) activities, reflecting a strategy to expand product portfolios, enhance geographical reach, and bolster market presence. This consolidation trend is expected to continue as the industry matures and seeks economies of scale. (Specific M&A data is commercially sensitive but reveals an active and growing trend).
Cosmetic Antioxidants Industry Market Trends & Opportunities
The cosmetic antioxidants market is experiencing robust growth, driven by increasing consumer demand for anti-aging and skin protection products. This demand is fueled by heightened awareness of the detrimental effects of free radicals and the desire for healthier, more youthful-looking skin. The market demonstrates a strong inclination towards natural and sustainably sourced antioxidants, aligning with the broader trend towards clean beauty. Furthermore, technological advancements in encapsulation and delivery systems are enhancing the efficacy and stability of antioxidant products, opening new avenues for innovation.
Market expansion is significantly propelled by the increased adoption of natural and organic products, coupled with rising disposable incomes, particularly in developing economies. Continuous improvements in extraction and formulation techniques are yielding more effective and stable antioxidant products, creating lucrative opportunities. The growing incidence of skin-related concerns, such as premature aging and hyperpigmentation, further accelerates market growth. The penetration rate of cosmetic antioxidants in skincare currently stands at a significant level (precise figures are commercially sensitive), with substantial untapped potential in hair care, makeup, and other segments. The compound annual growth rate (CAGR) during the forecast period is projected to be robust (precise figures are commercially sensitive), indicating promising growth prospects. However, the competitive landscape necessitates continuous innovation and product differentiation to secure market share and capitalize on emerging opportunities.
Dominant Markets & Segments in Cosmetic Antioxidants Industry
The skincare segment reigns supreme in the cosmetic antioxidants market, driven by the considerable demand for anti-aging and sun protection products. Within the ingredient source category, the demand for natural antioxidants is surging, reflecting the rising consumer preference for clean and sustainable beauty products. Vitamins and polyphenols currently hold dominant positions, owing to their established efficacy and wide-ranging applications in various cosmetic formulations.
- Leading Region/Country: North America and Europe currently command the largest market share, underpinned by high consumer spending on beauty and personal care products and a strong emphasis on skincare solutions. However, the Asia-Pacific region is poised for the fastest growth rate during the forecast period, fueled by its expanding middle class and evolving consumer preferences.
- Key Growth Drivers:
- Rising disposable incomes and increasing consumer awareness of skincare benefits: Consumers are increasingly willing to invest in products that address their skincare concerns.
- Growing preference for natural and organic cosmetics: The demand for clean and sustainable beauty products is a major market driver.
- Technological advancements in extraction and formulation: Innovations in technology lead to more effective and stable antioxidant products.
- Favorable government regulations and policies in key regions: Supportive regulatory environments facilitate market growth.
Detailed Analysis: Skincare's dominance stems from heightened consumer awareness of sun damage, premature aging, and the importance of proactive skincare. The shift towards natural antioxidants reflects a consumer desire for cleaner beauty products perceived as gentler and safer. Vitamins (notably Vitamin C and E) and polyphenols maintain their leading positions due to their proven antioxidant properties and versatility. The projected growth in the Asia-Pacific region is attributed to the burgeoning middle class, evolving consumer lifestyles, and the increasing adoption of global beauty trends.
Cosmetic Antioxidants Industry Product Analysis
The cosmetic antioxidants market showcases continuous innovation in product formulations, including the development of liposomal and nano-encapsulated antioxidants to enhance stability and delivery efficacy. Companies are investing heavily in research and development to create more effective and sustainable products that cater to the increasing demand for natural and organic cosmetics. These innovations are driving market growth and improving the overall consumer experience by addressing issues like skin irritation and product efficacy. Competitive advantages lie in securing sustainable and high-quality raw materials and developing unique formulations and delivery systems with demonstrably superior performance.
Key Drivers, Barriers & Challenges in Cosmetic Antioxidants Industry
Key Drivers:
- Growing demand for anti-aging and sun protection products
- Increasing preference for natural and organic cosmetics
- Technological advancements in product formulation and delivery systems
Challenges and Restraints:
- Fluctuations in raw material prices: Raw material price volatility can impact profitability and product pricing.
- Stringent regulatory requirements: Compliance with safety and labeling regulations presents a challenge for companies, especially those operating in multiple regions.
- Intense competition: Competition from established players and emerging brands requires continuous innovation and product differentiation.
Growth Drivers in the Cosmetic Antioxidants Industry Market
The market is driven by a confluence of factors: the rising demand for anti-aging and skin protection products, a growing preference for natural and ethically sourced ingredients, and ongoing technological advancements that enhance product efficacy and stability. Favorable government regulations promoting sustainable practices also contribute to growth.
Challenges Impacting Cosmetic Antioxidants Industry Growth
Key challenges include fluctuating raw material prices, particularly for natural ingredients, stringent regulations requiring extensive compliance efforts, and fierce competition among established players and new entrants. Supply chain disruptions, especially concerning the sourcing of natural ingredients, can impact production and delivery schedules, demanding robust and diversified sourcing strategies. These pressures necessitate strategic sourcing, rigorous quality control, and effective regulatory compliance strategies to mitigate risks and sustain market competitiveness.
Key Players Shaping the Cosmetic Antioxidants Industry Market
- Koninklijke DSM
- Lonza Group
- Kemin Industries
- Evonik Industries AG
- Provital Group
- Croda International Plc
- BASF SE
- Eastman Chemical Company
- BTSA Biotecnologias Aplicadas
- Wacker Chemie AG
- List Not Exhaustive
Significant Cosmetic Antioxidants Industry Industry Milestones
- October 2023: BASF's Care Chemicals division invests in a new plant to produce emollient specialties for skin and sun protection products, signifying a commitment to expanding its presence in the cosmetic antioxidants market.
- June 2023: DKSH's exclusive distribution agreement with Bitop expands the reach of cosmetic ingredients in key Asian markets, showcasing growing demand in the region.
Future Outlook for Cosmetic Antioxidants Industry Market
The cosmetic antioxidants market is poised for sustained growth, driven by ongoing demand for effective skincare solutions and a rising preference for natural and sustainable products. Strategic investments in research and development (R&D) to develop novel antioxidants and delivery systems, expansion into high-growth emerging markets, and strategic partnerships to access new technologies or distribution channels present substantial opportunities for market participants. The burgeoning trend towards personalized and customized skincare routines is also expected to fuel growth in the coming years, emphasizing the importance of tailored solutions.
Cosmetic Antioxidants Industry Segmentation
-
1. Source
- 1.1. Natural
- 1.2. Chemically Derived
-
2. Type
- 2.1. Vitamins
- 2.2. Polyphenols
- 2.3. Enzymes
- 2.4. Carotenoids
- 2.5. Other Ty
-
3. Application
- 3.1. Skin Care
- 3.2. Hair Care
- 3.3. Injectables
- 3.4. Other Applications (Makeup and Body care)
Cosmetic Antioxidants Industry Segmentation By Geography
-
1. Asia Pacific
- 1.1. China
- 1.2. India
- 1.3. Japan
- 1.4. South Korea
- 1.5. Rest of Asia Pacific
-
2. North America
- 2.1. United States
- 2.2. Canada
- 2.3. Mexico
-
3. Europe
- 3.1. Germany
- 3.2. United Kingdom
- 3.3. Italy
- 3.4. France
- 3.5. Rest of Europe
-
4. South America
- 4.1. Brazil
- 4.2. Argentina
- 4.3. Rest of South America
-
5. Middle East and Africa
- 5.1. Saudi Arabia
- 5.2. South Africa
- 5.3. Rest of Middle East and Africa
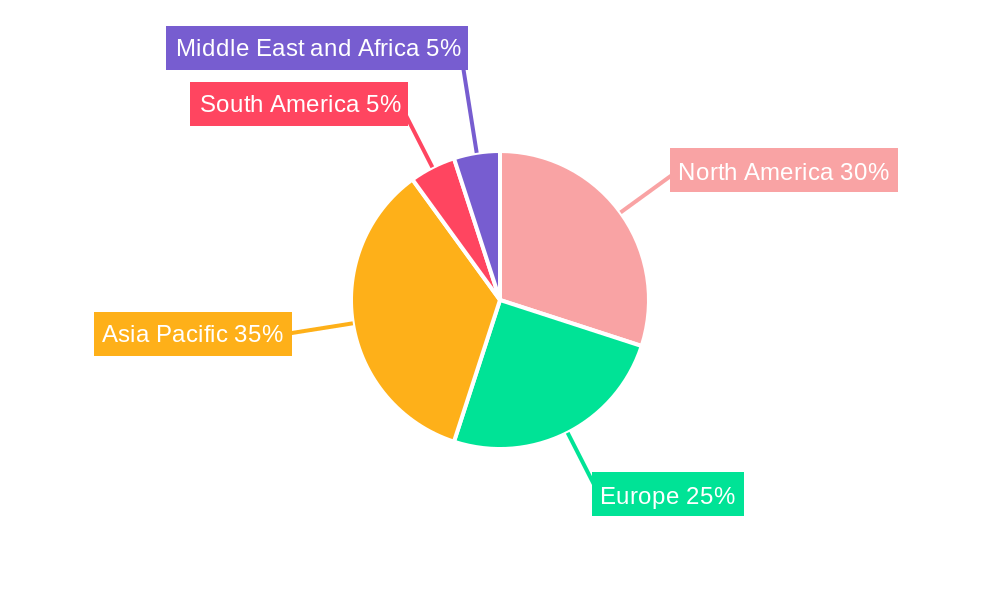
Cosmetic Antioxidants Industry Regional Market Share
Geographic Coverage of Cosmetic Antioxidants Industry
Cosmetic Antioxidants Industry REPORT HIGHLIGHTS
| Aspects | Details |
|---|---|
| Study Period | 2020-2034 |
| Base Year | 2025 |
| Estimated Year | 2026 |
| Forecast Period | 2026-2034 |
| Historical Period | 2020-2025 |
| Growth Rate | CAGR of 5.95% from 2020-2034 |
| Segmentation |
|
Table of Contents
- 1. Introduction
- 1.1. Research Scope
- 1.2. Market Segmentation
- 1.3. Research Objective
- 1.4. Definitions and Assumptions
- 2. Executive Summary
- 2.1. Market Snapshot
- 3. Market Dynamics
- 3.1. Market Drivers
- 3.2. Market Restrains
- 3.3. Market Trends
- 3.4. Market Opportunities
- 4. Market Factor Analysis
- 4.1. Porters Five Forces
- 4.1.1. Bargaining Power of Suppliers
- 4.1.2. Bargaining Power of Buyers
- 4.1.3. Threat of New Entrants
- 4.1.4. Threat of Substitutes
- 4.1.5. Competitive Rivalry
- 4.2. PESTEL analysis
- 4.3. BCG Analysis
- 4.3.1. Stars (High Growth, High Market Share)
- 4.3.2. Cash Cows (Low Growth, High Market Share)
- 4.3.3. Question Mark (High Growth, Low Market Share)
- 4.3.4. Dogs (Low Growth, Low Market Share)
- 4.4. Ansoff Matrix Analysis
- 4.5. Supply Chain Analysis
- 4.6. Regulatory Landscape
- 4.7. Current Market Potential and Opportunity Assessment (TAM–SAM–SOM Framework)
- 4.8. TIR Analyst Note
- 4.1. Porters Five Forces
- 5. Market Analysis, Insights and Forecast 2021-2033
- 5.1. Market Analysis, Insights and Forecast - by Source
- 5.1.1. Natural
- 5.1.2. Chemically Derived
- 5.2. Market Analysis, Insights and Forecast - by Type
- 5.2.1. Vitamins
- 5.2.2. Polyphenols
- 5.2.3. Enzymes
- 5.2.4. Carotenoids
- 5.2.5. Other Ty
- 5.3. Market Analysis, Insights and Forecast - by Application
- 5.3.1. Skin Care
- 5.3.2. Hair Care
- 5.3.3. Injectables
- 5.3.4. Other Applications (Makeup and Body care)
- 5.4. Market Analysis, Insights and Forecast - by Region
- 5.4.1. Asia Pacific
- 5.4.2. North America
- 5.4.3. Europe
- 5.4.4. South America
- 5.4.5. Middle East and Africa
- 5.1. Market Analysis, Insights and Forecast - by Source
- 6. Global Cosmetic Antioxidants Industry Analysis, Insights and Forecast, 2021-2033
- 6.1. Market Analysis, Insights and Forecast - by Source
- 6.1.1. Natural
- 6.1.2. Chemically Derived
- 6.2. Market Analysis, Insights and Forecast - by Type
- 6.2.1. Vitamins
- 6.2.2. Polyphenols
- 6.2.3. Enzymes
- 6.2.4. Carotenoids
- 6.2.5. Other Ty
- 6.3. Market Analysis, Insights and Forecast - by Application
- 6.3.1. Skin Care
- 6.3.2. Hair Care
- 6.3.3. Injectables
- 6.3.4. Other Applications (Makeup and Body care)
- 6.1. Market Analysis, Insights and Forecast - by Source
- 7. Asia Pacific Cosmetic Antioxidants Industry Analysis, Insights and Forecast, 2020-2032
- 7.1. Market Analysis, Insights and Forecast - by Source
- 7.1.1. Natural
- 7.1.2. Chemically Derived
- 7.2. Market Analysis, Insights and Forecast - by Type
- 7.2.1. Vitamins
- 7.2.2. Polyphenols
- 7.2.3. Enzymes
- 7.2.4. Carotenoids
- 7.2.5. Other Ty
- 7.3. Market Analysis, Insights and Forecast - by Application
- 7.3.1. Skin Care
- 7.3.2. Hair Care
- 7.3.3. Injectables
- 7.3.4. Other Applications (Makeup and Body care)
- 7.1. Market Analysis, Insights and Forecast - by Source
- 8. North America Cosmetic Antioxidants Industry Analysis, Insights and Forecast, 2020-2032
- 8.1. Market Analysis, Insights and Forecast - by Source
- 8.1.1. Natural
- 8.1.2. Chemically Derived
- 8.2. Market Analysis, Insights and Forecast - by Type
- 8.2.1. Vitamins
- 8.2.2. Polyphenols
- 8.2.3. Enzymes
- 8.2.4. Carotenoids
- 8.2.5. Other Ty
- 8.3. Market Analysis, Insights and Forecast - by Application
- 8.3.1. Skin Care
- 8.3.2. Hair Care
- 8.3.3. Injectables
- 8.3.4. Other Applications (Makeup and Body care)
- 8.1. Market Analysis, Insights and Forecast - by Source
- 9. Europe Cosmetic Antioxidants Industry Analysis, Insights and Forecast, 2020-2032
- 9.1. Market Analysis, Insights and Forecast - by Source
- 9.1.1. Natural
- 9.1.2. Chemically Derived
- 9.2. Market Analysis, Insights and Forecast - by Type
- 9.2.1. Vitamins
- 9.2.2. Polyphenols
- 9.2.3. Enzymes
- 9.2.4. Carotenoids
- 9.2.5. Other Ty
- 9.3. Market Analysis, Insights and Forecast - by Application
- 9.3.1. Skin Care
- 9.3.2. Hair Care
- 9.3.3. Injectables
- 9.3.4. Other Applications (Makeup and Body care)
- 9.1. Market Analysis, Insights and Forecast - by Source
- 10. South America Cosmetic Antioxidants Industry Analysis, Insights and Forecast, 2020-2032
- 10.1. Market Analysis, Insights and Forecast - by Source
- 10.1.1. Natural
- 10.1.2. Chemically Derived
- 10.2. Market Analysis, Insights and Forecast - by Type
- 10.2.1. Vitamins
- 10.2.2. Polyphenols
- 10.2.3. Enzymes
- 10.2.4. Carotenoids
- 10.2.5. Other Ty
- 10.3. Market Analysis, Insights and Forecast - by Application
- 10.3.1. Skin Care
- 10.3.2. Hair Care
- 10.3.3. Injectables
- 10.3.4. Other Applications (Makeup and Body care)
- 10.1. Market Analysis, Insights and Forecast - by Source
- 11. Middle East and Africa Cosmetic Antioxidants Industry Analysis, Insights and Forecast, 2020-2032
- 11.1. Market Analysis, Insights and Forecast - by Source
- 11.1.1. Natural
- 11.1.2. Chemically Derived
- 11.2. Market Analysis, Insights and Forecast - by Type
- 11.2.1. Vitamins
- 11.2.2. Polyphenols
- 11.2.3. Enzymes
- 11.2.4. Carotenoids
- 11.2.5. Other Ty
- 11.3. Market Analysis, Insights and Forecast - by Application
- 11.3.1. Skin Care
- 11.3.2. Hair Care
- 11.3.3. Injectables
- 11.3.4. Other Applications (Makeup and Body care)
- 11.1. Market Analysis, Insights and Forecast - by Source
- 12. Competitive Analysis
- 12.1. Company Profiles
- 12.1.1 Koninklijke DSM
- 12.1.1.1. Company Overview
- 12.1.1.2. Products
- 12.1.1.3. Company Financials
- 12.1.1.4. SWOT Analysis
- 12.1.2 Lonza Group
- 12.1.2.1. Company Overview
- 12.1.2.2. Products
- 12.1.2.3. Company Financials
- 12.1.2.4. SWOT Analysis
- 12.1.3 Kemin Industries
- 12.1.3.1. Company Overview
- 12.1.3.2. Products
- 12.1.3.3. Company Financials
- 12.1.3.4. SWOT Analysis
- 12.1.4 Evonik Industries AG
- 12.1.4.1. Company Overview
- 12.1.4.2. Products
- 12.1.4.3. Company Financials
- 12.1.4.4. SWOT Analysis
- 12.1.5 Provital Group
- 12.1.5.1. Company Overview
- 12.1.5.2. Products
- 12.1.5.3. Company Financials
- 12.1.5.4. SWOT Analysis
- 12.1.6 Croda International Plc
- 12.1.6.1. Company Overview
- 12.1.6.2. Products
- 12.1.6.3. Company Financials
- 12.1.6.4. SWOT Analysis
- 12.1.7 BASF SE
- 12.1.7.1. Company Overview
- 12.1.7.2. Products
- 12.1.7.3. Company Financials
- 12.1.7.4. SWOT Analysis
- 12.1.8 Eastman Chemical Company
- 12.1.8.1. Company Overview
- 12.1.8.2. Products
- 12.1.8.3. Company Financials
- 12.1.8.4. SWOT Analysis
- 12.1.9 BTSA Biotecnologias Aplicadas
- 12.1.9.1. Company Overview
- 12.1.9.2. Products
- 12.1.9.3. Company Financials
- 12.1.9.4. SWOT Analysis
- 12.1.10 Wacker Chemie AG*List Not Exhaustive
- 12.1.10.1. Company Overview
- 12.1.10.2. Products
- 12.1.10.3. Company Financials
- 12.1.10.4. SWOT Analysis
- 12.1.1 Koninklijke DSM
- 12.2. Market Entropy
- 12.2.1 Company's Key Areas Served
- 12.2.2 Recent Developments
- 12.3. Company Market Share Analysis 2025
- 12.3.1 Top 5 Companies Market Share Analysis
- 12.3.2 Top 3 Companies Market Share Analysis
- 12.4. List of Potential Customers
- 13. Research Methodology
List of Figures
- Figure 1: Global Cosmetic Antioxidants Industry Revenue Breakdown (Million, %) by Region 2025 & 2033
- Figure 2: Asia Pacific Cosmetic Antioxidants Industry Revenue (Million), by Source 2025 & 2033
- Figure 3: Asia Pacific Cosmetic Antioxidants Industry Revenue Share (%), by Source 2025 & 2033
- Figure 4: Asia Pacific Cosmetic Antioxidants Industry Revenue (Million), by Type 2025 & 2033
- Figure 5: Asia Pacific Cosmetic Antioxidants Industry Revenue Share (%), by Type 2025 & 2033
- Figure 6: Asia Pacific Cosmetic Antioxidants Industry Revenue (Million), by Application 2025 & 2033
- Figure 7: Asia Pacific Cosmetic Antioxidants Industry Revenue Share (%), by Application 2025 & 2033
- Figure 8: Asia Pacific Cosmetic Antioxidants Industry Revenue (Million), by Country 2025 & 2033
- Figure 9: Asia Pacific Cosmetic Antioxidants Industry Revenue Share (%), by Country 2025 & 2033
- Figure 10: North America Cosmetic Antioxidants Industry Revenue (Million), by Source 2025 & 2033
- Figure 11: North America Cosmetic Antioxidants Industry Revenue Share (%), by Source 2025 & 2033
- Figure 12: North America Cosmetic Antioxidants Industry Revenue (Million), by Type 2025 & 2033
- Figure 13: North America Cosmetic Antioxidants Industry Revenue Share (%), by Type 2025 & 2033
- Figure 14: North America Cosmetic Antioxidants Industry Revenue (Million), by Application 2025 & 2033
- Figure 15: North America Cosmetic Antioxidants Industry Revenue Share (%), by Application 2025 & 2033
- Figure 16: North America Cosmetic Antioxidants Industry Revenue (Million), by Country 2025 & 2033
- Figure 17: North America Cosmetic Antioxidants Industry Revenue Share (%), by Country 2025 & 2033
- Figure 18: Europe Cosmetic Antioxidants Industry Revenue (Million), by Source 2025 & 2033
- Figure 19: Europe Cosmetic Antioxidants Industry Revenue Share (%), by Source 2025 & 2033
- Figure 20: Europe Cosmetic Antioxidants Industry Revenue (Million), by Type 2025 & 2033
- Figure 21: Europe Cosmetic Antioxidants Industry Revenue Share (%), by Type 2025 & 2033
- Figure 22: Europe Cosmetic Antioxidants Industry Revenue (Million), by Application 2025 & 2033
- Figure 23: Europe Cosmetic Antioxidants Industry Revenue Share (%), by Application 2025 & 2033
- Figure 24: Europe Cosmetic Antioxidants Industry Revenue (Million), by Country 2025 & 2033
- Figure 25: Europe Cosmetic Antioxidants Industry Revenue Share (%), by Country 2025 & 2033
- Figure 26: South America Cosmetic Antioxidants Industry Revenue (Million), by Source 2025 & 2033
- Figure 27: South America Cosmetic Antioxidants Industry Revenue Share (%), by Source 2025 & 2033
- Figure 28: South America Cosmetic Antioxidants Industry Revenue (Million), by Type 2025 & 2033
- Figure 29: South America Cosmetic Antioxidants Industry Revenue Share (%), by Type 2025 & 2033
- Figure 30: South America Cosmetic Antioxidants Industry Revenue (Million), by Application 2025 & 2033
- Figure 31: South America Cosmetic Antioxidants Industry Revenue Share (%), by Application 2025 & 2033
- Figure 32: South America Cosmetic Antioxidants Industry Revenue (Million), by Country 2025 & 2033
- Figure 33: South America Cosmetic Antioxidants Industry Revenue Share (%), by Country 2025 & 2033
- Figure 34: Middle East and Africa Cosmetic Antioxidants Industry Revenue (Million), by Source 2025 & 2033
- Figure 35: Middle East and Africa Cosmetic Antioxidants Industry Revenue Share (%), by Source 2025 & 2033
- Figure 36: Middle East and Africa Cosmetic Antioxidants Industry Revenue (Million), by Type 2025 & 2033
- Figure 37: Middle East and Africa Cosmetic Antioxidants Industry Revenue Share (%), by Type 2025 & 2033
- Figure 38: Middle East and Africa Cosmetic Antioxidants Industry Revenue (Million), by Application 2025 & 2033
- Figure 39: Middle East and Africa Cosmetic Antioxidants Industry Revenue Share (%), by Application 2025 & 2033
- Figure 40: Middle East and Africa Cosmetic Antioxidants Industry Revenue (Million), by Country 2025 & 2033
- Figure 41: Middle East and Africa Cosmetic Antioxidants Industry Revenue Share (%), by Country 2025 & 2033
List of Tables
- Table 1: Global Cosmetic Antioxidants Industry Revenue Million Forecast, by Source 2020 & 2033
- Table 2: Global Cosmetic Antioxidants Industry Revenue Million Forecast, by Type 2020 & 2033
- Table 3: Global Cosmetic Antioxidants Industry Revenue Million Forecast, by Application 2020 & 2033
- Table 4: Global Cosmetic Antioxidants Industry Revenue Million Forecast, by Region 2020 & 2033
- Table 5: Global Cosmetic Antioxidants Industry Revenue Million Forecast, by Source 2020 & 2033
- Table 6: Global Cosmetic Antioxidants Industry Revenue Million Forecast, by Type 2020 & 2033
- Table 7: Global Cosmetic Antioxidants Industry Revenue Million Forecast, by Application 2020 & 2033
- Table 8: Global Cosmetic Antioxidants Industry Revenue Million Forecast, by Country 2020 & 2033
- Table 9: China Cosmetic Antioxidants Industry Revenue (Million) Forecast, by Application 2020 & 2033
- Table 10: India Cosmetic Antioxidants Industry Revenue (Million) Forecast, by Application 2020 & 2033
- Table 11: Japan Cosmetic Antioxidants Industry Revenue (Million) Forecast, by Application 2020 & 2033
- Table 12: South Korea Cosmetic Antioxidants Industry Revenue (Million) Forecast, by Application 2020 & 2033
- Table 13: Rest of Asia Pacific Cosmetic Antioxidants Industry Revenue (Million) Forecast, by Application 2020 & 2033
- Table 14: Global Cosmetic Antioxidants Industry Revenue Million Forecast, by Source 2020 & 2033
- Table 15: Global Cosmetic Antioxidants Industry Revenue Million Forecast, by Type 2020 & 2033
- Table 16: Global Cosmetic Antioxidants Industry Revenue Million Forecast, by Application 2020 & 2033
- Table 17: Global Cosmetic Antioxidants Industry Revenue Million Forecast, by Country 2020 & 2033
- Table 18: United States Cosmetic Antioxidants Industry Revenue (Million) Forecast, by Application 2020 & 2033
- Table 19: Canada Cosmetic Antioxidants Industry Revenue (Million) Forecast, by Application 2020 & 2033
- Table 20: Mexico Cosmetic Antioxidants Industry Revenue (Million) Forecast, by Application 2020 & 2033
- Table 21: Global Cosmetic Antioxidants Industry Revenue Million Forecast, by Source 2020 & 2033
- Table 22: Global Cosmetic Antioxidants Industry Revenue Million Forecast, by Type 2020 & 2033
- Table 23: Global Cosmetic Antioxidants Industry Revenue Million Forecast, by Application 2020 & 2033
- Table 24: Global Cosmetic Antioxidants Industry Revenue Million Forecast, by Country 2020 & 2033
- Table 25: Germany Cosmetic Antioxidants Industry Revenue (Million) Forecast, by Application 2020 & 2033
- Table 26: United Kingdom Cosmetic Antioxidants Industry Revenue (Million) Forecast, by Application 2020 & 2033
- Table 27: Italy Cosmetic Antioxidants Industry Revenue (Million) Forecast, by Application 2020 & 2033
- Table 28: France Cosmetic Antioxidants Industry Revenue (Million) Forecast, by Application 2020 & 2033
- Table 29: Rest of Europe Cosmetic Antioxidants Industry Revenue (Million) Forecast, by Application 2020 & 2033
- Table 30: Global Cosmetic Antioxidants Industry Revenue Million Forecast, by Source 2020 & 2033
- Table 31: Global Cosmetic Antioxidants Industry Revenue Million Forecast, by Type 2020 & 2033
- Table 32: Global Cosmetic Antioxidants Industry Revenue Million Forecast, by Application 2020 & 2033
- Table 33: Global Cosmetic Antioxidants Industry Revenue Million Forecast, by Country 2020 & 2033
- Table 34: Brazil Cosmetic Antioxidants Industry Revenue (Million) Forecast, by Application 2020 & 2033
- Table 35: Argentina Cosmetic Antioxidants Industry Revenue (Million) Forecast, by Application 2020 & 2033
- Table 36: Rest of South America Cosmetic Antioxidants Industry Revenue (Million) Forecast, by Application 2020 & 2033
- Table 37: Global Cosmetic Antioxidants Industry Revenue Million Forecast, by Source 2020 & 2033
- Table 38: Global Cosmetic Antioxidants Industry Revenue Million Forecast, by Type 2020 & 2033
- Table 39: Global Cosmetic Antioxidants Industry Revenue Million Forecast, by Application 2020 & 2033
- Table 40: Global Cosmetic Antioxidants Industry Revenue Million Forecast, by Country 2020 & 2033
- Table 41: Saudi Arabia Cosmetic Antioxidants Industry Revenue (Million) Forecast, by Application 2020 & 2033
- Table 42: South Africa Cosmetic Antioxidants Industry Revenue (Million) Forecast, by Application 2020 & 2033
- Table 43: Rest of Middle East and Africa Cosmetic Antioxidants Industry Revenue (Million) Forecast, by Application 2020 & 2033
Frequently Asked Questions
1. What is the projected Compound Annual Growth Rate (CAGR) of the Cosmetic Antioxidants Industry?
The projected CAGR is approximately 5.95%.
2. Which companies are prominent players in the Cosmetic Antioxidants Industry?
Key companies in the market include Koninklijke DSM, Lonza Group, Kemin Industries, Evonik Industries AG, Provital Group, Croda International Plc, BASF SE, Eastman Chemical Company, BTSA Biotecnologias Aplicadas, Wacker Chemie AG*List Not Exhaustive.
3. What are the main segments of the Cosmetic Antioxidants Industry?
The market segments include Source, Type, Application.
4. Can you provide details about the market size?
The market size is estimated to be USD 139.23 Million as of 2022.
5. What are some drivers contributing to market growth?
Rise in Online Purcahse of Cosmetics; Increasing Use of Beauty Products and Personal Care Products; Other Drivers.
6. What are the notable trends driving market growth?
Increasing Usage of Natural Antioxidants in Cosmetics Products.
7. Are there any restraints impacting market growth?
High Cost of Natural Antioxidants; Other Restraints.
8. Can you provide examples of recent developments in the market?
October 2023: BASF's Care Chemicals division is investing in a new plant to produce emollient specialties at its Düsseldorf site targeted for skin and sun protection products.
9. What pricing options are available for accessing the report?
Pricing options include single-user, multi-user, and enterprise licenses priced at USD 4750, USD 5250, and USD 8750 respectively.
10. Is the market size provided in terms of value or volume?
The market size is provided in terms of value, measured in Million.
11. Are there any specific market keywords associated with the report?
Yes, the market keyword associated with the report is "Cosmetic Antioxidants Industry," which aids in identifying and referencing the specific market segment covered.
12. How do I determine which pricing option suits my needs best?
The pricing options vary based on user requirements and access needs. Individual users may opt for single-user licenses, while businesses requiring broader access may choose multi-user or enterprise licenses for cost-effective access to the report.
13. Are there any additional resources or data provided in the Cosmetic Antioxidants Industry report?
While the report offers comprehensive insights, it's advisable to review the specific contents or supplementary materials provided to ascertain if additional resources or data are available.
14. How can I stay updated on further developments or reports in the Cosmetic Antioxidants Industry?
To stay informed about further developments, trends, and reports in the Cosmetic Antioxidants Industry, consider subscribing to industry newsletters, following relevant companies and organizations, or regularly checking reputable industry news sources and publications.
Methodology
Step 1 - Identification of Relevant Samples Size from Population Database


Step 2 - Approaches for Defining Global Market Size (Value, Volume* & Price*)

Note*: In applicable scenarios
Step 3 - Data Sources
Primary Research
- Web Analytics
- Survey Reports
- Research Institute
- Latest Research Reports
- Opinion Leaders
Secondary Research
- Annual Reports
- White Paper
- Latest Press Release
- Industry Association
- Paid Database
- Investor Presentations

Step 4 - Data Triangulation
Involves using different sources of information in order to increase the validity of a study
These sources are likely to be stakeholders in a program - participants, other researchers, program staff, other community members, and so on.
Then we put all data in single framework & apply various statistical tools to find out the dynamic on the market.
During the analysis stage, feedback from the stakeholder groups would be compared to determine areas of agreement as well as areas of divergence