

Key Insights
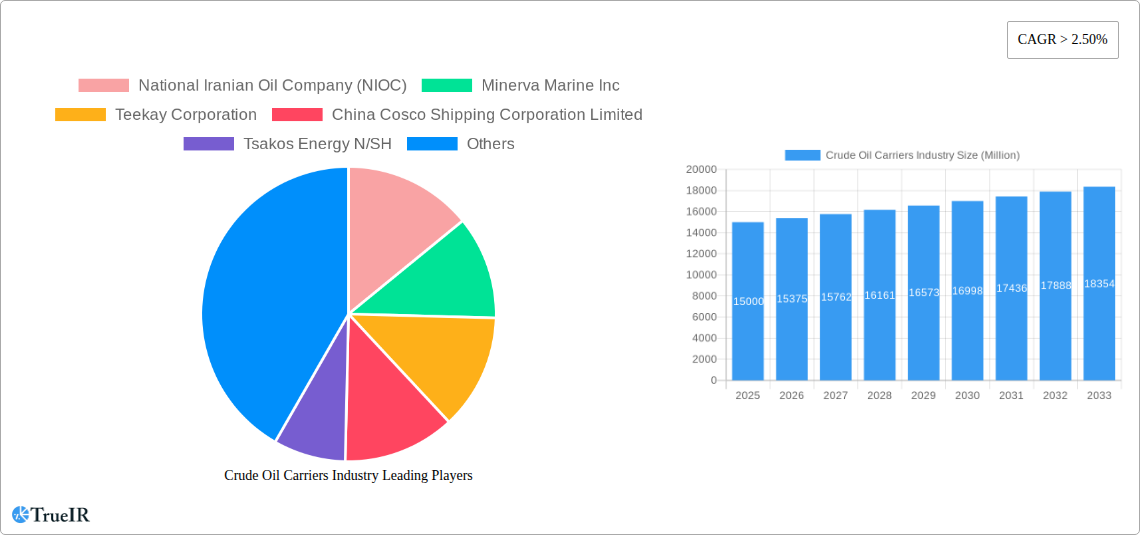
The crude oil carrier market is projected to reach $225142.8 million by 2025, with a projected CAGR of 4.6% from 2025 to 2033. This growth is propelled by increasing global crude oil demand, particularly in developing Asian economies, necessitating efficient transport solutions. The industry is also seeing a trend towards larger vessels like VLCCs and ULCCs for enhanced cost-efficiency and logistics. Technological advancements in vessel design and digital integration for operational efficiency and safety are further stimulating expansion. Key market restraints include volatile oil prices, geopolitical risks affecting shipping routes, and stringent environmental regulations on carbon emissions. The market is segmented by vessel size, including Medium Range, Panamax, Aframax, Suezmax, VLCCs, and ULCCs, with growth varying by segment based on demand and logistics. Major companies such as National Iranian Oil Company (NIOC), Minerva Marine Inc., Teekay Corporation, and Cosco Shipping Corporation Limited are actively competing through fleet size, operational expertise, and strategic alliances.
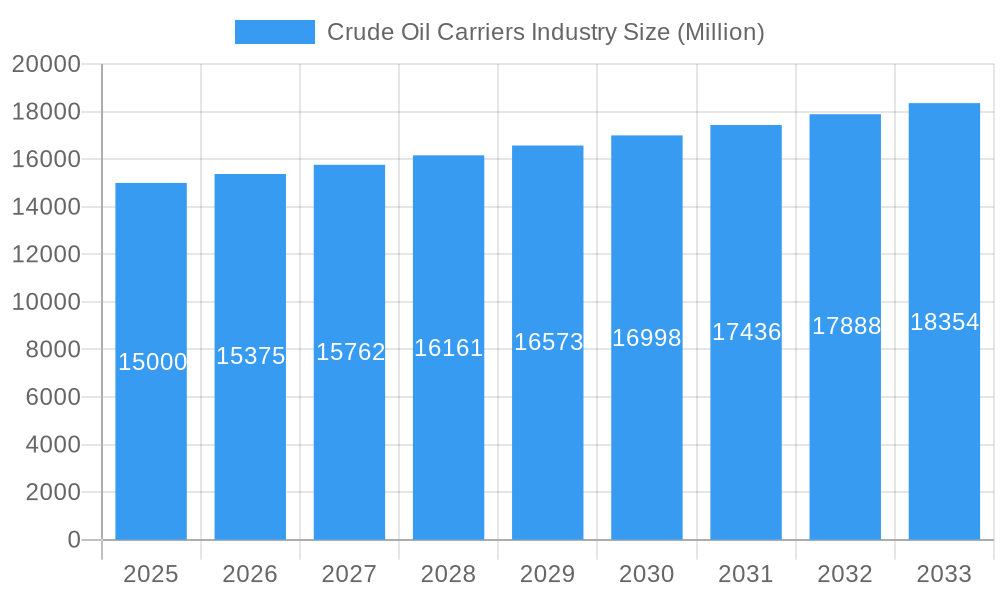
Crude Oil Carriers Industry Market Size (In Billion)
Geographically, North America, Europe, and Asia-Pacific are significant markets, with Asia-Pacific, especially China and India, anticipated to experience the most substantial growth due to rising energy consumption. The Middle East and Africa are also critical regions, given their roles as major crude oil producers and exporters. The competitive landscape features established industry leaders and emerging players. The market's future will be shaped by the interplay of global energy demand, technological innovation, and maritime transport regulations, potentially leading to increased consolidation and strategic partnerships among key stakeholders.
Crude Oil Carriers Industry Company Market Share
Crude Oil Carriers Industry: Market Analysis & Forecast 2019-2033
This comprehensive report provides a detailed analysis of the global Crude Oil Carriers industry, covering the period from 2019 to 2033. Leveraging extensive market research and data analysis, this report offers invaluable insights into market structure, competitive dynamics, growth drivers, challenges, and future outlook. The report includes detailed segmentation by vessel size (Medium Range, Panamax, Aframax, Suezmax, VLCC, ULCC), identifying key players and dominant markets. With a focus on key performance indicators (KPIs), including CAGR and market penetration rates, this report is an essential resource for industry professionals, investors, and strategic decision-makers.
Crude Oil Carriers Industry Market Structure & Competitive Landscape
The global crude oil carrier market exhibits a moderately concentrated structure, with a Herfindahl-Hirschman Index (HHI) estimated at xx in 2025. This reflects the presence of several large multinational players alongside a significant number of smaller, independent operators. Key innovation drivers include the adoption of technologically advanced vessels with improved fuel efficiency and emission reduction capabilities, as well as the implementation of digital technologies for enhanced fleet management and operational efficiency. Regulatory impacts, notably those related to environmental protection (IMO 2020) and safety standards, significantly shape industry practices. Product substitutes are limited, with crude oil transportation largely reliant on specialized vessels. End-user segmentation includes oil producing nations, major oil trading companies, and refining entities. M&A activity has been relatively moderate in recent years, with a total transaction value of approximately $xx Million in 2024, driven primarily by consolidation among smaller players seeking economies of scale and enhanced competitiveness.
- Market Concentration: HHI estimated at xx in 2025.
- Innovation Drivers: Fuel efficiency improvements, digital fleet management.
- Regulatory Impacts: IMO 2020, safety regulations.
- M&A Trends: Consolidation among smaller players, total transaction value of $xx Million in 2024.
Crude Oil Carriers Industry Market Trends & Opportunities
The global crude oil carrier market is projected to experience significant growth during the forecast period (2025-2033). Market size is anticipated to reach $xx Million by 2033, exhibiting a CAGR of xx% from 2025. This growth is fueled by several factors, including increasing global demand for crude oil, particularly in developing economies. Technological advancements, such as the development of larger and more efficient vessels (VLCCs and ULCCs), are further boosting market expansion. Shifting consumer preferences towards cleaner energy sources are also having an impact. Competitive dynamics are characterized by intense rivalry among major players, leading to strategic alliances, acquisitions, and technological innovations to improve operational efficiency and gain market share. The market penetration rate of technologically advanced vessels (e.g., LNG-fueled carriers) is increasing steadily, driven by environmental regulations and cost considerations.
Dominant Markets & Segments in Crude Oil Carriers Industry
The VLCC segment dominates the crude oil carrier market, accounting for approximately xx% of the total market share in 2025. Key growth drivers in this segment include:
- Increased Global Crude Oil Demand: Growing energy consumption in emerging economies.
- Economies of Scale: Large vessels offer lower transportation costs per barrel.
- Infrastructure Development: Expansion of port facilities to accommodate VLCCs.
Other significant segments include Suezmax, Aframax, and Panamax vessels, each catering to specific trade routes and cargo volumes. Geographically, the Asia-Pacific region exhibits strong growth potential, driven by rapidly expanding energy demand in China and other Asian economies. The Middle East, as a major oil-producing region, also remains a crucial market for crude oil carriers.
Crude Oil Carriers Industry Product Analysis
Technological advancements in crude oil carrier design and construction focus on improving fuel efficiency, reducing emissions, and enhancing safety. This includes innovations such as the use of energy-efficient engines, optimized hull designs, and advanced ballast water management systems. These advancements translate into cost savings for operators and improved environmental performance, aligning with industry sustainability goals. The market fit for these advanced vessels is strong, driven by rising regulatory pressures and the growing demand for environmentally responsible shipping solutions.
Key Drivers, Barriers & Challenges in Crude Oil Carriers Industry
Key Drivers:
- Rising Global Crude Oil Demand: Driven by economic growth in developing nations.
- Technological Advancements: Fuel efficiency improvements, digitalization of operations.
- Favorable Regulatory Environment: Investment in port infrastructure and efficient shipping lanes.
Key Challenges:
- Oil Price Volatility: Fluctuations in crude oil prices directly impact demand and profitability.
- Environmental Regulations: Stricter emissions standards increase operational costs.
- Geopolitical Risks: Instability in key oil-producing regions can disrupt supply chains. This factor alone can impact the market by approximately xx Million annually.
Growth Drivers in the Crude Oil Carriers Industry Market
Key drivers include the sustained increase in global oil demand, especially in developing economies, along with technological advancements focusing on improved fuel efficiency and emissions reduction. Favorable regulatory environments promoting shipping infrastructure development further stimulate market growth.
Challenges Impacting Crude Oil Carriers Industry Growth
Challenges include volatile oil prices, stringent environmental regulations increasing operational costs, and geopolitical uncertainties disrupting supply chains and potentially impacting the market by xx Million annually.
Key Players Shaping the Crude Oil Carriers Industry Market
- National Iranian Oil Company (NIOC)
- Minerva Marine Inc
- Teekay Corporation
- China Cosco Shipping Corporation Limited
- Tsakos Energy N/SH
- China Merchants Group Ltd
- Euronav NV
- Petroliam Nasional Berhad (PETRONAS)
- The National Shipping Co Saudi Arabia
- Angelicoussis Shipping Group Ltd
Significant Crude Oil Carriers Industry Milestones
- 2020: Implementation of IMO 2020 sulfur cap significantly impacted the industry, necessitating investments in cleaner fuels and technologies.
- 2022: Several major mergers and acquisitions reshaped the competitive landscape, leading to increased consolidation.
- 2023: Introduction of new vessel designs with enhanced fuel efficiency and reduced emissions.
Future Outlook for Crude Oil Carriers Industry Market
The crude oil carrier market is poised for continued growth, driven by persistent global energy demand and technological innovations focusing on sustainability. Strategic partnerships and investments in new technologies will be crucial for success. The market presents significant opportunities for players who can adapt to evolving regulatory landscapes and deliver efficient, environmentally responsible shipping solutions.
Crude Oil Carriers Industry Segmentation
-
1. Size
- 1.1. Medium Range
- 1.2. Panaxax
- 1.3. Aframax
- 1.4. Suezmax
- 1.5. Very Lar
Crude Oil Carriers Industry Segmentation By Geography
- 1. North America
- 2. Europe
- 3. Asia Pacific
- 4. South America
- 5. Middle East
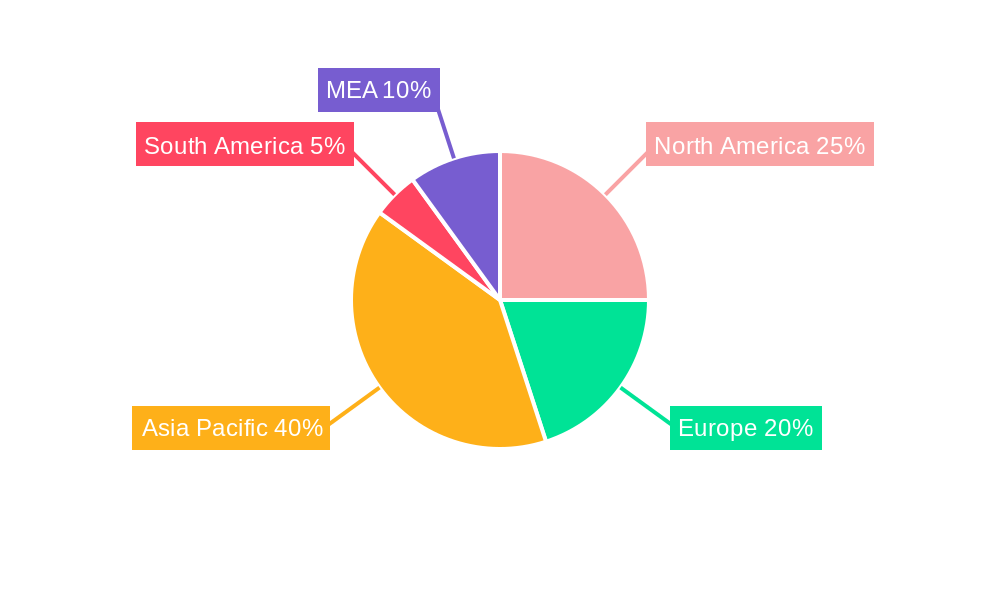
Crude Oil Carriers Industry Regional Market Share
Geographic Coverage of Crude Oil Carriers Industry
Crude Oil Carriers Industry REPORT HIGHLIGHTS
| Aspects | Details |
|---|---|
| Study Period | 2020-2034 |
| Base Year | 2025 |
| Estimated Year | 2026 |
| Forecast Period | 2026-2034 |
| Historical Period | 2020-2025 |
| Growth Rate | CAGR of 4.6% from 2020-2034 |
| Segmentation |
|
Table of Contents
- 1. Introduction
- 1.1. Research Scope
- 1.2. Market Segmentation
- 1.3. Research Objective
- 1.4. Definitions and Assumptions
- 2. Executive Summary
- 2.1. Market Snapshot
- 3. Market Dynamics
- 3.1. Market Drivers
- 3.2. Market Restrains
- 3.3. Market Trends
- 3.4. Market Opportunities
- 4. Market Factor Analysis
- 4.1. Porters Five Forces
- 4.1.1. Bargaining Power of Suppliers
- 4.1.2. Bargaining Power of Buyers
- 4.1.3. Threat of New Entrants
- 4.1.4. Threat of Substitutes
- 4.1.5. Competitive Rivalry
- 4.2. PESTEL analysis
- 4.3. BCG Analysis
- 4.3.1. Stars (High Growth, High Market Share)
- 4.3.2. Cash Cows (Low Growth, High Market Share)
- 4.3.3. Question Mark (High Growth, Low Market Share)
- 4.3.4. Dogs (Low Growth, Low Market Share)
- 4.4. Ansoff Matrix Analysis
- 4.5. Supply Chain Analysis
- 4.6. Regulatory Landscape
- 4.7. Current Market Potential and Opportunity Assessment (TAM–SAM–SOM Framework)
- 4.8. TIR Analyst Note
- 4.1. Porters Five Forces
- 5. Market Analysis, Insights and Forecast 2021-2033
- 5.1. Market Analysis, Insights and Forecast - by Size
- 5.1.1. Medium Range
- 5.1.2. Panaxax
- 5.1.3. Aframax
- 5.1.4. Suezmax
- 5.1.5. Very Lar
- 5.2. Market Analysis, Insights and Forecast - by Region
- 5.2.1. North America
- 5.2.2. Europe
- 5.2.3. Asia Pacific
- 5.2.4. South America
- 5.2.5. Middle East
- 5.1. Market Analysis, Insights and Forecast - by Size
- 6. Global Crude Oil Carriers Industry Analysis, Insights and Forecast, 2021-2033
- 6.1. Market Analysis, Insights and Forecast - by Size
- 6.1.1. Medium Range
- 6.1.2. Panaxax
- 6.1.3. Aframax
- 6.1.4. Suezmax
- 6.1.5. Very Lar
- 6.1. Market Analysis, Insights and Forecast - by Size
- 7. North America Crude Oil Carriers Industry Analysis, Insights and Forecast, 2020-2032
- 7.1. Market Analysis, Insights and Forecast - by Size
- 7.1.1. Medium Range
- 7.1.2. Panaxax
- 7.1.3. Aframax
- 7.1.4. Suezmax
- 7.1.5. Very Lar
- 7.1. Market Analysis, Insights and Forecast - by Size
- 8. Europe Crude Oil Carriers Industry Analysis, Insights and Forecast, 2020-2032
- 8.1. Market Analysis, Insights and Forecast - by Size
- 8.1.1. Medium Range
- 8.1.2. Panaxax
- 8.1.3. Aframax
- 8.1.4. Suezmax
- 8.1.5. Very Lar
- 8.1. Market Analysis, Insights and Forecast - by Size
- 9. Asia Pacific Crude Oil Carriers Industry Analysis, Insights and Forecast, 2020-2032
- 9.1. Market Analysis, Insights and Forecast - by Size
- 9.1.1. Medium Range
- 9.1.2. Panaxax
- 9.1.3. Aframax
- 9.1.4. Suezmax
- 9.1.5. Very Lar
- 9.1. Market Analysis, Insights and Forecast - by Size
- 10. South America Crude Oil Carriers Industry Analysis, Insights and Forecast, 2020-2032
- 10.1. Market Analysis, Insights and Forecast - by Size
- 10.1.1. Medium Range
- 10.1.2. Panaxax
- 10.1.3. Aframax
- 10.1.4. Suezmax
- 10.1.5. Very Lar
- 10.1. Market Analysis, Insights and Forecast - by Size
- 11. Middle East Crude Oil Carriers Industry Analysis, Insights and Forecast, 2020-2032
- 11.1. Market Analysis, Insights and Forecast - by Size
- 11.1.1. Medium Range
- 11.1.2. Panaxax
- 11.1.3. Aframax
- 11.1.4. Suezmax
- 11.1.5. Very Lar
- 11.1. Market Analysis, Insights and Forecast - by Size
- 12. Competitive Analysis
- 12.1. Company Profiles
- 12.1.1 National Iranian Oil Company (NIOC)
- 12.1.1.1. Company Overview
- 12.1.1.2. Products
- 12.1.1.3. Company Financials
- 12.1.1.4. SWOT Analysis
- 12.1.2 Minerva Marine Inc
- 12.1.2.1. Company Overview
- 12.1.2.2. Products
- 12.1.2.3. Company Financials
- 12.1.2.4. SWOT Analysis
- 12.1.3 Teekay Corporation
- 12.1.3.1. Company Overview
- 12.1.3.2. Products
- 12.1.3.3. Company Financials
- 12.1.3.4. SWOT Analysis
- 12.1.4 China Cosco Shipping Corporation Limited
- 12.1.4.1. Company Overview
- 12.1.4.2. Products
- 12.1.4.3. Company Financials
- 12.1.4.4. SWOT Analysis
- 12.1.5 Tsakos Energy N/SH
- 12.1.5.1. Company Overview
- 12.1.5.2. Products
- 12.1.5.3. Company Financials
- 12.1.5.4. SWOT Analysis
- 12.1.6 China Merchants Group Ltd
- 12.1.6.1. Company Overview
- 12.1.6.2. Products
- 12.1.6.3. Company Financials
- 12.1.6.4. SWOT Analysis
- 12.1.7 Euronav NV
- 12.1.7.1. Company Overview
- 12.1.7.2. Products
- 12.1.7.3. Company Financials
- 12.1.7.4. SWOT Analysis
- 12.1.8 Petroliam Nasional Berhad (PETRONAS)*List Not Exhaustive
- 12.1.8.1. Company Overview
- 12.1.8.2. Products
- 12.1.8.3. Company Financials
- 12.1.8.4. SWOT Analysis
- 12.1.9 The National Shipping Co Saudi Arabia
- 12.1.9.1. Company Overview
- 12.1.9.2. Products
- 12.1.9.3. Company Financials
- 12.1.9.4. SWOT Analysis
- 12.1.10 Angelicoussis Shipping Group Ltd
- 12.1.10.1. Company Overview
- 12.1.10.2. Products
- 12.1.10.3. Company Financials
- 12.1.10.4. SWOT Analysis
- 12.1.1 National Iranian Oil Company (NIOC)
- 12.2. Market Entropy
- 12.2.1 Company's Key Areas Served
- 12.2.2 Recent Developments
- 12.3. Company Market Share Analysis 2025
- 12.3.1 Top 5 Companies Market Share Analysis
- 12.3.2 Top 3 Companies Market Share Analysis
- 12.4. List of Potential Customers
- 13. Research Methodology
List of Figures
- Figure 1: Global Crude Oil Carriers Industry Revenue Breakdown (million, %) by Region 2025 & 2033
- Figure 2: Global Crude Oil Carriers Industry Volume Breakdown (metric tonnes, %) by Region 2025 & 2033
- Figure 3: North America Crude Oil Carriers Industry Revenue (million), by Size 2025 & 2033
- Figure 4: North America Crude Oil Carriers Industry Volume (metric tonnes), by Size 2025 & 2033
- Figure 5: North America Crude Oil Carriers Industry Revenue Share (%), by Size 2025 & 2033
- Figure 6: North America Crude Oil Carriers Industry Volume Share (%), by Size 2025 & 2033
- Figure 7: North America Crude Oil Carriers Industry Revenue (million), by Country 2025 & 2033
- Figure 8: North America Crude Oil Carriers Industry Volume (metric tonnes), by Country 2025 & 2033
- Figure 9: North America Crude Oil Carriers Industry Revenue Share (%), by Country 2025 & 2033
- Figure 10: North America Crude Oil Carriers Industry Volume Share (%), by Country 2025 & 2033
- Figure 11: Europe Crude Oil Carriers Industry Revenue (million), by Size 2025 & 2033
- Figure 12: Europe Crude Oil Carriers Industry Volume (metric tonnes), by Size 2025 & 2033
- Figure 13: Europe Crude Oil Carriers Industry Revenue Share (%), by Size 2025 & 2033
- Figure 14: Europe Crude Oil Carriers Industry Volume Share (%), by Size 2025 & 2033
- Figure 15: Europe Crude Oil Carriers Industry Revenue (million), by Country 2025 & 2033
- Figure 16: Europe Crude Oil Carriers Industry Volume (metric tonnes), by Country 2025 & 2033
- Figure 17: Europe Crude Oil Carriers Industry Revenue Share (%), by Country 2025 & 2033
- Figure 18: Europe Crude Oil Carriers Industry Volume Share (%), by Country 2025 & 2033
- Figure 19: Asia Pacific Crude Oil Carriers Industry Revenue (million), by Size 2025 & 2033
- Figure 20: Asia Pacific Crude Oil Carriers Industry Volume (metric tonnes), by Size 2025 & 2033
- Figure 21: Asia Pacific Crude Oil Carriers Industry Revenue Share (%), by Size 2025 & 2033
- Figure 22: Asia Pacific Crude Oil Carriers Industry Volume Share (%), by Size 2025 & 2033
- Figure 23: Asia Pacific Crude Oil Carriers Industry Revenue (million), by Country 2025 & 2033
- Figure 24: Asia Pacific Crude Oil Carriers Industry Volume (metric tonnes), by Country 2025 & 2033
- Figure 25: Asia Pacific Crude Oil Carriers Industry Revenue Share (%), by Country 2025 & 2033
- Figure 26: Asia Pacific Crude Oil Carriers Industry Volume Share (%), by Country 2025 & 2033
- Figure 27: South America Crude Oil Carriers Industry Revenue (million), by Size 2025 & 2033
- Figure 28: South America Crude Oil Carriers Industry Volume (metric tonnes), by Size 2025 & 2033
- Figure 29: South America Crude Oil Carriers Industry Revenue Share (%), by Size 2025 & 2033
- Figure 30: South America Crude Oil Carriers Industry Volume Share (%), by Size 2025 & 2033
- Figure 31: South America Crude Oil Carriers Industry Revenue (million), by Country 2025 & 2033
- Figure 32: South America Crude Oil Carriers Industry Volume (metric tonnes), by Country 2025 & 2033
- Figure 33: South America Crude Oil Carriers Industry Revenue Share (%), by Country 2025 & 2033
- Figure 34: South America Crude Oil Carriers Industry Volume Share (%), by Country 2025 & 2033
- Figure 35: Middle East Crude Oil Carriers Industry Revenue (million), by Size 2025 & 2033
- Figure 36: Middle East Crude Oil Carriers Industry Volume (metric tonnes), by Size 2025 & 2033
- Figure 37: Middle East Crude Oil Carriers Industry Revenue Share (%), by Size 2025 & 2033
- Figure 38: Middle East Crude Oil Carriers Industry Volume Share (%), by Size 2025 & 2033
- Figure 39: Middle East Crude Oil Carriers Industry Revenue (million), by Country 2025 & 2033
- Figure 40: Middle East Crude Oil Carriers Industry Volume (metric tonnes), by Country 2025 & 2033
- Figure 41: Middle East Crude Oil Carriers Industry Revenue Share (%), by Country 2025 & 2033
- Figure 42: Middle East Crude Oil Carriers Industry Volume Share (%), by Country 2025 & 2033
List of Tables
- Table 1: Global Crude Oil Carriers Industry Revenue million Forecast, by Size 2020 & 2033
- Table 2: Global Crude Oil Carriers Industry Volume metric tonnes Forecast, by Size 2020 & 2033
- Table 3: Global Crude Oil Carriers Industry Revenue million Forecast, by Region 2020 & 2033
- Table 4: Global Crude Oil Carriers Industry Volume metric tonnes Forecast, by Region 2020 & 2033
- Table 5: Global Crude Oil Carriers Industry Revenue million Forecast, by Size 2020 & 2033
- Table 6: Global Crude Oil Carriers Industry Volume metric tonnes Forecast, by Size 2020 & 2033
- Table 7: Global Crude Oil Carriers Industry Revenue million Forecast, by Country 2020 & 2033
- Table 8: Global Crude Oil Carriers Industry Volume metric tonnes Forecast, by Country 2020 & 2033
- Table 9: Global Crude Oil Carriers Industry Revenue million Forecast, by Size 2020 & 2033
- Table 10: Global Crude Oil Carriers Industry Volume metric tonnes Forecast, by Size 2020 & 2033
- Table 11: Global Crude Oil Carriers Industry Revenue million Forecast, by Country 2020 & 2033
- Table 12: Global Crude Oil Carriers Industry Volume metric tonnes Forecast, by Country 2020 & 2033
- Table 13: Global Crude Oil Carriers Industry Revenue million Forecast, by Size 2020 & 2033
- Table 14: Global Crude Oil Carriers Industry Volume metric tonnes Forecast, by Size 2020 & 2033
- Table 15: Global Crude Oil Carriers Industry Revenue million Forecast, by Country 2020 & 2033
- Table 16: Global Crude Oil Carriers Industry Volume metric tonnes Forecast, by Country 2020 & 2033
- Table 17: Global Crude Oil Carriers Industry Revenue million Forecast, by Size 2020 & 2033
- Table 18: Global Crude Oil Carriers Industry Volume metric tonnes Forecast, by Size 2020 & 2033
- Table 19: Global Crude Oil Carriers Industry Revenue million Forecast, by Country 2020 & 2033
- Table 20: Global Crude Oil Carriers Industry Volume metric tonnes Forecast, by Country 2020 & 2033
- Table 21: Global Crude Oil Carriers Industry Revenue million Forecast, by Size 2020 & 2033
- Table 22: Global Crude Oil Carriers Industry Volume metric tonnes Forecast, by Size 2020 & 2033
- Table 23: Global Crude Oil Carriers Industry Revenue million Forecast, by Country 2020 & 2033
- Table 24: Global Crude Oil Carriers Industry Volume metric tonnes Forecast, by Country 2020 & 2033
Frequently Asked Questions
1. What is the projected Compound Annual Growth Rate (CAGR) of the Crude Oil Carriers Industry?
The projected CAGR is approximately 4.6%.
2. Which companies are prominent players in the Crude Oil Carriers Industry?
Key companies in the market include National Iranian Oil Company (NIOC), Minerva Marine Inc, Teekay Corporation, China Cosco Shipping Corporation Limited, Tsakos Energy N/SH, China Merchants Group Ltd, Euronav NV, Petroliam Nasional Berhad (PETRONAS)*List Not Exhaustive, The National Shipping Co Saudi Arabia, Angelicoussis Shipping Group Ltd.
3. What are the main segments of the Crude Oil Carriers Industry?
The market segments include Size.
4. Can you provide details about the market size?
The market size is estimated to be USD 225142.8 million as of 2022.
5. What are some drivers contributing to market growth?
Increasing Electricity Demand; Rising Investments in the Coal Industry.
6. What are the notable trends driving market growth?
Very Large Crude Carrier to Dominate the Market.
7. Are there any restraints impacting market growth?
Increasing Installation of Renewable Energy Sources.
8. Can you provide examples of recent developments in the market?
N/A
9. What pricing options are available for accessing the report?
Pricing options include single-user, multi-user, and enterprise licenses priced at USD 4750, USD 5250, and USD 8750 respectively.
10. Is the market size provided in terms of value or volume?
The market size is provided in terms of value, measured in million and volume, measured in metric tonnes.
11. Are there any specific market keywords associated with the report?
Yes, the market keyword associated with the report is "Crude Oil Carriers Industry," which aids in identifying and referencing the specific market segment covered.
12. How do I determine which pricing option suits my needs best?
The pricing options vary based on user requirements and access needs. Individual users may opt for single-user licenses, while businesses requiring broader access may choose multi-user or enterprise licenses for cost-effective access to the report.
13. Are there any additional resources or data provided in the Crude Oil Carriers Industry report?
While the report offers comprehensive insights, it's advisable to review the specific contents or supplementary materials provided to ascertain if additional resources or data are available.
14. How can I stay updated on further developments or reports in the Crude Oil Carriers Industry?
To stay informed about further developments, trends, and reports in the Crude Oil Carriers Industry, consider subscribing to industry newsletters, following relevant companies and organizations, or regularly checking reputable industry news sources and publications.
Methodology
Step 1 - Identification of Relevant Samples Size from Population Database


Step 2 - Approaches for Defining Global Market Size (Value, Volume* & Price*)

Note*: In applicable scenarios
Step 3 - Data Sources
Primary Research
- Web Analytics
- Survey Reports
- Research Institute
- Latest Research Reports
- Opinion Leaders
Secondary Research
- Annual Reports
- White Paper
- Latest Press Release
- Industry Association
- Paid Database
- Investor Presentations

Step 4 - Data Triangulation
Involves using different sources of information in order to increase the validity of a study
These sources are likely to be stakeholders in a program - participants, other researchers, program staff, other community members, and so on.
Then we put all data in single framework & apply various statistical tools to find out the dynamic on the market.
During the analysis stage, feedback from the stakeholder groups would be compared to determine areas of agreement as well as areas of divergence