

Key Insights
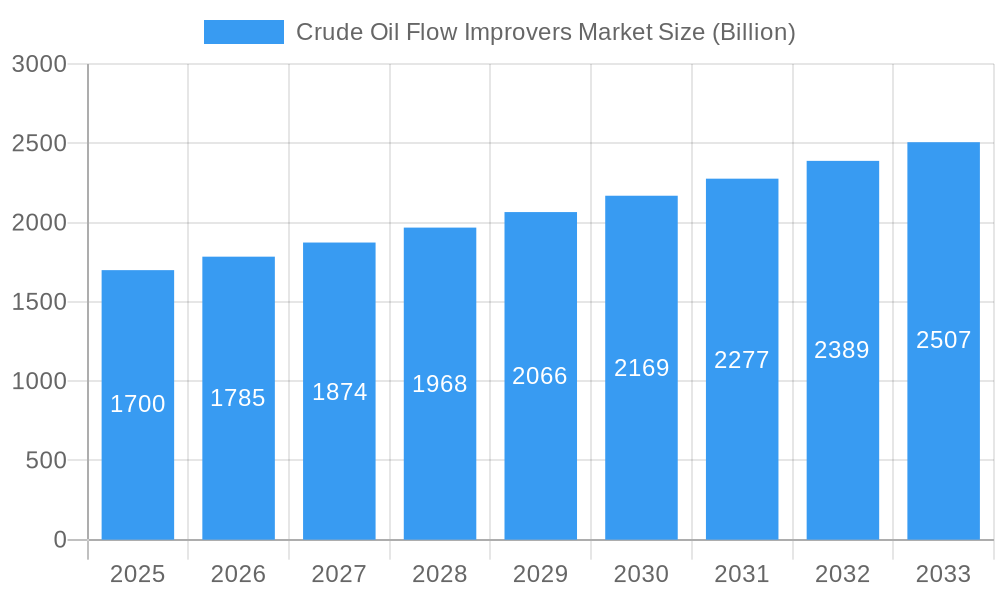
The Crude Oil Flow Improvers market, valued at $1.7 billion in 2025, is projected to experience robust growth, driven by the increasing demand for efficient oil extraction and transportation. A Compound Annual Growth Rate (CAGR) of 5% from 2025 to 2033 indicates a significant expansion in market size over the forecast period. Several factors contribute to this growth. Firstly, the ongoing exploration and production of crude oil in challenging environments, such as deepwater and unconventional reservoirs, necessitates the use of flow improvers to enhance extraction efficiency and reduce operational costs. Secondly, stringent environmental regulations are pushing for improved pipeline efficiency to minimize energy consumption and carbon footprint, leading to increased demand for drag reducing agents and other flow improvers. Finally, the rising complexity of crude oil compositions necessitates specialized inhibitors, such as paraffin and asphaltene inhibitors, to prevent flow obstructions and maintain pipeline integrity. The market segmentation reveals that paraffin & asphaltene inhibitors, along with drag reducing agents, represent substantial portions of the market, followed by scale & corrosion inhibitors and hydrate & hydrogen sulfide inhibitors. The application segments, extraction, pipelines & transportation, and processing, each contribute significantly, reflecting the widespread use of these chemicals across the oil and gas value chain. Major players such as Schlumberger, Halliburton, and Baker Hughes dominate the market, leveraging their technological expertise and extensive global presence to cater to the growing demand.
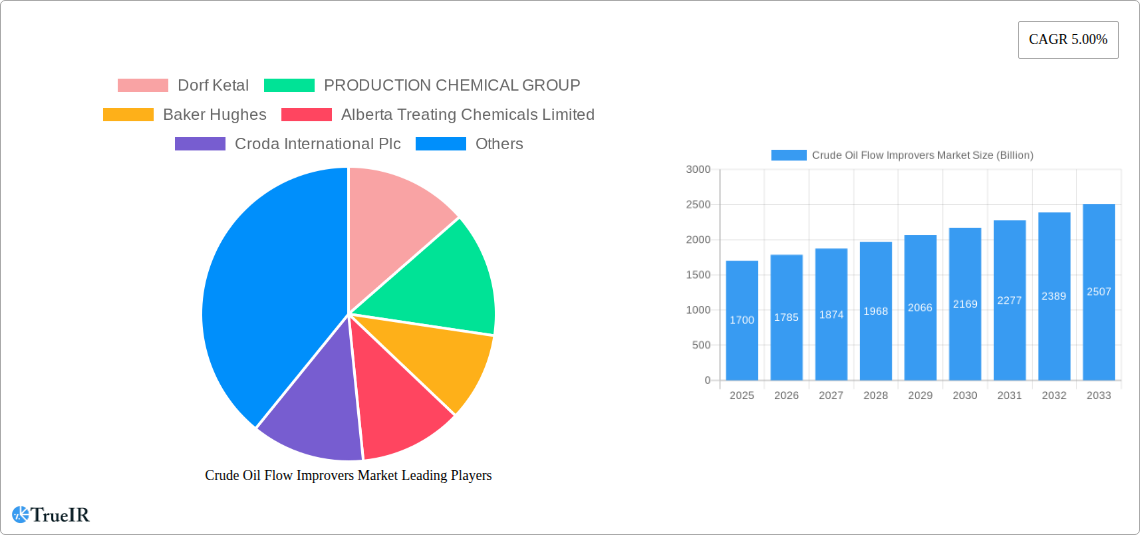
Crude Oil Flow Improvers Market Market Size (In Billion)
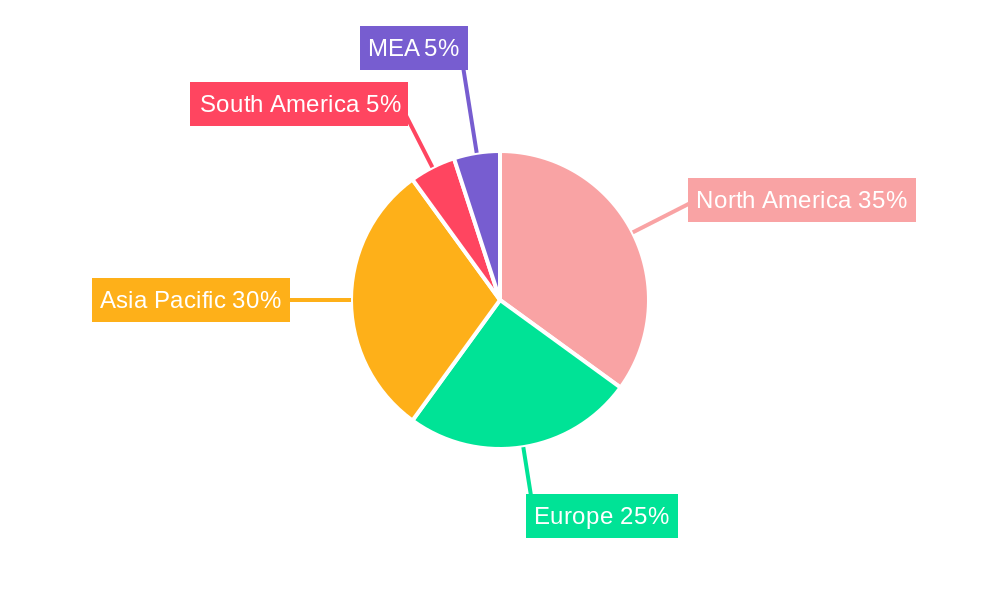
Growth is expected to be geographically diverse, with North America and the Asia-Pacific region anticipated to lead the market expansion. The United States, Canada, China, and India will be key contributors due to their significant oil and gas production activities and investments in infrastructure development. However, the market may face some restraints, including fluctuations in crude oil prices and the potential development of alternative technologies. Despite these challenges, the long-term outlook for the Crude Oil Flow Improvers market remains positive, driven by the persistent need for efficient and sustainable oil and gas operations. The market’s growth will be shaped by technological advancements, environmental concerns, and the evolving regulatory landscape.
Crude Oil Flow Improvers Market Company Market Share
Crude Oil Flow Improvers Market: A Comprehensive Report (2019-2033)
This dynamic report provides a comprehensive analysis of the Crude Oil Flow Improvers market, projecting robust growth from $XX Billion in 2025 to $XX Billion by 2033, exhibiting a CAGR of XX%. This in-depth study covers market structure, competitive landscape, dominant segments, technological advancements, and key growth drivers and challenges, offering invaluable insights for stakeholders across the oil and gas industry. The report leverages data from the historical period (2019-2024), utilizing 2025 as the base and estimated year, and projecting market trends up to 2033.
Crude Oil Flow Improvers Market Market Structure & Competitive Landscape
The Crude Oil Flow Improvers market exhibits a moderately concentrated structure, with a few major players holding significant market share. The Herfindahl-Hirschman Index (HHI) is estimated at XX in 2025, indicating a moderately competitive landscape. Innovation is a key driver, with companies continuously developing new flow improvers to address specific challenges related to crude oil viscosity, wax deposition, and scale formation. Stringent environmental regulations are also shaping the market, driving the adoption of eco-friendly flow improvers. Product substitution is limited, as the chemical properties of different flow improvers are often tailored to specific crude oil characteristics. The market sees significant end-user segmentation, with extraction, pipelines & transportation, and processing segments showing diverse needs. M&A activity has been relatively modest in recent years, with approximately XX deals recorded between 2019 and 2024, representing a total value of $XX Billion. Future consolidation is anticipated, driven by economies of scale and the need for technological advancement.
- Market Concentration: HHI of XX in 2025
- Innovation Drivers: Development of specialized flow improvers for various crude oil types and environmental concerns.
- Regulatory Impacts: Increasingly stringent environmental regulations impacting product formulations.
- Product Substitutes: Limited substitution due to the specialized nature of flow improvers.
- End-User Segmentation: Significant variations in demand across extraction, pipelines, processing, and other segments.
- M&A Trends: XX deals between 2019-2024 totaling $XX Billion.
Crude Oil Flow Improvers Market Market Trends & Opportunities
The Crude Oil Flow Improvers market is experiencing significant growth, driven by increasing global crude oil production and the need to optimize transportation and processing efficiency. Technological advancements, such as the development of more effective and environmentally friendly flow improvers, are further fueling market expansion. Consumer preferences are shifting towards sustainable and cost-effective solutions. Competitive dynamics are intense, with leading players focusing on product differentiation, technological innovation, and strategic partnerships. The market size is expected to reach $XX Billion by 2033, representing a substantial increase from the $XX Billion valuation in 2025. Market penetration rates vary significantly across different regions and applications, with higher penetration observed in mature oil-producing regions. The CAGR during the forecast period (2025-2033) is projected to be XX%. The emergence of nanotechnology-based flow improvers presents a significant opportunity for future growth. Furthermore, increasing demand for enhanced oil recovery (EOR) techniques is bolstering market expansion.
Dominant Markets & Segments in Crude Oil Flow Improvers Market
The North American region currently dominates the Crude Oil Flow Improvers market, driven by extensive oil and gas production activities and well-established infrastructure. Within the improver types, Paraffin & Asphaltene Inhibitors represent the largest segment, driven by the prevalence of waxy crude oils. The Pipelines & Transportation application segment exhibits the highest growth potential due to the increasing need for efficient crude oil transportation.
- Key Growth Drivers (North America):
- Extensive oil and gas infrastructure
- High crude oil production
- Favorable regulatory environment
- Key Growth Drivers (Paraffin & Asphaltene Inhibitors):
- High prevalence of waxy crude oils
- Technological advancements in inhibitor formulations
- Key Growth Drivers (Pipelines & Transportation):
- Increasing crude oil transportation volumes
- Need for efficient pipeline operations
Crude Oil Flow Improvers Market Product Analysis
Significant product innovations are shaping the Crude Oil Flow Improvers market. These include the development of environmentally friendly formulations, improved performance characteristics, and tailored solutions for specific crude oil properties. The competitive advantage lies in offering cost-effective, high-performance products that meet stringent environmental regulations. Technological advancements in polymer chemistry and nanotechnology are creating novel flow improvers with superior efficiency.
Key Drivers, Barriers & Challenges in Crude Oil Flow Improvers Market
Key Drivers: Increased global crude oil production, stringent environmental regulations driving the adoption of environmentally friendly flow improvers, and the growing need for efficient oil transportation and processing are key drivers. Advancements in nanotechnology and polymer chemistry are also contributing to market expansion.
Key Challenges: Volatility in crude oil prices, complex regulatory landscapes, and intense competition among established players and new entrants pose significant challenges to market growth. Supply chain disruptions can impact product availability and pricing.
Growth Drivers in the Crude Oil Flow Improvers Market Market
Technological advancements in flow improver formulations, increasing global oil production, stringent environmental regulations promoting eco-friendly solutions, and the expanding need for efficient crude oil transportation and processing are key drivers. Government initiatives supporting sustainable oil production further boost market expansion.
Challenges Impacting Crude Oil Flow Improvers Market Growth
Fluctuations in crude oil prices, supply chain vulnerabilities, strict environmental regulations, and intense competition among established and emerging players present significant challenges. These factors can lead to price volatility, production delays, and reduced profit margins for market participants.
Key Players Shaping the Crude Oil Flow Improvers Market Market
- Dorf Ketal
- PRODUCTION CHEMICAL GROUP
- Baker Hughes
- Alberta Treating Chemicals Limited
- Croda International Plc
- Ashland
- BASF SE
- Dow
- Oil Flux
- Halliburton
- The Zoranoc Oilfield Chemical
- Schlumberger Limited
- Innospec
Significant Crude Oil Flow Improvers Market Industry Milestones
- 2020: Introduction of a new, biodegradable paraffin inhibitor by Dow.
- 2022: Acquisition of a smaller flow improver manufacturer by Baker Hughes.
- 2023: Launch of a nanotechnology-based drag reducer by Schlumberger.
Future Outlook for Crude Oil Flow Improvers Market Market
The Crude Oil Flow Improvers market is poised for continued growth, driven by sustained demand for efficient oil transportation and processing, the adoption of advanced technologies, and the increasing focus on environmental sustainability. Strategic partnerships and collaborations among market players will shape future market dynamics, along with technological innovations focused on enhanced performance and reduced environmental impact. The market presents attractive opportunities for both established players and new entrants.
Crude Oil Flow Improvers Market Segmentation
-
1. Improver Type
- 1.1. Paraffin & Asphaltene Inhibitors
- 1.2. Drag Reducing Agents
- 1.3. Scale & Corrosion Inhibitors
- 1.4. Hydrate & Hydrogen Sulfide Inhibitors
- 1.5. Others (Demulsifiers, Biocides, etc.,)
-
2. Application
- 2.1. Extraction
- 2.2. Pipelines & Transportation
- 2.3. Processing
- 2.4. Others
Crude Oil Flow Improvers Market Segmentation By Geography
-
1. Asia Pacific
- 1.1. China
- 1.2. India
- 1.3. Japan
- 1.4. South Korea
- 1.5. Rest of Asia Pacific
-
2. North America
- 2.1. United States
- 2.2. Canada
- 2.3. Mexico
-
3. Europe
- 3.1. Germany
- 3.2. United Kingdom
- 3.3. Italy
- 3.4. France
- 3.5. Rest of Europe
-
4. South America
- 4.1. Brazil
- 4.2. Argentina
- 4.3. Rest of South America
-
5. Middle East and Africa
- 5.1. Saudi Arabia
- 5.2. South Africa
- 5.3. Rest of Middle East and Africa
Crude Oil Flow Improvers Market Regional Market Share
Geographic Coverage of Crude Oil Flow Improvers Market
Crude Oil Flow Improvers Market REPORT HIGHLIGHTS
| Aspects | Details |
|---|---|
| Study Period | 2020-2034 |
| Base Year | 2025 |
| Estimated Year | 2026 |
| Forecast Period | 2026-2034 |
| Historical Period | 2020-2025 |
| Growth Rate | CAGR of 5.00% from 2020-2034 |
| Segmentation |
|
Table of Contents
- 1. Introduction
- 1.1. Research Scope
- 1.2. Market Segmentation
- 1.3. Research Methodology
- 1.4. Definitions and Assumptions
- 2. Executive Summary
- 2.1. Introduction
- 3. Market Dynamics
- 3.1. Introduction
- 3.2. Market Drivers
- 3.2.1. ; Growing Demand For Paraffin & Asphaltene Inhibitors; Increasing Demand for Petroleum Based Products
- 3.3. Market Restrains
- 3.3.1. ; Stringent Environmental Regulations; Unfavourable Conditions Arising Due to the COVID-19 Outbreak
- 3.4. Market Trends
- 3.4.1. Growing Demand for Paraffin & Asphaltene Inhibitors
- 4. Market Factor Analysis
- 4.1. Porters Five Forces
- 4.2. Supply/Value Chain
- 4.3. PESTEL analysis
- 4.4. Market Entropy
- 4.5. Patent/Trademark Analysis
- 5. Global Crude Oil Flow Improvers Market Analysis, Insights and Forecast, 2020-2032
- 5.1. Market Analysis, Insights and Forecast - by Improver Type
- 5.1.1. Paraffin & Asphaltene Inhibitors
- 5.1.2. Drag Reducing Agents
- 5.1.3. Scale & Corrosion Inhibitors
- 5.1.4. Hydrate & Hydrogen Sulfide Inhibitors
- 5.1.5. Others (Demulsifiers, Biocides, etc.,)
- 5.2. Market Analysis, Insights and Forecast - by Application
- 5.2.1. Extraction
- 5.2.2. Pipelines & Transportation
- 5.2.3. Processing
- 5.2.4. Others
- 5.3. Market Analysis, Insights and Forecast - by Region
- 5.3.1. Asia Pacific
- 5.3.2. North America
- 5.3.3. Europe
- 5.3.4. South America
- 5.3.5. Middle East and Africa
- 5.1. Market Analysis, Insights and Forecast - by Improver Type
- 6. Asia Pacific Crude Oil Flow Improvers Market Analysis, Insights and Forecast, 2020-2032
- 6.1. Market Analysis, Insights and Forecast - by Improver Type
- 6.1.1. Paraffin & Asphaltene Inhibitors
- 6.1.2. Drag Reducing Agents
- 6.1.3. Scale & Corrosion Inhibitors
- 6.1.4. Hydrate & Hydrogen Sulfide Inhibitors
- 6.1.5. Others (Demulsifiers, Biocides, etc.,)
- 6.2. Market Analysis, Insights and Forecast - by Application
- 6.2.1. Extraction
- 6.2.2. Pipelines & Transportation
- 6.2.3. Processing
- 6.2.4. Others
- 6.1. Market Analysis, Insights and Forecast - by Improver Type
- 7. North America Crude Oil Flow Improvers Market Analysis, Insights and Forecast, 2020-2032
- 7.1. Market Analysis, Insights and Forecast - by Improver Type
- 7.1.1. Paraffin & Asphaltene Inhibitors
- 7.1.2. Drag Reducing Agents
- 7.1.3. Scale & Corrosion Inhibitors
- 7.1.4. Hydrate & Hydrogen Sulfide Inhibitors
- 7.1.5. Others (Demulsifiers, Biocides, etc.,)
- 7.2. Market Analysis, Insights and Forecast - by Application
- 7.2.1. Extraction
- 7.2.2. Pipelines & Transportation
- 7.2.3. Processing
- 7.2.4. Others
- 7.1. Market Analysis, Insights and Forecast - by Improver Type
- 8. Europe Crude Oil Flow Improvers Market Analysis, Insights and Forecast, 2020-2032
- 8.1. Market Analysis, Insights and Forecast - by Improver Type
- 8.1.1. Paraffin & Asphaltene Inhibitors
- 8.1.2. Drag Reducing Agents
- 8.1.3. Scale & Corrosion Inhibitors
- 8.1.4. Hydrate & Hydrogen Sulfide Inhibitors
- 8.1.5. Others (Demulsifiers, Biocides, etc.,)
- 8.2. Market Analysis, Insights and Forecast - by Application
- 8.2.1. Extraction
- 8.2.2. Pipelines & Transportation
- 8.2.3. Processing
- 8.2.4. Others
- 8.1. Market Analysis, Insights and Forecast - by Improver Type
- 9. South America Crude Oil Flow Improvers Market Analysis, Insights and Forecast, 2020-2032
- 9.1. Market Analysis, Insights and Forecast - by Improver Type
- 9.1.1. Paraffin & Asphaltene Inhibitors
- 9.1.2. Drag Reducing Agents
- 9.1.3. Scale & Corrosion Inhibitors
- 9.1.4. Hydrate & Hydrogen Sulfide Inhibitors
- 9.1.5. Others (Demulsifiers, Biocides, etc.,)
- 9.2. Market Analysis, Insights and Forecast - by Application
- 9.2.1. Extraction
- 9.2.2. Pipelines & Transportation
- 9.2.3. Processing
- 9.2.4. Others
- 9.1. Market Analysis, Insights and Forecast - by Improver Type
- 10. Middle East and Africa Crude Oil Flow Improvers Market Analysis, Insights and Forecast, 2020-2032
- 10.1. Market Analysis, Insights and Forecast - by Improver Type
- 10.1.1. Paraffin & Asphaltene Inhibitors
- 10.1.2. Drag Reducing Agents
- 10.1.3. Scale & Corrosion Inhibitors
- 10.1.4. Hydrate & Hydrogen Sulfide Inhibitors
- 10.1.5. Others (Demulsifiers, Biocides, etc.,)
- 10.2. Market Analysis, Insights and Forecast - by Application
- 10.2.1. Extraction
- 10.2.2. Pipelines & Transportation
- 10.2.3. Processing
- 10.2.4. Others
- 10.1. Market Analysis, Insights and Forecast - by Improver Type
- 11. Competitive Analysis
- 11.1. Global Market Share Analysis 2025
- 11.2. Company Profiles
- 11.2.1 Dorf Ketal
- 11.2.1.1. Overview
- 11.2.1.2. Products
- 11.2.1.3. SWOT Analysis
- 11.2.1.4. Recent Developments
- 11.2.1.5. Financials (Based on Availability)
- 11.2.2 PRODUCTION CHEMICAL GROUP
- 11.2.2.1. Overview
- 11.2.2.2. Products
- 11.2.2.3. SWOT Analysis
- 11.2.2.4. Recent Developments
- 11.2.2.5. Financials (Based on Availability)
- 11.2.3 Baker Hughes
- 11.2.3.1. Overview
- 11.2.3.2. Products
- 11.2.3.3. SWOT Analysis
- 11.2.3.4. Recent Developments
- 11.2.3.5. Financials (Based on Availability)
- 11.2.4 Alberta Treating Chemicals Limited
- 11.2.4.1. Overview
- 11.2.4.2. Products
- 11.2.4.3. SWOT Analysis
- 11.2.4.4. Recent Developments
- 11.2.4.5. Financials (Based on Availability)
- 11.2.5 Croda International Plc
- 11.2.5.1. Overview
- 11.2.5.2. Products
- 11.2.5.3. SWOT Analysis
- 11.2.5.4. Recent Developments
- 11.2.5.5. Financials (Based on Availability)
- 11.2.6 Ashland
- 11.2.6.1. Overview
- 11.2.6.2. Products
- 11.2.6.3. SWOT Analysis
- 11.2.6.4. Recent Developments
- 11.2.6.5. Financials (Based on Availability)
- 11.2.7 BASF SE
- 11.2.7.1. Overview
- 11.2.7.2. Products
- 11.2.7.3. SWOT Analysis
- 11.2.7.4. Recent Developments
- 11.2.7.5. Financials (Based on Availability)
- 11.2.8 Dow
- 11.2.8.1. Overview
- 11.2.8.2. Products
- 11.2.8.3. SWOT Analysis
- 11.2.8.4. Recent Developments
- 11.2.8.5. Financials (Based on Availability)
- 11.2.9 Oil Flux
- 11.2.9.1. Overview
- 11.2.9.2. Products
- 11.2.9.3. SWOT Analysis
- 11.2.9.4. Recent Developments
- 11.2.9.5. Financials (Based on Availability)
- 11.2.10 Halliburton
- 11.2.10.1. Overview
- 11.2.10.2. Products
- 11.2.10.3. SWOT Analysis
- 11.2.10.4. Recent Developments
- 11.2.10.5. Financials (Based on Availability)
- 11.2.11 The Zoranoc Oilfield Chemical
- 11.2.11.1. Overview
- 11.2.11.2. Products
- 11.2.11.3. SWOT Analysis
- 11.2.11.4. Recent Developments
- 11.2.11.5. Financials (Based on Availability)
- 11.2.12 Schlumberger Limited
- 11.2.12.1. Overview
- 11.2.12.2. Products
- 11.2.12.3. SWOT Analysis
- 11.2.12.4. Recent Developments
- 11.2.12.5. Financials (Based on Availability)
- 11.2.13 Innospec
- 11.2.13.1. Overview
- 11.2.13.2. Products
- 11.2.13.3. SWOT Analysis
- 11.2.13.4. Recent Developments
- 11.2.13.5. Financials (Based on Availability)
- 11.2.1 Dorf Ketal
List of Figures
- Figure 1: Global Crude Oil Flow Improvers Market Revenue Breakdown (Billion, %) by Region 2025 & 2033
- Figure 2: Global Crude Oil Flow Improvers Market Volume Breakdown (K Tons, %) by Region 2025 & 2033
- Figure 3: Asia Pacific Crude Oil Flow Improvers Market Revenue (Billion), by Improver Type 2025 & 2033
- Figure 4: Asia Pacific Crude Oil Flow Improvers Market Volume (K Tons), by Improver Type 2025 & 2033
- Figure 5: Asia Pacific Crude Oil Flow Improvers Market Revenue Share (%), by Improver Type 2025 & 2033
- Figure 6: Asia Pacific Crude Oil Flow Improvers Market Volume Share (%), by Improver Type 2025 & 2033
- Figure 7: Asia Pacific Crude Oil Flow Improvers Market Revenue (Billion), by Application 2025 & 2033
- Figure 8: Asia Pacific Crude Oil Flow Improvers Market Volume (K Tons), by Application 2025 & 2033
- Figure 9: Asia Pacific Crude Oil Flow Improvers Market Revenue Share (%), by Application 2025 & 2033
- Figure 10: Asia Pacific Crude Oil Flow Improvers Market Volume Share (%), by Application 2025 & 2033
- Figure 11: Asia Pacific Crude Oil Flow Improvers Market Revenue (Billion), by Country 2025 & 2033
- Figure 12: Asia Pacific Crude Oil Flow Improvers Market Volume (K Tons), by Country 2025 & 2033
- Figure 13: Asia Pacific Crude Oil Flow Improvers Market Revenue Share (%), by Country 2025 & 2033
- Figure 14: Asia Pacific Crude Oil Flow Improvers Market Volume Share (%), by Country 2025 & 2033
- Figure 15: North America Crude Oil Flow Improvers Market Revenue (Billion), by Improver Type 2025 & 2033
- Figure 16: North America Crude Oil Flow Improvers Market Volume (K Tons), by Improver Type 2025 & 2033
- Figure 17: North America Crude Oil Flow Improvers Market Revenue Share (%), by Improver Type 2025 & 2033
- Figure 18: North America Crude Oil Flow Improvers Market Volume Share (%), by Improver Type 2025 & 2033
- Figure 19: North America Crude Oil Flow Improvers Market Revenue (Billion), by Application 2025 & 2033
- Figure 20: North America Crude Oil Flow Improvers Market Volume (K Tons), by Application 2025 & 2033
- Figure 21: North America Crude Oil Flow Improvers Market Revenue Share (%), by Application 2025 & 2033
- Figure 22: North America Crude Oil Flow Improvers Market Volume Share (%), by Application 2025 & 2033
- Figure 23: North America Crude Oil Flow Improvers Market Revenue (Billion), by Country 2025 & 2033
- Figure 24: North America Crude Oil Flow Improvers Market Volume (K Tons), by Country 2025 & 2033
- Figure 25: North America Crude Oil Flow Improvers Market Revenue Share (%), by Country 2025 & 2033
- Figure 26: North America Crude Oil Flow Improvers Market Volume Share (%), by Country 2025 & 2033
- Figure 27: Europe Crude Oil Flow Improvers Market Revenue (Billion), by Improver Type 2025 & 2033
- Figure 28: Europe Crude Oil Flow Improvers Market Volume (K Tons), by Improver Type 2025 & 2033
- Figure 29: Europe Crude Oil Flow Improvers Market Revenue Share (%), by Improver Type 2025 & 2033
- Figure 30: Europe Crude Oil Flow Improvers Market Volume Share (%), by Improver Type 2025 & 2033
- Figure 31: Europe Crude Oil Flow Improvers Market Revenue (Billion), by Application 2025 & 2033
- Figure 32: Europe Crude Oil Flow Improvers Market Volume (K Tons), by Application 2025 & 2033
- Figure 33: Europe Crude Oil Flow Improvers Market Revenue Share (%), by Application 2025 & 2033
- Figure 34: Europe Crude Oil Flow Improvers Market Volume Share (%), by Application 2025 & 2033
- Figure 35: Europe Crude Oil Flow Improvers Market Revenue (Billion), by Country 2025 & 2033
- Figure 36: Europe Crude Oil Flow Improvers Market Volume (K Tons), by Country 2025 & 2033
- Figure 37: Europe Crude Oil Flow Improvers Market Revenue Share (%), by Country 2025 & 2033
- Figure 38: Europe Crude Oil Flow Improvers Market Volume Share (%), by Country 2025 & 2033
- Figure 39: South America Crude Oil Flow Improvers Market Revenue (Billion), by Improver Type 2025 & 2033
- Figure 40: South America Crude Oil Flow Improvers Market Volume (K Tons), by Improver Type 2025 & 2033
- Figure 41: South America Crude Oil Flow Improvers Market Revenue Share (%), by Improver Type 2025 & 2033
- Figure 42: South America Crude Oil Flow Improvers Market Volume Share (%), by Improver Type 2025 & 2033
- Figure 43: South America Crude Oil Flow Improvers Market Revenue (Billion), by Application 2025 & 2033
- Figure 44: South America Crude Oil Flow Improvers Market Volume (K Tons), by Application 2025 & 2033
- Figure 45: South America Crude Oil Flow Improvers Market Revenue Share (%), by Application 2025 & 2033
- Figure 46: South America Crude Oil Flow Improvers Market Volume Share (%), by Application 2025 & 2033
- Figure 47: South America Crude Oil Flow Improvers Market Revenue (Billion), by Country 2025 & 2033
- Figure 48: South America Crude Oil Flow Improvers Market Volume (K Tons), by Country 2025 & 2033
- Figure 49: South America Crude Oil Flow Improvers Market Revenue Share (%), by Country 2025 & 2033
- Figure 50: South America Crude Oil Flow Improvers Market Volume Share (%), by Country 2025 & 2033
- Figure 51: Middle East and Africa Crude Oil Flow Improvers Market Revenue (Billion), by Improver Type 2025 & 2033
- Figure 52: Middle East and Africa Crude Oil Flow Improvers Market Volume (K Tons), by Improver Type 2025 & 2033
- Figure 53: Middle East and Africa Crude Oil Flow Improvers Market Revenue Share (%), by Improver Type 2025 & 2033
- Figure 54: Middle East and Africa Crude Oil Flow Improvers Market Volume Share (%), by Improver Type 2025 & 2033
- Figure 55: Middle East and Africa Crude Oil Flow Improvers Market Revenue (Billion), by Application 2025 & 2033
- Figure 56: Middle East and Africa Crude Oil Flow Improvers Market Volume (K Tons), by Application 2025 & 2033
- Figure 57: Middle East and Africa Crude Oil Flow Improvers Market Revenue Share (%), by Application 2025 & 2033
- Figure 58: Middle East and Africa Crude Oil Flow Improvers Market Volume Share (%), by Application 2025 & 2033
- Figure 59: Middle East and Africa Crude Oil Flow Improvers Market Revenue (Billion), by Country 2025 & 2033
- Figure 60: Middle East and Africa Crude Oil Flow Improvers Market Volume (K Tons), by Country 2025 & 2033
- Figure 61: Middle East and Africa Crude Oil Flow Improvers Market Revenue Share (%), by Country 2025 & 2033
- Figure 62: Middle East and Africa Crude Oil Flow Improvers Market Volume Share (%), by Country 2025 & 2033
List of Tables
- Table 1: Global Crude Oil Flow Improvers Market Revenue Billion Forecast, by Improver Type 2020 & 2033
- Table 2: Global Crude Oil Flow Improvers Market Volume K Tons Forecast, by Improver Type 2020 & 2033
- Table 3: Global Crude Oil Flow Improvers Market Revenue Billion Forecast, by Application 2020 & 2033
- Table 4: Global Crude Oil Flow Improvers Market Volume K Tons Forecast, by Application 2020 & 2033
- Table 5: Global Crude Oil Flow Improvers Market Revenue Billion Forecast, by Region 2020 & 2033
- Table 6: Global Crude Oil Flow Improvers Market Volume K Tons Forecast, by Region 2020 & 2033
- Table 7: Global Crude Oil Flow Improvers Market Revenue Billion Forecast, by Improver Type 2020 & 2033
- Table 8: Global Crude Oil Flow Improvers Market Volume K Tons Forecast, by Improver Type 2020 & 2033
- Table 9: Global Crude Oil Flow Improvers Market Revenue Billion Forecast, by Application 2020 & 2033
- Table 10: Global Crude Oil Flow Improvers Market Volume K Tons Forecast, by Application 2020 & 2033
- Table 11: Global Crude Oil Flow Improvers Market Revenue Billion Forecast, by Country 2020 & 2033
- Table 12: Global Crude Oil Flow Improvers Market Volume K Tons Forecast, by Country 2020 & 2033
- Table 13: China Crude Oil Flow Improvers Market Revenue (Billion) Forecast, by Application 2020 & 2033
- Table 14: China Crude Oil Flow Improvers Market Volume (K Tons) Forecast, by Application 2020 & 2033
- Table 15: India Crude Oil Flow Improvers Market Revenue (Billion) Forecast, by Application 2020 & 2033
- Table 16: India Crude Oil Flow Improvers Market Volume (K Tons) Forecast, by Application 2020 & 2033
- Table 17: Japan Crude Oil Flow Improvers Market Revenue (Billion) Forecast, by Application 2020 & 2033
- Table 18: Japan Crude Oil Flow Improvers Market Volume (K Tons) Forecast, by Application 2020 & 2033
- Table 19: South Korea Crude Oil Flow Improvers Market Revenue (Billion) Forecast, by Application 2020 & 2033
- Table 20: South Korea Crude Oil Flow Improvers Market Volume (K Tons) Forecast, by Application 2020 & 2033
- Table 21: Rest of Asia Pacific Crude Oil Flow Improvers Market Revenue (Billion) Forecast, by Application 2020 & 2033
- Table 22: Rest of Asia Pacific Crude Oil Flow Improvers Market Volume (K Tons) Forecast, by Application 2020 & 2033
- Table 23: Global Crude Oil Flow Improvers Market Revenue Billion Forecast, by Improver Type 2020 & 2033
- Table 24: Global Crude Oil Flow Improvers Market Volume K Tons Forecast, by Improver Type 2020 & 2033
- Table 25: Global Crude Oil Flow Improvers Market Revenue Billion Forecast, by Application 2020 & 2033
- Table 26: Global Crude Oil Flow Improvers Market Volume K Tons Forecast, by Application 2020 & 2033
- Table 27: Global Crude Oil Flow Improvers Market Revenue Billion Forecast, by Country 2020 & 2033
- Table 28: Global Crude Oil Flow Improvers Market Volume K Tons Forecast, by Country 2020 & 2033
- Table 29: United States Crude Oil Flow Improvers Market Revenue (Billion) Forecast, by Application 2020 & 2033
- Table 30: United States Crude Oil Flow Improvers Market Volume (K Tons) Forecast, by Application 2020 & 2033
- Table 31: Canada Crude Oil Flow Improvers Market Revenue (Billion) Forecast, by Application 2020 & 2033
- Table 32: Canada Crude Oil Flow Improvers Market Volume (K Tons) Forecast, by Application 2020 & 2033
- Table 33: Mexico Crude Oil Flow Improvers Market Revenue (Billion) Forecast, by Application 2020 & 2033
- Table 34: Mexico Crude Oil Flow Improvers Market Volume (K Tons) Forecast, by Application 2020 & 2033
- Table 35: Global Crude Oil Flow Improvers Market Revenue Billion Forecast, by Improver Type 2020 & 2033
- Table 36: Global Crude Oil Flow Improvers Market Volume K Tons Forecast, by Improver Type 2020 & 2033
- Table 37: Global Crude Oil Flow Improvers Market Revenue Billion Forecast, by Application 2020 & 2033
- Table 38: Global Crude Oil Flow Improvers Market Volume K Tons Forecast, by Application 2020 & 2033
- Table 39: Global Crude Oil Flow Improvers Market Revenue Billion Forecast, by Country 2020 & 2033
- Table 40: Global Crude Oil Flow Improvers Market Volume K Tons Forecast, by Country 2020 & 2033
- Table 41: Germany Crude Oil Flow Improvers Market Revenue (Billion) Forecast, by Application 2020 & 2033
- Table 42: Germany Crude Oil Flow Improvers Market Volume (K Tons) Forecast, by Application 2020 & 2033
- Table 43: United Kingdom Crude Oil Flow Improvers Market Revenue (Billion) Forecast, by Application 2020 & 2033
- Table 44: United Kingdom Crude Oil Flow Improvers Market Volume (K Tons) Forecast, by Application 2020 & 2033
- Table 45: Italy Crude Oil Flow Improvers Market Revenue (Billion) Forecast, by Application 2020 & 2033
- Table 46: Italy Crude Oil Flow Improvers Market Volume (K Tons) Forecast, by Application 2020 & 2033
- Table 47: France Crude Oil Flow Improvers Market Revenue (Billion) Forecast, by Application 2020 & 2033
- Table 48: France Crude Oil Flow Improvers Market Volume (K Tons) Forecast, by Application 2020 & 2033
- Table 49: Rest of Europe Crude Oil Flow Improvers Market Revenue (Billion) Forecast, by Application 2020 & 2033
- Table 50: Rest of Europe Crude Oil Flow Improvers Market Volume (K Tons) Forecast, by Application 2020 & 2033
- Table 51: Global Crude Oil Flow Improvers Market Revenue Billion Forecast, by Improver Type 2020 & 2033
- Table 52: Global Crude Oil Flow Improvers Market Volume K Tons Forecast, by Improver Type 2020 & 2033
- Table 53: Global Crude Oil Flow Improvers Market Revenue Billion Forecast, by Application 2020 & 2033
- Table 54: Global Crude Oil Flow Improvers Market Volume K Tons Forecast, by Application 2020 & 2033
- Table 55: Global Crude Oil Flow Improvers Market Revenue Billion Forecast, by Country 2020 & 2033
- Table 56: Global Crude Oil Flow Improvers Market Volume K Tons Forecast, by Country 2020 & 2033
- Table 57: Brazil Crude Oil Flow Improvers Market Revenue (Billion) Forecast, by Application 2020 & 2033
- Table 58: Brazil Crude Oil Flow Improvers Market Volume (K Tons) Forecast, by Application 2020 & 2033
- Table 59: Argentina Crude Oil Flow Improvers Market Revenue (Billion) Forecast, by Application 2020 & 2033
- Table 60: Argentina Crude Oil Flow Improvers Market Volume (K Tons) Forecast, by Application 2020 & 2033
- Table 61: Rest of South America Crude Oil Flow Improvers Market Revenue (Billion) Forecast, by Application 2020 & 2033
- Table 62: Rest of South America Crude Oil Flow Improvers Market Volume (K Tons) Forecast, by Application 2020 & 2033
- Table 63: Global Crude Oil Flow Improvers Market Revenue Billion Forecast, by Improver Type 2020 & 2033
- Table 64: Global Crude Oil Flow Improvers Market Volume K Tons Forecast, by Improver Type 2020 & 2033
- Table 65: Global Crude Oil Flow Improvers Market Revenue Billion Forecast, by Application 2020 & 2033
- Table 66: Global Crude Oil Flow Improvers Market Volume K Tons Forecast, by Application 2020 & 2033
- Table 67: Global Crude Oil Flow Improvers Market Revenue Billion Forecast, by Country 2020 & 2033
- Table 68: Global Crude Oil Flow Improvers Market Volume K Tons Forecast, by Country 2020 & 2033
- Table 69: Saudi Arabia Crude Oil Flow Improvers Market Revenue (Billion) Forecast, by Application 2020 & 2033
- Table 70: Saudi Arabia Crude Oil Flow Improvers Market Volume (K Tons) Forecast, by Application 2020 & 2033
- Table 71: South Africa Crude Oil Flow Improvers Market Revenue (Billion) Forecast, by Application 2020 & 2033
- Table 72: South Africa Crude Oil Flow Improvers Market Volume (K Tons) Forecast, by Application 2020 & 2033
- Table 73: Rest of Middle East and Africa Crude Oil Flow Improvers Market Revenue (Billion) Forecast, by Application 2020 & 2033
- Table 74: Rest of Middle East and Africa Crude Oil Flow Improvers Market Volume (K Tons) Forecast, by Application 2020 & 2033
Frequently Asked Questions
1. What is the projected Compound Annual Growth Rate (CAGR) of the Crude Oil Flow Improvers Market?
The projected CAGR is approximately 5.00%.
2. Which companies are prominent players in the Crude Oil Flow Improvers Market?
Key companies in the market include Dorf Ketal, PRODUCTION CHEMICAL GROUP, Baker Hughes, Alberta Treating Chemicals Limited, Croda International Plc, Ashland, BASF SE, Dow, Oil Flux, Halliburton, The Zoranoc Oilfield Chemical, Schlumberger Limited, Innospec.
3. What are the main segments of the Crude Oil Flow Improvers Market?
The market segments include Improver Type, Application.
4. Can you provide details about the market size?
The market size is estimated to be USD 1.7 Billion as of 2022.
5. What are some drivers contributing to market growth?
; Growing Demand For Paraffin & Asphaltene Inhibitors; Increasing Demand for Petroleum Based Products.
6. What are the notable trends driving market growth?
Growing Demand for Paraffin & Asphaltene Inhibitors.
7. Are there any restraints impacting market growth?
; Stringent Environmental Regulations; Unfavourable Conditions Arising Due to the COVID-19 Outbreak.
8. Can you provide examples of recent developments in the market?
N/A
9. What pricing options are available for accessing the report?
Pricing options include single-user, multi-user, and enterprise licenses priced at USD 3,950, USD 4,950, and USD 6,950 respectively.
10. Is the market size provided in terms of value or volume?
The market size is provided in terms of value, measured in Billion and volume, measured in K Tons.
11. Are there any specific market keywords associated with the report?
Yes, the market keyword associated with the report is "Crude Oil Flow Improvers Market," which aids in identifying and referencing the specific market segment covered.
12. How do I determine which pricing option suits my needs best?
The pricing options vary based on user requirements and access needs. Individual users may opt for single-user licenses, while businesses requiring broader access may choose multi-user or enterprise licenses for cost-effective access to the report.
13. Are there any additional resources or data provided in the Crude Oil Flow Improvers Market report?
While the report offers comprehensive insights, it's advisable to review the specific contents or supplementary materials provided to ascertain if additional resources or data are available.
14. How can I stay updated on further developments or reports in the Crude Oil Flow Improvers Market?
To stay informed about further developments, trends, and reports in the Crude Oil Flow Improvers Market, consider subscribing to industry newsletters, following relevant companies and organizations, or regularly checking reputable industry news sources and publications.
Methodology
Step 1 - Identification of Relevant Samples Size from Population Database


Step 2 - Approaches for Defining Global Market Size (Value, Volume* & Price*)

Note*: In applicable scenarios
Step 3 - Data Sources
Primary Research
- Web Analytics
- Survey Reports
- Research Institute
- Latest Research Reports
- Opinion Leaders
Secondary Research
- Annual Reports
- White Paper
- Latest Press Release
- Industry Association
- Paid Database
- Investor Presentations

Step 4 - Data Triangulation
Involves using different sources of information in order to increase the validity of a study
These sources are likely to be stakeholders in a program - participants, other researchers, program staff, other community members, and so on.
Then we put all data in single framework & apply various statistical tools to find out the dynamic on the market.
During the analysis stage, feedback from the stakeholder groups would be compared to determine areas of agreement as well as areas of divergence