

Key Insights
The cryogenic equipment market, valued at approximately $26.6 billion in 2025, is projected to experience robust growth with a Compound Annual Growth Rate (CAGR) of 6.8% from 2025 to 2033. This expansion is driven by increasing demand across diverse end-user industries. Key sectors include oil and gas for liquefied natural gas (LNG) processing and transportation, and energy and power for advanced energy storage and efficient generation. Furthermore, advancements in food and beverage processing and expanding medical applications like cryopreservation are significant growth contributors. The market is segmented by equipment type (tanks, pumps, heat exchangers, valves), application (storage, transportation, processing), and gas type (liquefied nitrogen, helium). Growth will be propelled by technological advancements focused on improving efficiency and reducing operational costs, supported by government regulations promoting energy efficiency and environmental sustainability. Challenges include high initial investment and the need for specialized expertise. Significant growth opportunities lie in geographic expansion, particularly in emerging economies across Asia-Pacific and the Middle East & Africa.
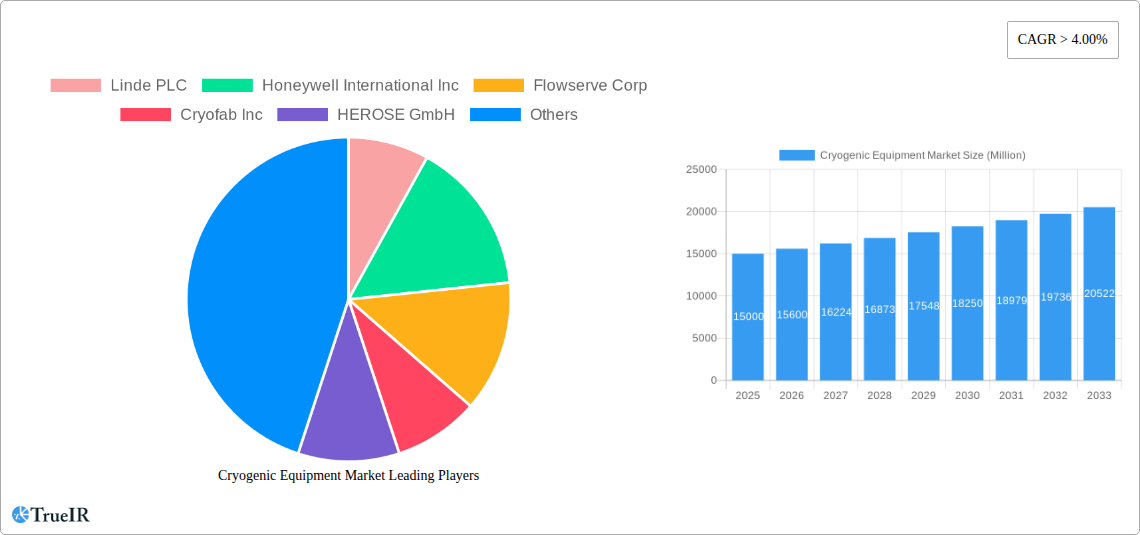
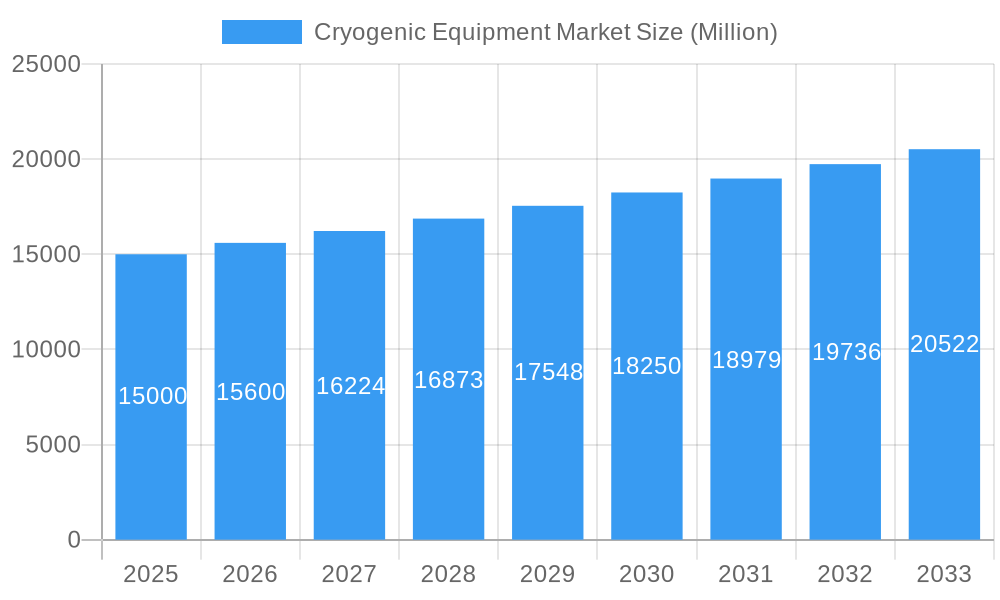
Cryogenic Equipment Market Market Size (In Billion)
Geographically, North America and Europe currently lead the cryogenic equipment market. However, rapidly industrializing nations in Asia-Pacific, including China, India, and Southeast Asia, are becoming critical growth drivers. The competitive landscape features established global players such as Linde PLC, Honeywell International Inc., and Chart Industries Inc., alongside regional manufacturers. Strategic collaborations, mergers, acquisitions, and technological innovation will define future market dynamics. Addressing cost reduction, enhancing equipment reliability, and exploring new applications in renewable energy and biotechnology are crucial for sustained growth. The ongoing focus on sustainable practices and technological progress positions the cryogenic equipment market for continued expansion and diversification.
Cryogenic Equipment Market Company Market Share
Cryogenic Equipment Market: A Comprehensive Report (2019-2033)
This dynamic report provides a comprehensive analysis of the Cryogenic Equipment Market, offering invaluable insights for industry stakeholders. Covering the period from 2019 to 2033, with a focus on 2025, this study delves into market structure, competitive dynamics, growth drivers, challenges, and future outlook. The report leverages extensive data analysis to project market size and growth trajectory, equipping businesses with the knowledge needed to navigate this rapidly evolving sector.
Cryogenic Equipment Market Structure & Competitive Landscape
The Cryogenic Equipment Market is moderately concentrated, with several major players dominating significant market shares. While precise concentration ratios are unavailable (xx), Linde PLC, Honeywell International Inc., Flowserve Corp., Chart Industries Inc., and Sumitomo Heavy Industries Ltd. are key players, driving innovation and shaping market dynamics. The market exhibits a competitive landscape characterized by ongoing product development, strategic partnerships, and mergers & acquisitions (M&A). M&A activity in the recent past has been moderate (xx transactions in the last 5 years).
- Innovation Drivers: Technological advancements in cryogenic equipment design, materials, and energy efficiency are crucial drivers, fostering the development of more compact, reliable, and cost-effective solutions.
- Regulatory Impacts: Stringent environmental regulations concerning refrigerant gases and safety standards significantly influence market trends, prompting the adoption of eco-friendly and safer technologies.
- Product Substitutes: Limited direct substitutes exist, but alternative cooling technologies and pressure vessel materials continuously challenge cryogenic equipment's dominance in specific applications.
- End-User Segmentation: The market is diverse, encompassing various end-user industries, each with unique requirements and growth trajectories. Oil and gas, energy and power, and healthcare are prominent sectors.
- M&A Trends: Strategic acquisitions aim to expand product portfolios, enhance geographical reach, and consolidate market share. Future M&A activity is anticipated to be moderate, with a focus on technological integration and vertical expansion.
Cryogenic Equipment Market Trends & Opportunities
The Cryogenic Equipment Market is experiencing robust growth, driven by rising demand across diverse sectors. The market size is estimated at xx Million in 2025 and projected to reach xx Million by 2033, exhibiting a Compound Annual Growth Rate (CAGR) of xx%. This growth is fueled by several factors:
- Technological Advancements: Innovations in materials science, design optimization, and automation are enhancing equipment efficiency and reliability, making cryogenic technologies increasingly cost-effective.
- Expanding Applications: Cryogenic technologies are finding applications in new areas such as medical imaging, energy storage, and high-speed transportation, broadening market opportunities.
- Stringent Environmental Regulations: Governments worldwide are enforcing stringent regulations aimed at reducing greenhouse gas emissions, encouraging the use of cryogenic solutions for CO2 capture and other environmentally friendly applications. This factor alone is driving xx% of market expansion.
- Competitive Dynamics: Intense competition fosters product innovation, price optimization, and continuous improvement in service quality, benefiting end-users.
Dominant Markets & Segments in Cryogenic Equipment Market
The Oil and Gas sector is currently the dominant end-user industry, with the highest market share (xx%), driven by extensive liquefied natural gas (LNG) transportation and processing. North America is a leading regional market, followed by Asia Pacific.
Key Growth Drivers:
- Infrastructure Development: Investments in energy infrastructure, particularly LNG terminals and pipelines, fuel demand for cryogenic equipment.
- Government Policies: Supportive policies promoting energy efficiency and clean energy technologies are bolstering market growth.
- Technological Advancements: Innovations in cryogenic equipment reduce operating costs and improve efficiency, making these technologies more attractive.
Market Dominance Analysis:
The Oil and Gas segment's dominance is attributable to the substantial investments in LNG infrastructure and the increasing demand for natural gas as a cleaner fuel source. However, the Food & Beverage and Healthcare sectors are emerging as significant growth segments, driven by increasing demand for cryogenic freezing and medical applications, respectively. Tanks and Pumps represent the largest equipment segments. Liquified Nitrogen is the most widely used gas.
Cryogenic Equipment Market Product Analysis
Cryogenic equipment manufacturers are focusing on developing high-efficiency, compact, and low-maintenance systems. Advancements in materials science, such as the use of advanced alloys and composites, enhance durability and reliability. Innovations in automation and control systems improve operational efficiency and reduce energy consumption. These advancements enhance market fit by reducing overall costs and risks, increasing customer appeal.
Key Drivers, Barriers & Challenges in Cryogenic Equipment Market
Key Drivers:
Rising demand across diverse sectors, such as oil & gas and healthcare, coupled with technological advancements driving efficiency and cost reductions, significantly propel market growth. Government regulations promoting cleaner energy sources and efficient resource utilization are further bolstering the market.
Challenges:
High initial investment costs, complex operational requirements, and the need for specialized expertise can hinder market penetration. Supply chain disruptions and stringent safety regulations pose additional challenges impacting the profitability and growth potential. Furthermore, volatile raw material prices, including specialized metals and polymers, cause cost fluctuations.
Growth Drivers in the Cryogenic Equipment Market
Technological advancements, such as the development of lighter and more efficient materials, automated control systems, and improved insulation techniques, are driving market growth. Government initiatives supporting the adoption of clean energy technologies and investments in infrastructure projects, like LNG terminals, further propel expansion.
Challenges Impacting Cryogenic Equipment Market Growth
Stringent safety and environmental regulations increase operational costs and complexity. Supply chain disruptions related to specialized components and skilled labor shortages can cause production delays and price increases. Intense competition among established players can pressure profit margins.
Key Players Shaping the Cryogenic Equipment Market Market
- Linde PLC
- Honeywell International Inc
- Flowserve Corp
- Cryofab Inc
- HEROSE GmbH
- Emerson Electric Co
- Chart Industries Inc
- McDermott International Inc
- Sumitomo Heavy Industries Ltd
- Beijing Tianhai Industry Co Ltd
Significant Cryogenic Equipment Market Industry Milestones
- January 2022: Saulsbury awarded EPC contract for two cryogenic processing facilities (200 MMSCFD each), expanding its capacity to nearly 11 BCFD. This highlights the significant growth in the cryogenic processing sector for the oil and gas industry.
- October 2021: Chemie-Tech awarded contract for Cryogenic Double Wall Storage Tanks and associated facilities at HPCL Rajasthan Refinery. This demonstrates the increasing demand for advanced cryogenic storage solutions in the refining and petrochemical industry.
Future Outlook for Cryogenic Equipment Market Market
The Cryogenic Equipment Market is poised for continued growth, fueled by expanding applications, technological innovation, and supportive government policies. Strategic investments in research and development, focusing on energy efficiency and sustainability, will further enhance market potential. The increasing demand for LNG and other cryogenically processed gases across various sectors will drive demand for advanced cryogenic equipment.
Cryogenic Equipment Market Segmentation
-
1. Equipment
- 1.1. Tanks
- 1.2. Pumps
- 1.3. Heat Exchanger
- 1.4. Valves
- 1.5. Other Equipment
-
2. Application
- 2.1. Storage
- 2.2. Transportation and Distribution
- 2.3. Processing
- 2.4. Other Applications
-
3. Gas Used
- 3.1. Liquified Nitrogen
- 3.2. Liquified Helium
- 3.3. Other Gases Used
-
4. End-user Industry
- 4.1. Oil and Gas
- 4.2. Energy and Power
- 4.3. Food and Beverages
- 4.4. Marine and Areospace
- 4.5. Chemical and Healthcare
- 4.6. Other End-user Industries
Cryogenic Equipment Market Segmentation By Geography
- 1. North America
- 2. Europe
- 3. Asia Pacific
- 4. South America
- 5. Middle East and Africa
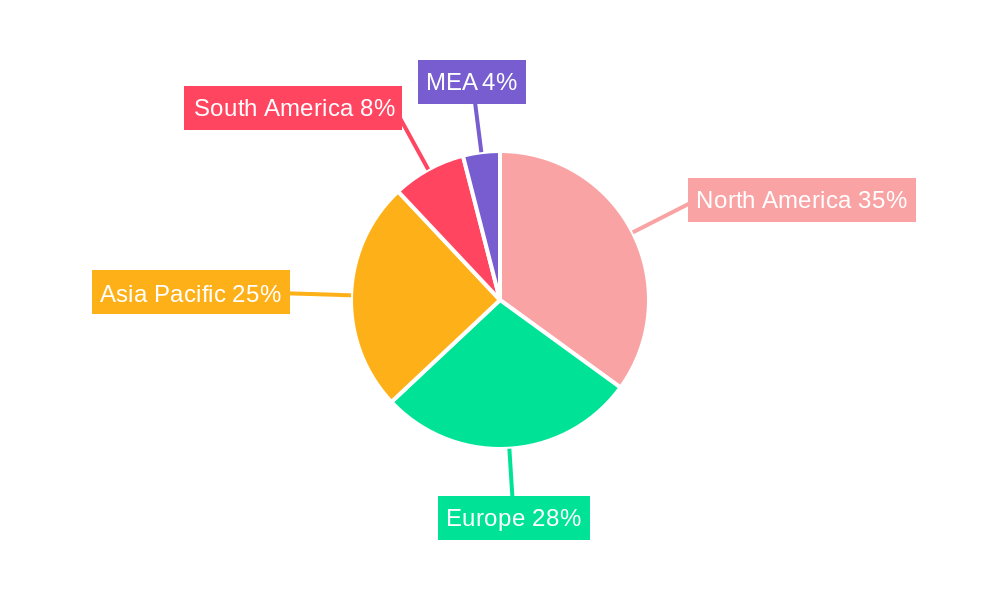
Cryogenic Equipment Market Regional Market Share
Geographic Coverage of Cryogenic Equipment Market
Cryogenic Equipment Market REPORT HIGHLIGHTS
| Aspects | Details |
|---|---|
| Study Period | 2020-2034 |
| Base Year | 2025 |
| Estimated Year | 2026 |
| Forecast Period | 2026-2034 |
| Historical Period | 2020-2025 |
| Growth Rate | CAGR of 6.8% from 2020-2034 |
| Segmentation |
|
Table of Contents
- 1. Introduction
- 1.1. Research Scope
- 1.2. Market Segmentation
- 1.3. Research Objective
- 1.4. Definitions and Assumptions
- 2. Executive Summary
- 2.1. Market Snapshot
- 3. Market Dynamics
- 3.1. Market Drivers
- 3.2. Market Restrains
- 3.3. Market Trends
- 3.4. Market Opportunities
- 4. Market Factor Analysis
- 4.1. Porters Five Forces
- 4.1.1. Bargaining Power of Suppliers
- 4.1.2. Bargaining Power of Buyers
- 4.1.3. Threat of New Entrants
- 4.1.4. Threat of Substitutes
- 4.1.5. Competitive Rivalry
- 4.2. PESTEL analysis
- 4.3. BCG Analysis
- 4.3.1. Stars (High Growth, High Market Share)
- 4.3.2. Cash Cows (Low Growth, High Market Share)
- 4.3.3. Question Mark (High Growth, Low Market Share)
- 4.3.4. Dogs (Low Growth, Low Market Share)
- 4.4. Ansoff Matrix Analysis
- 4.5. Supply Chain Analysis
- 4.6. Regulatory Landscape
- 4.7. Current Market Potential and Opportunity Assessment (TAM–SAM–SOM Framework)
- 4.8. TIR Analyst Note
- 4.1. Porters Five Forces
- 5. Market Analysis, Insights and Forecast 2021-2033
- 5.1. Market Analysis, Insights and Forecast - by Equipment
- 5.1.1. Tanks
- 5.1.2. Pumps
- 5.1.3. Heat Exchanger
- 5.1.4. Valves
- 5.1.5. Other Equipment
- 5.2. Market Analysis, Insights and Forecast - by Application
- 5.2.1. Storage
- 5.2.2. Transportation and Distribution
- 5.2.3. Processing
- 5.2.4. Other Applications
- 5.3. Market Analysis, Insights and Forecast - by Gas Used
- 5.3.1. Liquified Nitrogen
- 5.3.2. Liquified Helium
- 5.3.3. Other Gases Used
- 5.4. Market Analysis, Insights and Forecast - by End-user Industry
- 5.4.1. Oil and Gas
- 5.4.2. Energy and Power
- 5.4.3. Food and Beverages
- 5.4.4. Marine and Areospace
- 5.4.5. Chemical and Healthcare
- 5.4.6. Other End-user Industries
- 5.5. Market Analysis, Insights and Forecast - by Region
- 5.5.1. North America
- 5.5.2. Europe
- 5.5.3. Asia Pacific
- 5.5.4. South America
- 5.5.5. Middle East and Africa
- 5.1. Market Analysis, Insights and Forecast - by Equipment
- 6. Global Cryogenic Equipment Market Analysis, Insights and Forecast, 2021-2033
- 6.1. Market Analysis, Insights and Forecast - by Equipment
- 6.1.1. Tanks
- 6.1.2. Pumps
- 6.1.3. Heat Exchanger
- 6.1.4. Valves
- 6.1.5. Other Equipment
- 6.2. Market Analysis, Insights and Forecast - by Application
- 6.2.1. Storage
- 6.2.2. Transportation and Distribution
- 6.2.3. Processing
- 6.2.4. Other Applications
- 6.3. Market Analysis, Insights and Forecast - by Gas Used
- 6.3.1. Liquified Nitrogen
- 6.3.2. Liquified Helium
- 6.3.3. Other Gases Used
- 6.4. Market Analysis, Insights and Forecast - by End-user Industry
- 6.4.1. Oil and Gas
- 6.4.2. Energy and Power
- 6.4.3. Food and Beverages
- 6.4.4. Marine and Areospace
- 6.4.5. Chemical and Healthcare
- 6.4.6. Other End-user Industries
- 6.1. Market Analysis, Insights and Forecast - by Equipment
- 7. North America Cryogenic Equipment Market Analysis, Insights and Forecast, 2020-2032
- 7.1. Market Analysis, Insights and Forecast - by Equipment
- 7.1.1. Tanks
- 7.1.2. Pumps
- 7.1.3. Heat Exchanger
- 7.1.4. Valves
- 7.1.5. Other Equipment
- 7.2. Market Analysis, Insights and Forecast - by Application
- 7.2.1. Storage
- 7.2.2. Transportation and Distribution
- 7.2.3. Processing
- 7.2.4. Other Applications
- 7.3. Market Analysis, Insights and Forecast - by Gas Used
- 7.3.1. Liquified Nitrogen
- 7.3.2. Liquified Helium
- 7.3.3. Other Gases Used
- 7.4. Market Analysis, Insights and Forecast - by End-user Industry
- 7.4.1. Oil and Gas
- 7.4.2. Energy and Power
- 7.4.3. Food and Beverages
- 7.4.4. Marine and Areospace
- 7.4.5. Chemical and Healthcare
- 7.4.6. Other End-user Industries
- 7.1. Market Analysis, Insights and Forecast - by Equipment
- 8. Europe Cryogenic Equipment Market Analysis, Insights and Forecast, 2020-2032
- 8.1. Market Analysis, Insights and Forecast - by Equipment
- 8.1.1. Tanks
- 8.1.2. Pumps
- 8.1.3. Heat Exchanger
- 8.1.4. Valves
- 8.1.5. Other Equipment
- 8.2. Market Analysis, Insights and Forecast - by Application
- 8.2.1. Storage
- 8.2.2. Transportation and Distribution
- 8.2.3. Processing
- 8.2.4. Other Applications
- 8.3. Market Analysis, Insights and Forecast - by Gas Used
- 8.3.1. Liquified Nitrogen
- 8.3.2. Liquified Helium
- 8.3.3. Other Gases Used
- 8.4. Market Analysis, Insights and Forecast - by End-user Industry
- 8.4.1. Oil and Gas
- 8.4.2. Energy and Power
- 8.4.3. Food and Beverages
- 8.4.4. Marine and Areospace
- 8.4.5. Chemical and Healthcare
- 8.4.6. Other End-user Industries
- 8.1. Market Analysis, Insights and Forecast - by Equipment
- 9. Asia Pacific Cryogenic Equipment Market Analysis, Insights and Forecast, 2020-2032
- 9.1. Market Analysis, Insights and Forecast - by Equipment
- 9.1.1. Tanks
- 9.1.2. Pumps
- 9.1.3. Heat Exchanger
- 9.1.4. Valves
- 9.1.5. Other Equipment
- 9.2. Market Analysis, Insights and Forecast - by Application
- 9.2.1. Storage
- 9.2.2. Transportation and Distribution
- 9.2.3. Processing
- 9.2.4. Other Applications
- 9.3. Market Analysis, Insights and Forecast - by Gas Used
- 9.3.1. Liquified Nitrogen
- 9.3.2. Liquified Helium
- 9.3.3. Other Gases Used
- 9.4. Market Analysis, Insights and Forecast - by End-user Industry
- 9.4.1. Oil and Gas
- 9.4.2. Energy and Power
- 9.4.3. Food and Beverages
- 9.4.4. Marine and Areospace
- 9.4.5. Chemical and Healthcare
- 9.4.6. Other End-user Industries
- 9.1. Market Analysis, Insights and Forecast - by Equipment
- 10. South America Cryogenic Equipment Market Analysis, Insights and Forecast, 2020-2032
- 10.1. Market Analysis, Insights and Forecast - by Equipment
- 10.1.1. Tanks
- 10.1.2. Pumps
- 10.1.3. Heat Exchanger
- 10.1.4. Valves
- 10.1.5. Other Equipment
- 10.2. Market Analysis, Insights and Forecast - by Application
- 10.2.1. Storage
- 10.2.2. Transportation and Distribution
- 10.2.3. Processing
- 10.2.4. Other Applications
- 10.3. Market Analysis, Insights and Forecast - by Gas Used
- 10.3.1. Liquified Nitrogen
- 10.3.2. Liquified Helium
- 10.3.3. Other Gases Used
- 10.4. Market Analysis, Insights and Forecast - by End-user Industry
- 10.4.1. Oil and Gas
- 10.4.2. Energy and Power
- 10.4.3. Food and Beverages
- 10.4.4. Marine and Areospace
- 10.4.5. Chemical and Healthcare
- 10.4.6. Other End-user Industries
- 10.1. Market Analysis, Insights and Forecast - by Equipment
- 11. Middle East and Africa Cryogenic Equipment Market Analysis, Insights and Forecast, 2020-2032
- 11.1. Market Analysis, Insights and Forecast - by Equipment
- 11.1.1. Tanks
- 11.1.2. Pumps
- 11.1.3. Heat Exchanger
- 11.1.4. Valves
- 11.1.5. Other Equipment
- 11.2. Market Analysis, Insights and Forecast - by Application
- 11.2.1. Storage
- 11.2.2. Transportation and Distribution
- 11.2.3. Processing
- 11.2.4. Other Applications
- 11.3. Market Analysis, Insights and Forecast - by Gas Used
- 11.3.1. Liquified Nitrogen
- 11.3.2. Liquified Helium
- 11.3.3. Other Gases Used
- 11.4. Market Analysis, Insights and Forecast - by End-user Industry
- 11.4.1. Oil and Gas
- 11.4.2. Energy and Power
- 11.4.3. Food and Beverages
- 11.4.4. Marine and Areospace
- 11.4.5. Chemical and Healthcare
- 11.4.6. Other End-user Industries
- 11.1. Market Analysis, Insights and Forecast - by Equipment
- 12. Competitive Analysis
- 12.1. Company Profiles
- 12.1.1 Linde PLC
- 12.1.1.1. Company Overview
- 12.1.1.2. Products
- 12.1.1.3. Company Financials
- 12.1.1.4. SWOT Analysis
- 12.1.2 Honeywell International Inc
- 12.1.2.1. Company Overview
- 12.1.2.2. Products
- 12.1.2.3. Company Financials
- 12.1.2.4. SWOT Analysis
- 12.1.3 Flowserve Corp
- 12.1.3.1. Company Overview
- 12.1.3.2. Products
- 12.1.3.3. Company Financials
- 12.1.3.4. SWOT Analysis
- 12.1.4 Cryofab Inc
- 12.1.4.1. Company Overview
- 12.1.4.2. Products
- 12.1.4.3. Company Financials
- 12.1.4.4. SWOT Analysis
- 12.1.5 HEROSE GmbH
- 12.1.5.1. Company Overview
- 12.1.5.2. Products
- 12.1.5.3. Company Financials
- 12.1.5.4. SWOT Analysis
- 12.1.6 Emerson Electric Co
- 12.1.6.1. Company Overview
- 12.1.6.2. Products
- 12.1.6.3. Company Financials
- 12.1.6.4. SWOT Analysis
- 12.1.7 Chart Industries Inc
- 12.1.7.1. Company Overview
- 12.1.7.2. Products
- 12.1.7.3. Company Financials
- 12.1.7.4. SWOT Analysis
- 12.1.8 McDermott International Inc
- 12.1.8.1. Company Overview
- 12.1.8.2. Products
- 12.1.8.3. Company Financials
- 12.1.8.4. SWOT Analysis
- 12.1.9 Sumitomo Heavy Industries Ltd
- 12.1.9.1. Company Overview
- 12.1.9.2. Products
- 12.1.9.3. Company Financials
- 12.1.9.4. SWOT Analysis
- 12.1.10 Beijing Tianhai Industry Co Ltd
- 12.1.10.1. Company Overview
- 12.1.10.2. Products
- 12.1.10.3. Company Financials
- 12.1.10.4. SWOT Analysis
- 12.1.1 Linde PLC
- 12.2. Market Entropy
- 12.2.1 Company's Key Areas Served
- 12.2.2 Recent Developments
- 12.3. Company Market Share Analysis 2025
- 12.3.1 Top 5 Companies Market Share Analysis
- 12.3.2 Top 3 Companies Market Share Analysis
- 12.4. List of Potential Customers
- 13. Research Methodology
List of Figures
- Figure 1: Global Cryogenic Equipment Market Revenue Breakdown (billion, %) by Region 2025 & 2033
- Figure 2: Global Cryogenic Equipment Market Volume Breakdown (K Unit, %) by Region 2025 & 2033
- Figure 3: North America Cryogenic Equipment Market Revenue (billion), by Equipment 2025 & 2033
- Figure 4: North America Cryogenic Equipment Market Volume (K Unit), by Equipment 2025 & 2033
- Figure 5: North America Cryogenic Equipment Market Revenue Share (%), by Equipment 2025 & 2033
- Figure 6: North America Cryogenic Equipment Market Volume Share (%), by Equipment 2025 & 2033
- Figure 7: North America Cryogenic Equipment Market Revenue (billion), by Application 2025 & 2033
- Figure 8: North America Cryogenic Equipment Market Volume (K Unit), by Application 2025 & 2033
- Figure 9: North America Cryogenic Equipment Market Revenue Share (%), by Application 2025 & 2033
- Figure 10: North America Cryogenic Equipment Market Volume Share (%), by Application 2025 & 2033
- Figure 11: North America Cryogenic Equipment Market Revenue (billion), by Gas Used 2025 & 2033
- Figure 12: North America Cryogenic Equipment Market Volume (K Unit), by Gas Used 2025 & 2033
- Figure 13: North America Cryogenic Equipment Market Revenue Share (%), by Gas Used 2025 & 2033
- Figure 14: North America Cryogenic Equipment Market Volume Share (%), by Gas Used 2025 & 2033
- Figure 15: North America Cryogenic Equipment Market Revenue (billion), by End-user Industry 2025 & 2033
- Figure 16: North America Cryogenic Equipment Market Volume (K Unit), by End-user Industry 2025 & 2033
- Figure 17: North America Cryogenic Equipment Market Revenue Share (%), by End-user Industry 2025 & 2033
- Figure 18: North America Cryogenic Equipment Market Volume Share (%), by End-user Industry 2025 & 2033
- Figure 19: North America Cryogenic Equipment Market Revenue (billion), by Country 2025 & 2033
- Figure 20: North America Cryogenic Equipment Market Volume (K Unit), by Country 2025 & 2033
- Figure 21: North America Cryogenic Equipment Market Revenue Share (%), by Country 2025 & 2033
- Figure 22: North America Cryogenic Equipment Market Volume Share (%), by Country 2025 & 2033
- Figure 23: Europe Cryogenic Equipment Market Revenue (billion), by Equipment 2025 & 2033
- Figure 24: Europe Cryogenic Equipment Market Volume (K Unit), by Equipment 2025 & 2033
- Figure 25: Europe Cryogenic Equipment Market Revenue Share (%), by Equipment 2025 & 2033
- Figure 26: Europe Cryogenic Equipment Market Volume Share (%), by Equipment 2025 & 2033
- Figure 27: Europe Cryogenic Equipment Market Revenue (billion), by Application 2025 & 2033
- Figure 28: Europe Cryogenic Equipment Market Volume (K Unit), by Application 2025 & 2033
- Figure 29: Europe Cryogenic Equipment Market Revenue Share (%), by Application 2025 & 2033
- Figure 30: Europe Cryogenic Equipment Market Volume Share (%), by Application 2025 & 2033
- Figure 31: Europe Cryogenic Equipment Market Revenue (billion), by Gas Used 2025 & 2033
- Figure 32: Europe Cryogenic Equipment Market Volume (K Unit), by Gas Used 2025 & 2033
- Figure 33: Europe Cryogenic Equipment Market Revenue Share (%), by Gas Used 2025 & 2033
- Figure 34: Europe Cryogenic Equipment Market Volume Share (%), by Gas Used 2025 & 2033
- Figure 35: Europe Cryogenic Equipment Market Revenue (billion), by End-user Industry 2025 & 2033
- Figure 36: Europe Cryogenic Equipment Market Volume (K Unit), by End-user Industry 2025 & 2033
- Figure 37: Europe Cryogenic Equipment Market Revenue Share (%), by End-user Industry 2025 & 2033
- Figure 38: Europe Cryogenic Equipment Market Volume Share (%), by End-user Industry 2025 & 2033
- Figure 39: Europe Cryogenic Equipment Market Revenue (billion), by Country 2025 & 2033
- Figure 40: Europe Cryogenic Equipment Market Volume (K Unit), by Country 2025 & 2033
- Figure 41: Europe Cryogenic Equipment Market Revenue Share (%), by Country 2025 & 2033
- Figure 42: Europe Cryogenic Equipment Market Volume Share (%), by Country 2025 & 2033
- Figure 43: Asia Pacific Cryogenic Equipment Market Revenue (billion), by Equipment 2025 & 2033
- Figure 44: Asia Pacific Cryogenic Equipment Market Volume (K Unit), by Equipment 2025 & 2033
- Figure 45: Asia Pacific Cryogenic Equipment Market Revenue Share (%), by Equipment 2025 & 2033
- Figure 46: Asia Pacific Cryogenic Equipment Market Volume Share (%), by Equipment 2025 & 2033
- Figure 47: Asia Pacific Cryogenic Equipment Market Revenue (billion), by Application 2025 & 2033
- Figure 48: Asia Pacific Cryogenic Equipment Market Volume (K Unit), by Application 2025 & 2033
- Figure 49: Asia Pacific Cryogenic Equipment Market Revenue Share (%), by Application 2025 & 2033
- Figure 50: Asia Pacific Cryogenic Equipment Market Volume Share (%), by Application 2025 & 2033
- Figure 51: Asia Pacific Cryogenic Equipment Market Revenue (billion), by Gas Used 2025 & 2033
- Figure 52: Asia Pacific Cryogenic Equipment Market Volume (K Unit), by Gas Used 2025 & 2033
- Figure 53: Asia Pacific Cryogenic Equipment Market Revenue Share (%), by Gas Used 2025 & 2033
- Figure 54: Asia Pacific Cryogenic Equipment Market Volume Share (%), by Gas Used 2025 & 2033
- Figure 55: Asia Pacific Cryogenic Equipment Market Revenue (billion), by End-user Industry 2025 & 2033
- Figure 56: Asia Pacific Cryogenic Equipment Market Volume (K Unit), by End-user Industry 2025 & 2033
- Figure 57: Asia Pacific Cryogenic Equipment Market Revenue Share (%), by End-user Industry 2025 & 2033
- Figure 58: Asia Pacific Cryogenic Equipment Market Volume Share (%), by End-user Industry 2025 & 2033
- Figure 59: Asia Pacific Cryogenic Equipment Market Revenue (billion), by Country 2025 & 2033
- Figure 60: Asia Pacific Cryogenic Equipment Market Volume (K Unit), by Country 2025 & 2033
- Figure 61: Asia Pacific Cryogenic Equipment Market Revenue Share (%), by Country 2025 & 2033
- Figure 62: Asia Pacific Cryogenic Equipment Market Volume Share (%), by Country 2025 & 2033
- Figure 63: South America Cryogenic Equipment Market Revenue (billion), by Equipment 2025 & 2033
- Figure 64: South America Cryogenic Equipment Market Volume (K Unit), by Equipment 2025 & 2033
- Figure 65: South America Cryogenic Equipment Market Revenue Share (%), by Equipment 2025 & 2033
- Figure 66: South America Cryogenic Equipment Market Volume Share (%), by Equipment 2025 & 2033
- Figure 67: South America Cryogenic Equipment Market Revenue (billion), by Application 2025 & 2033
- Figure 68: South America Cryogenic Equipment Market Volume (K Unit), by Application 2025 & 2033
- Figure 69: South America Cryogenic Equipment Market Revenue Share (%), by Application 2025 & 2033
- Figure 70: South America Cryogenic Equipment Market Volume Share (%), by Application 2025 & 2033
- Figure 71: South America Cryogenic Equipment Market Revenue (billion), by Gas Used 2025 & 2033
- Figure 72: South America Cryogenic Equipment Market Volume (K Unit), by Gas Used 2025 & 2033
- Figure 73: South America Cryogenic Equipment Market Revenue Share (%), by Gas Used 2025 & 2033
- Figure 74: South America Cryogenic Equipment Market Volume Share (%), by Gas Used 2025 & 2033
- Figure 75: South America Cryogenic Equipment Market Revenue (billion), by End-user Industry 2025 & 2033
- Figure 76: South America Cryogenic Equipment Market Volume (K Unit), by End-user Industry 2025 & 2033
- Figure 77: South America Cryogenic Equipment Market Revenue Share (%), by End-user Industry 2025 & 2033
- Figure 78: South America Cryogenic Equipment Market Volume Share (%), by End-user Industry 2025 & 2033
- Figure 79: South America Cryogenic Equipment Market Revenue (billion), by Country 2025 & 2033
- Figure 80: South America Cryogenic Equipment Market Volume (K Unit), by Country 2025 & 2033
- Figure 81: South America Cryogenic Equipment Market Revenue Share (%), by Country 2025 & 2033
- Figure 82: South America Cryogenic Equipment Market Volume Share (%), by Country 2025 & 2033
- Figure 83: Middle East and Africa Cryogenic Equipment Market Revenue (billion), by Equipment 2025 & 2033
- Figure 84: Middle East and Africa Cryogenic Equipment Market Volume (K Unit), by Equipment 2025 & 2033
- Figure 85: Middle East and Africa Cryogenic Equipment Market Revenue Share (%), by Equipment 2025 & 2033
- Figure 86: Middle East and Africa Cryogenic Equipment Market Volume Share (%), by Equipment 2025 & 2033
- Figure 87: Middle East and Africa Cryogenic Equipment Market Revenue (billion), by Application 2025 & 2033
- Figure 88: Middle East and Africa Cryogenic Equipment Market Volume (K Unit), by Application 2025 & 2033
- Figure 89: Middle East and Africa Cryogenic Equipment Market Revenue Share (%), by Application 2025 & 2033
- Figure 90: Middle East and Africa Cryogenic Equipment Market Volume Share (%), by Application 2025 & 2033
- Figure 91: Middle East and Africa Cryogenic Equipment Market Revenue (billion), by Gas Used 2025 & 2033
- Figure 92: Middle East and Africa Cryogenic Equipment Market Volume (K Unit), by Gas Used 2025 & 2033
- Figure 93: Middle East and Africa Cryogenic Equipment Market Revenue Share (%), by Gas Used 2025 & 2033
- Figure 94: Middle East and Africa Cryogenic Equipment Market Volume Share (%), by Gas Used 2025 & 2033
- Figure 95: Middle East and Africa Cryogenic Equipment Market Revenue (billion), by End-user Industry 2025 & 2033
- Figure 96: Middle East and Africa Cryogenic Equipment Market Volume (K Unit), by End-user Industry 2025 & 2033
- Figure 97: Middle East and Africa Cryogenic Equipment Market Revenue Share (%), by End-user Industry 2025 & 2033
- Figure 98: Middle East and Africa Cryogenic Equipment Market Volume Share (%), by End-user Industry 2025 & 2033
- Figure 99: Middle East and Africa Cryogenic Equipment Market Revenue (billion), by Country 2025 & 2033
- Figure 100: Middle East and Africa Cryogenic Equipment Market Volume (K Unit), by Country 2025 & 2033
- Figure 101: Middle East and Africa Cryogenic Equipment Market Revenue Share (%), by Country 2025 & 2033
- Figure 102: Middle East and Africa Cryogenic Equipment Market Volume Share (%), by Country 2025 & 2033
List of Tables
- Table 1: Global Cryogenic Equipment Market Revenue billion Forecast, by Equipment 2020 & 2033
- Table 2: Global Cryogenic Equipment Market Volume K Unit Forecast, by Equipment 2020 & 2033
- Table 3: Global Cryogenic Equipment Market Revenue billion Forecast, by Application 2020 & 2033
- Table 4: Global Cryogenic Equipment Market Volume K Unit Forecast, by Application 2020 & 2033
- Table 5: Global Cryogenic Equipment Market Revenue billion Forecast, by Gas Used 2020 & 2033
- Table 6: Global Cryogenic Equipment Market Volume K Unit Forecast, by Gas Used 2020 & 2033
- Table 7: Global Cryogenic Equipment Market Revenue billion Forecast, by End-user Industry 2020 & 2033
- Table 8: Global Cryogenic Equipment Market Volume K Unit Forecast, by End-user Industry 2020 & 2033
- Table 9: Global Cryogenic Equipment Market Revenue billion Forecast, by Region 2020 & 2033
- Table 10: Global Cryogenic Equipment Market Volume K Unit Forecast, by Region 2020 & 2033
- Table 11: Global Cryogenic Equipment Market Revenue billion Forecast, by Equipment 2020 & 2033
- Table 12: Global Cryogenic Equipment Market Volume K Unit Forecast, by Equipment 2020 & 2033
- Table 13: Global Cryogenic Equipment Market Revenue billion Forecast, by Application 2020 & 2033
- Table 14: Global Cryogenic Equipment Market Volume K Unit Forecast, by Application 2020 & 2033
- Table 15: Global Cryogenic Equipment Market Revenue billion Forecast, by Gas Used 2020 & 2033
- Table 16: Global Cryogenic Equipment Market Volume K Unit Forecast, by Gas Used 2020 & 2033
- Table 17: Global Cryogenic Equipment Market Revenue billion Forecast, by End-user Industry 2020 & 2033
- Table 18: Global Cryogenic Equipment Market Volume K Unit Forecast, by End-user Industry 2020 & 2033
- Table 19: Global Cryogenic Equipment Market Revenue billion Forecast, by Country 2020 & 2033
- Table 20: Global Cryogenic Equipment Market Volume K Unit Forecast, by Country 2020 & 2033
- Table 21: Global Cryogenic Equipment Market Revenue billion Forecast, by Equipment 2020 & 2033
- Table 22: Global Cryogenic Equipment Market Volume K Unit Forecast, by Equipment 2020 & 2033
- Table 23: Global Cryogenic Equipment Market Revenue billion Forecast, by Application 2020 & 2033
- Table 24: Global Cryogenic Equipment Market Volume K Unit Forecast, by Application 2020 & 2033
- Table 25: Global Cryogenic Equipment Market Revenue billion Forecast, by Gas Used 2020 & 2033
- Table 26: Global Cryogenic Equipment Market Volume K Unit Forecast, by Gas Used 2020 & 2033
- Table 27: Global Cryogenic Equipment Market Revenue billion Forecast, by End-user Industry 2020 & 2033
- Table 28: Global Cryogenic Equipment Market Volume K Unit Forecast, by End-user Industry 2020 & 2033
- Table 29: Global Cryogenic Equipment Market Revenue billion Forecast, by Country 2020 & 2033
- Table 30: Global Cryogenic Equipment Market Volume K Unit Forecast, by Country 2020 & 2033
- Table 31: Global Cryogenic Equipment Market Revenue billion Forecast, by Equipment 2020 & 2033
- Table 32: Global Cryogenic Equipment Market Volume K Unit Forecast, by Equipment 2020 & 2033
- Table 33: Global Cryogenic Equipment Market Revenue billion Forecast, by Application 2020 & 2033
- Table 34: Global Cryogenic Equipment Market Volume K Unit Forecast, by Application 2020 & 2033
- Table 35: Global Cryogenic Equipment Market Revenue billion Forecast, by Gas Used 2020 & 2033
- Table 36: Global Cryogenic Equipment Market Volume K Unit Forecast, by Gas Used 2020 & 2033
- Table 37: Global Cryogenic Equipment Market Revenue billion Forecast, by End-user Industry 2020 & 2033
- Table 38: Global Cryogenic Equipment Market Volume K Unit Forecast, by End-user Industry 2020 & 2033
- Table 39: Global Cryogenic Equipment Market Revenue billion Forecast, by Country 2020 & 2033
- Table 40: Global Cryogenic Equipment Market Volume K Unit Forecast, by Country 2020 & 2033
- Table 41: Global Cryogenic Equipment Market Revenue billion Forecast, by Equipment 2020 & 2033
- Table 42: Global Cryogenic Equipment Market Volume K Unit Forecast, by Equipment 2020 & 2033
- Table 43: Global Cryogenic Equipment Market Revenue billion Forecast, by Application 2020 & 2033
- Table 44: Global Cryogenic Equipment Market Volume K Unit Forecast, by Application 2020 & 2033
- Table 45: Global Cryogenic Equipment Market Revenue billion Forecast, by Gas Used 2020 & 2033
- Table 46: Global Cryogenic Equipment Market Volume K Unit Forecast, by Gas Used 2020 & 2033
- Table 47: Global Cryogenic Equipment Market Revenue billion Forecast, by End-user Industry 2020 & 2033
- Table 48: Global Cryogenic Equipment Market Volume K Unit Forecast, by End-user Industry 2020 & 2033
- Table 49: Global Cryogenic Equipment Market Revenue billion Forecast, by Country 2020 & 2033
- Table 50: Global Cryogenic Equipment Market Volume K Unit Forecast, by Country 2020 & 2033
- Table 51: Global Cryogenic Equipment Market Revenue billion Forecast, by Equipment 2020 & 2033
- Table 52: Global Cryogenic Equipment Market Volume K Unit Forecast, by Equipment 2020 & 2033
- Table 53: Global Cryogenic Equipment Market Revenue billion Forecast, by Application 2020 & 2033
- Table 54: Global Cryogenic Equipment Market Volume K Unit Forecast, by Application 2020 & 2033
- Table 55: Global Cryogenic Equipment Market Revenue billion Forecast, by Gas Used 2020 & 2033
- Table 56: Global Cryogenic Equipment Market Volume K Unit Forecast, by Gas Used 2020 & 2033
- Table 57: Global Cryogenic Equipment Market Revenue billion Forecast, by End-user Industry 2020 & 2033
- Table 58: Global Cryogenic Equipment Market Volume K Unit Forecast, by End-user Industry 2020 & 2033
- Table 59: Global Cryogenic Equipment Market Revenue billion Forecast, by Country 2020 & 2033
- Table 60: Global Cryogenic Equipment Market Volume K Unit Forecast, by Country 2020 & 2033
Frequently Asked Questions
1. What is the projected Compound Annual Growth Rate (CAGR) of the Cryogenic Equipment Market?
The projected CAGR is approximately 6.8%.
2. Which companies are prominent players in the Cryogenic Equipment Market?
Key companies in the market include Linde PLC, Honeywell International Inc, Flowserve Corp, Cryofab Inc, HEROSE GmbH, Emerson Electric Co, Chart Industries Inc, McDermott International Inc, Sumitomo Heavy Industries Ltd, Beijing Tianhai Industry Co Ltd.
3. What are the main segments of the Cryogenic Equipment Market?
The market segments include Equipment, Application, Gas Used, End-user Industry.
4. Can you provide details about the market size?
The market size is estimated to be USD 26.6 billion as of 2022.
5. What are some drivers contributing to market growth?
4.; Increasing Demand for Liquefied Natural Gas (LNG).
6. What are the notable trends driving market growth?
Tanks Segment Expected to Experience Significant Market Growth.
7. Are there any restraints impacting market growth?
4.; High Operational and Maintenance Costs.
8. Can you provide examples of recent developments in the market?
In January 2022, Saulsbury was awarded the EPC contract for the design and installation of two cryogenic processing facilities in the Midland Basin. The facilities, designed with a base-rated capacity of 200 million standard cubic feet per day (MMSCFD) each, mark Saulsbury's 61st and 62nd cryogenic processing facility projects since 2006, representing nearly 11 billion cubic feet per day (BCFD) of processing capacity, and its 23rd and 24th cryogenic processing facility in the West Texas region.
9. What pricing options are available for accessing the report?
Pricing options include single-user, multi-user, and enterprise licenses priced at USD 4750, USD 5250, and USD 8750 respectively.
10. Is the market size provided in terms of value or volume?
The market size is provided in terms of value, measured in billion and volume, measured in K Unit.
11. Are there any specific market keywords associated with the report?
Yes, the market keyword associated with the report is "Cryogenic Equipment Market," which aids in identifying and referencing the specific market segment covered.
12. How do I determine which pricing option suits my needs best?
The pricing options vary based on user requirements and access needs. Individual users may opt for single-user licenses, while businesses requiring broader access may choose multi-user or enterprise licenses for cost-effective access to the report.
13. Are there any additional resources or data provided in the Cryogenic Equipment Market report?
While the report offers comprehensive insights, it's advisable to review the specific contents or supplementary materials provided to ascertain if additional resources or data are available.
14. How can I stay updated on further developments or reports in the Cryogenic Equipment Market?
To stay informed about further developments, trends, and reports in the Cryogenic Equipment Market, consider subscribing to industry newsletters, following relevant companies and organizations, or regularly checking reputable industry news sources and publications.
Methodology
Step 1 - Identification of Relevant Samples Size from Population Database


Step 2 - Approaches for Defining Global Market Size (Value, Volume* & Price*)

Note*: In applicable scenarios
Step 3 - Data Sources
Primary Research
- Web Analytics
- Survey Reports
- Research Institute
- Latest Research Reports
- Opinion Leaders
Secondary Research
- Annual Reports
- White Paper
- Latest Press Release
- Industry Association
- Paid Database
- Investor Presentations

Step 4 - Data Triangulation
Involves using different sources of information in order to increase the validity of a study
These sources are likely to be stakeholders in a program - participants, other researchers, program staff, other community members, and so on.
Then we put all data in single framework & apply various statistical tools to find out the dynamic on the market.
During the analysis stage, feedback from the stakeholder groups would be compared to determine areas of agreement as well as areas of divergence