

Key Insights
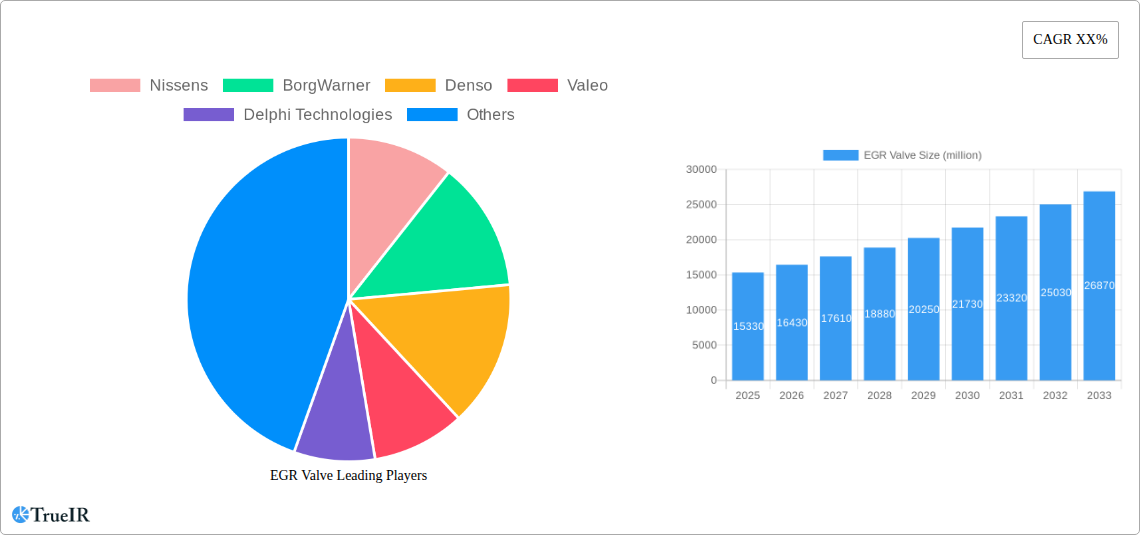
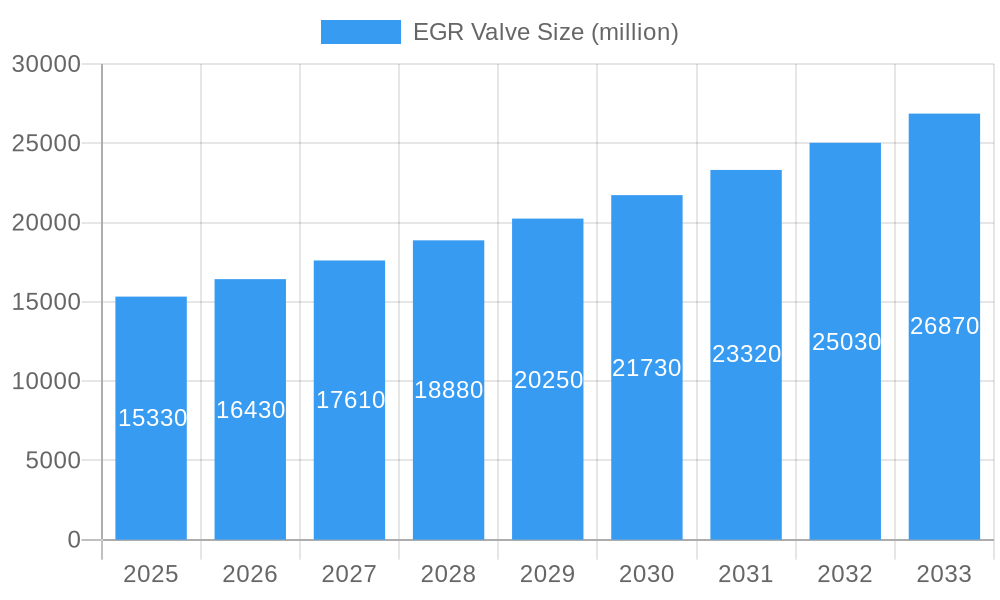
The global EGR (Exhaust Gas Recirculation) valve market is poised for significant expansion, projected to reach an estimated $15.33 billion by 2025. This growth is underpinned by a robust compound annual growth rate (CAGR) of 7.28%, indicating a sustained upward trajectory for the forecast period of 2025-2033. The primary drivers fueling this market surge are increasingly stringent emission regulations worldwide, compelling automotive manufacturers to adopt advanced emission control technologies like EGR systems to reduce nitrogen oxide (NOx) emissions. Furthermore, the growing global vehicle parc, encompassing both passenger cars and commercial vehicles, directly translates into a higher demand for EGR valves. The increasing emphasis on fuel efficiency, where EGR systems play a crucial role in optimizing combustion, also contributes to this market dynamism.
EGR Valve Market Size (In Billion)
The EGR valve market is segmented by type into Mechanical EGR Valves and Electric EGR Valves, with Electric EGR Valves gaining prominence due to their superior precision, responsiveness, and integration capabilities with modern vehicle electronics. Applications are primarily dominated by Passenger Cars and Commercial Vehicles, reflecting the sheer volume of these segments. However, a notable trend is the increasing application in non-road usage, such as agricultural and construction machinery, where emission standards are also becoming more rigorous. Geographically, Asia Pacific, driven by the burgeoning automotive industries in China and India, is expected to be a key growth region. North America and Europe, with their established automotive sectors and proactive environmental policies, will continue to be significant markets, while emerging economies in South America and the Middle East & Africa present substantial future potential. Leading companies such as BorgWarner, Denso, and Valeo are actively innovating, focusing on enhanced performance, durability, and cost-effectiveness to capture market share in this evolving landscape.
EGR Valve Company Market Share
EGR Valve Market Insights: Global Forecast 2033
This comprehensive report offers an in-depth analysis of the global EGR (Exhaust Gas Recirculation) valve market, providing critical insights for industry stakeholders. The study encompasses a detailed examination of market structure, competitive dynamics, emerging trends, dominant segments, and future outlook, spanning the historical period from 2019 to 2024 and forecasting growth through 2033. With a base year of 2025, this report leverages high-volume keywords and industry-specific terminology to deliver actionable intelligence.
EGR Valve Market Structure & Competitive Landscape
The global EGR valve market, valued at approximately 15 billion in 2025, exhibits a moderately concentrated structure. Key innovation drivers include increasingly stringent emission regulations worldwide and the automotive industry's persistent push for improved fuel efficiency. Regulatory impacts, particularly Euro 7 standards and their global equivalents, are compelling manufacturers to adopt advanced EGR valve technologies. Product substitutes, while limited in the immediate term, could emerge from novel combustion technologies or alternative emission control systems. End-user segmentation reveals a dominant share for Passenger Cars, followed by Commercial Vehicles, with Non-road Usage representing a smaller but growing segment. Mergers and acquisitions (M&A) trends are actively reshaping the landscape, with an estimated 200 billion in M&A activities projected between 2024 and 2028, driven by the pursuit of technological synergies and market expansion. Concentration ratios for the top 5 players are estimated to be around 60%, indicating significant influence by established entities.
EGR Valve Market Trends & Opportunities
The EGR valve market is poised for robust growth, projected to reach 35 billion by 2033, with a Compound Annual Growth Rate (CAGR) of approximately 8.5% from 2025 to 2033. This expansion is fueled by a confluence of factors, including the ongoing global demand for cleaner internal combustion engines as a transitional technology and the imperative to meet evolving emissions standards across diverse automotive sectors. Technological shifts are a primary trend, with a discernible move from Mechanical EGR Valves towards Electric EGR Valves. This transition is driven by the superior control, diagnostic capabilities, and integration potential of electric variants, which are crucial for sophisticated engine management systems. Consumer preferences are indirectly influencing the market through their demand for fuel-efficient and environmentally conscious vehicles, pushing OEMs to prioritize emission control components that enhance both aspects.
Competitive dynamics are intensifying, with established players continually investing in research and development to enhance EGR valve performance, durability, and cost-effectiveness. The market penetration rate for Electric EGR Valves is expected to climb from approximately 40% in 2025 to over 70% by 2033. Emerging markets, particularly in Asia Pacific, are showing significant growth potential due to rapid automotive production and the implementation of stricter environmental mandates. Opportunities abound for manufacturers that can offer advanced, integrated EGR solutions that contribute to reduced NOx emissions and improved fuel economy. Furthermore, the increasing complexity of engine designs and the growing adoption of hybrid powertrains present opportunities for specialized EGR valve solutions tailored to these unique applications. The continuous evolution of engine control units (ECUs) necessitates EGR valves that can seamlessly integrate and respond in real-time, creating a sustained demand for technological innovation.
Dominant Markets & Segments in EGR Valve
The dominant region in the EGR valve market is Asia Pacific, expected to account for over 40% of the global market share by 2033. Within this region, China stands out as the leading country, driven by its massive automotive production, significant government initiatives to curb air pollution, and the rapid adoption of advanced emission control technologies.
- Type Segmentation Dominance: Electric EGR Valves are projected to be the dominant type, projected to capture over 60% of the market by 2033. Key growth drivers for electric variants include:
- Superior Control and Precision: Electric EGR valves offer precise control over exhaust gas flow, enabling optimal combustion and reduced NOx emissions under various operating conditions.
- Enhanced Diagnostic Capabilities: Integration with vehicle diagnostics systems allows for early detection of faults and improved maintenance, a crucial factor for modern vehicles.
- Compatibility with Advanced Powertrains: Electric EGR valves are essential for meeting the complex emission control requirements of modern gasoline and diesel engines, including those in hybrid vehicles.
- Application Segmentation Dominance: Passenger Cars are the largest application segment, expected to constitute more than 75% of the market by 2033. Growth in this segment is propelled by:
- Stringent Emission Standards: Global emission regulations, such as Euro 7 and its equivalents, mandate significant reductions in NOx emissions, driving the demand for effective EGR systems in passenger vehicles.
- Increasing Vehicle Production: The sheer volume of passenger car production worldwide ensures a consistent and substantial demand for EGR valves.
- Consumer Demand for Fuel Efficiency: EGR valves contribute to improved fuel economy, aligning with consumer preferences for cost-effective and environmentally friendly vehicles.
Commercial Vehicles represent the second-largest application segment, with steady growth driven by the increasing adoption of diesel engines in heavy-duty applications and the need to comply with stricter emissions norms for trucks and buses. Non-road usage, including agricultural machinery and construction equipment, presents a burgeoning opportunity, albeit with a smaller market share, as these sectors also face growing environmental scrutiny and regulatory pressures.
EGR Valve Product Analysis
Product innovation in the EGR valve market centers on enhanced precision, durability, and integration. Electric EGR valves, with their advanced solenoid or stepper motor technology, offer superior control over exhaust gas recirculation, leading to significant reductions in NOx emissions and improved fuel efficiency. Competitive advantages lie in their ability to provide real-time feedback to the Engine Control Unit (ECU), optimize combustion processes under varying loads, and integrate seamlessly with advanced vehicle diagnostic systems. Manufacturers are focusing on developing more compact, lightweight, and cost-effective designs without compromising performance.
Key Drivers, Barriers & Challenges in EGR Valve
Key Drivers: The EGR valve market is propelled by several key drivers. Foremost among these are increasingly stringent global emission regulations, such as Euro 7 and its international counterparts, which mandate substantial reductions in harmful pollutants like NOx. The automotive industry's sustained commitment to improving fuel efficiency also plays a crucial role, as EGR systems contribute to better combustion and reduced fuel consumption. Furthermore, the ongoing technological advancements in engine management systems and the growing complexity of modern internal combustion engines necessitate sophisticated EGR valve solutions. The increasing global demand for automobiles, particularly in emerging economies, also serves as a significant growth catalyst.
Key Barriers & Challenges: Despite the positive growth trajectory, the EGR valve market faces several barriers and challenges. Supply chain disruptions, particularly in the sourcing of specialized electronic components, can impact production volumes and lead times. Regulatory complexities and the evolving nature of emission standards can create uncertainty for manufacturers, requiring continuous adaptation and investment. Intense competitive pressures among established players and emerging manufacturers contribute to price sensitivity and necessitate constant innovation to maintain market share. The rising cost of raw materials and manufacturing processes can also pose a challenge, impacting profitability. Moreover, the long-term transition towards electric vehicles (EVs) in some regions might eventually lead to a decline in demand for internal combustion engine components, including EGR valves, although this is a longer-term consideration.
Growth Drivers in the EGR Valve Market
The EGR valve market is propelled by a dynamic interplay of technological, economic, and regulatory factors. Stricter emission standards, exemplified by evolving Euro and EPA regulations, are paramount, compelling automotive manufacturers to implement effective NOx reduction strategies. Economic growth in developing nations fuels increased vehicle production, thereby expanding the addressable market for EGR valves. Technological advancements, particularly the shift towards Electric EGR Valves, offer superior control and integration capabilities, aligning with the trend of sophisticated engine management systems. Government incentives promoting cleaner transportation and the continuous pursuit of improved fuel economy by consumers also contribute significantly to market expansion.
Challenges Impacting EGR Valve Growth
The growth of the EGR valve market is not without its impediments. Regulatory complexities and the potential for frequent updates to emission standards can create uncertainty and necessitate costly R&D investments for compliance. Supply chain volatility, particularly for critical electronic components, poses a risk to production continuity and cost management. Intense competition within the market leads to price pressures and demands continuous innovation to maintain profitability. The long-term outlook for internal combustion engines, influenced by the accelerating adoption of electric vehicles in various regions, presents a structural challenge to the sustained growth of the EGR valve market in the distant future.
Key Players Shaping the EGR Valve Market
- Nissens
- BorgWarner
- Denso
- Valeo
- Delphi Technologies
- Rheinmetall Automotive
- Continental
- Mahle
- Korens
- Keihin
- Longsheng Technology
- Eberspacher
- Faurecia
- Yibin Tianruida
- MEET Automotive
- Klubert + Schmidt
- Zhejiang Jiulong
- Gits Manufacturing
- Yinlun Machinery
Significant EGR Valve Industry Milestones
- 2019: Introduction of enhanced diagnostic features in Electric EGR valves by major OEMs, improving vehicle fault detection and maintenance.
- 2020: Increased investment in R&D for miniaturized and more efficient EGR valve designs to accommodate increasingly compact engine compartments.
- 2021: Growing adoption of advanced material science for EGR valve components to improve durability and resistance to high temperatures and corrosive exhaust gases.
- 2022: Significant push by Tier 1 suppliers to develop integrated EGR modules, combining the valve with coolers and sensors for seamless ECU integration.
- 2023: Focus on smart EGR systems capable of real-time adaptive control based on diverse driving conditions and environmental factors.
- 2024: Anticipated increase in strategic partnerships and collaborations between EGR valve manufacturers and automotive software providers to enhance control algorithms.
Future Outlook for EGR Valve Market
The future outlook for the EGR valve market remains positive, driven by the continued relevance of internal combustion engines in the automotive landscape, albeit with a gradual transition towards electrification. Growth catalysts include the persistent global demand for cleaner transportation, the ongoing tightening of emission regulations across major automotive markets, and the inherent advantages of Electric EGR Valves in meeting these stringent requirements. Opportunities lie in developing solutions for hybrid powertrains, optimizing EGR performance in downsized engines, and innovating for cost-effectiveness in emerging economies. The market will likely see further consolidation and a strong emphasis on technological advancement to ensure compliance and enhance overall vehicle efficiency.
EGR Valve Segmentation
-
1. Type
- 1.1. Mechanical EGR Valve
- 1.2. Electric EGR Valve
-
2. Application
- 2.1. Passenger Cars
- 2.2. Commercial Vehicles
- 2.3. Non-road Usage
EGR Valve Segmentation By Geography
-
1. North America
- 1.1. United States
- 1.2. Canada
- 1.3. Mexico
-
2. South America
- 2.1. Brazil
- 2.2. Argentina
- 2.3. Rest of South America
-
3. Europe
- 3.1. United Kingdom
- 3.2. Germany
- 3.3. France
- 3.4. Italy
- 3.5. Spain
- 3.6. Russia
- 3.7. Benelux
- 3.8. Nordics
- 3.9. Rest of Europe
-
4. Middle East & Africa
- 4.1. Turkey
- 4.2. Israel
- 4.3. GCC
- 4.4. North Africa
- 4.5. South Africa
- 4.6. Rest of Middle East & Africa
-
5. Asia Pacific
- 5.1. China
- 5.2. India
- 5.3. Japan
- 5.4. South Korea
- 5.5. ASEAN
- 5.6. Oceania
- 5.7. Rest of Asia Pacific
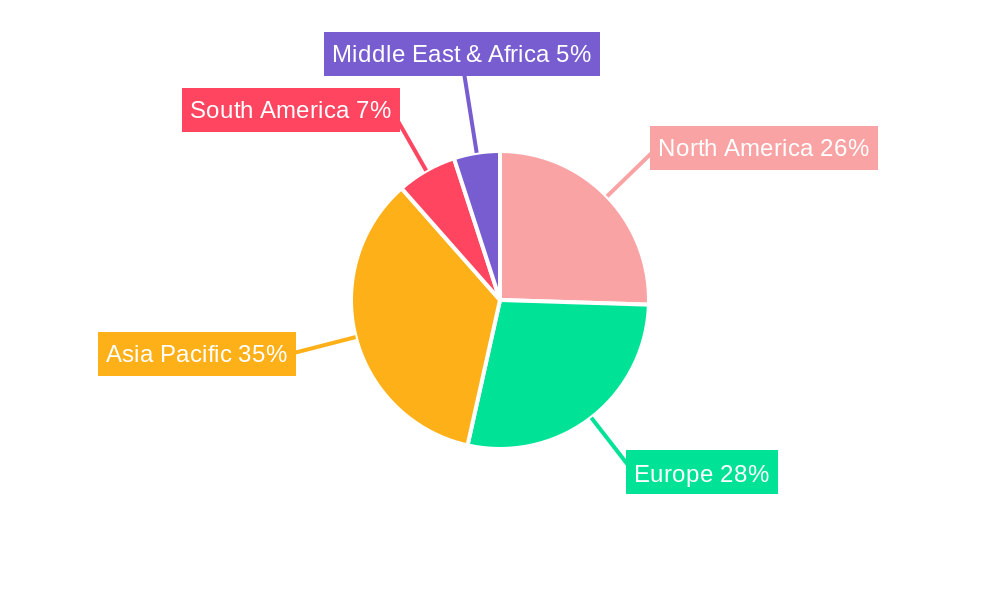
EGR Valve Regional Market Share
Geographic Coverage of EGR Valve
EGR Valve REPORT HIGHLIGHTS
| Aspects | Details |
|---|---|
| Study Period | 2020-2034 |
| Base Year | 2025 |
| Estimated Year | 2026 |
| Forecast Period | 2026-2034 |
| Historical Period | 2020-2025 |
| Growth Rate | CAGR of 7.28% from 2020-2034 |
| Segmentation |
|
Table of Contents
- 1. Introduction
- 1.1. Research Scope
- 1.2. Market Segmentation
- 1.3. Research Methodology
- 1.4. Definitions and Assumptions
- 2. Executive Summary
- 2.1. Introduction
- 3. Market Dynamics
- 3.1. Introduction
- 3.2. Market Drivers
- 3.3. Market Restrains
- 3.4. Market Trends
- 4. Market Factor Analysis
- 4.1. Porters Five Forces
- 4.2. Supply/Value Chain
- 4.3. PESTEL analysis
- 4.4. Market Entropy
- 4.5. Patent/Trademark Analysis
- 5. Global EGR Valve Analysis, Insights and Forecast, 2020-2032
- 5.1. Market Analysis, Insights and Forecast - by Type
- 5.1.1. Mechanical EGR Valve
- 5.1.2. Electric EGR Valve
- 5.2. Market Analysis, Insights and Forecast - by Application
- 5.2.1. Passenger Cars
- 5.2.2. Commercial Vehicles
- 5.2.3. Non-road Usage
- 5.3. Market Analysis, Insights and Forecast - by Region
- 5.3.1. North America
- 5.3.2. South America
- 5.3.3. Europe
- 5.3.4. Middle East & Africa
- 5.3.5. Asia Pacific
- 5.1. Market Analysis, Insights and Forecast - by Type
- 6. North America EGR Valve Analysis, Insights and Forecast, 2020-2032
- 6.1. Market Analysis, Insights and Forecast - by Type
- 6.1.1. Mechanical EGR Valve
- 6.1.2. Electric EGR Valve
- 6.2. Market Analysis, Insights and Forecast - by Application
- 6.2.1. Passenger Cars
- 6.2.2. Commercial Vehicles
- 6.2.3. Non-road Usage
- 6.1. Market Analysis, Insights and Forecast - by Type
- 7. South America EGR Valve Analysis, Insights and Forecast, 2020-2032
- 7.1. Market Analysis, Insights and Forecast - by Type
- 7.1.1. Mechanical EGR Valve
- 7.1.2. Electric EGR Valve
- 7.2. Market Analysis, Insights and Forecast - by Application
- 7.2.1. Passenger Cars
- 7.2.2. Commercial Vehicles
- 7.2.3. Non-road Usage
- 7.1. Market Analysis, Insights and Forecast - by Type
- 8. Europe EGR Valve Analysis, Insights and Forecast, 2020-2032
- 8.1. Market Analysis, Insights and Forecast - by Type
- 8.1.1. Mechanical EGR Valve
- 8.1.2. Electric EGR Valve
- 8.2. Market Analysis, Insights and Forecast - by Application
- 8.2.1. Passenger Cars
- 8.2.2. Commercial Vehicles
- 8.2.3. Non-road Usage
- 8.1. Market Analysis, Insights and Forecast - by Type
- 9. Middle East & Africa EGR Valve Analysis, Insights and Forecast, 2020-2032
- 9.1. Market Analysis, Insights and Forecast - by Type
- 9.1.1. Mechanical EGR Valve
- 9.1.2. Electric EGR Valve
- 9.2. Market Analysis, Insights and Forecast - by Application
- 9.2.1. Passenger Cars
- 9.2.2. Commercial Vehicles
- 9.2.3. Non-road Usage
- 9.1. Market Analysis, Insights and Forecast - by Type
- 10. Asia Pacific EGR Valve Analysis, Insights and Forecast, 2020-2032
- 10.1. Market Analysis, Insights and Forecast - by Type
- 10.1.1. Mechanical EGR Valve
- 10.1.2. Electric EGR Valve
- 10.2. Market Analysis, Insights and Forecast - by Application
- 10.2.1. Passenger Cars
- 10.2.2. Commercial Vehicles
- 10.2.3. Non-road Usage
- 10.1. Market Analysis, Insights and Forecast - by Type
- 11. Competitive Analysis
- 11.1. Global Market Share Analysis 2025
- 11.2. Company Profiles
- 11.2.1 Nissens
- 11.2.1.1. Overview
- 11.2.1.2. Products
- 11.2.1.3. SWOT Analysis
- 11.2.1.4. Recent Developments
- 11.2.1.5. Financials (Based on Availability)
- 11.2.2 BorgWarner
- 11.2.2.1. Overview
- 11.2.2.2. Products
- 11.2.2.3. SWOT Analysis
- 11.2.2.4. Recent Developments
- 11.2.2.5. Financials (Based on Availability)
- 11.2.3 Denso
- 11.2.3.1. Overview
- 11.2.3.2. Products
- 11.2.3.3. SWOT Analysis
- 11.2.3.4. Recent Developments
- 11.2.3.5. Financials (Based on Availability)
- 11.2.4 Valeo
- 11.2.4.1. Overview
- 11.2.4.2. Products
- 11.2.4.3. SWOT Analysis
- 11.2.4.4. Recent Developments
- 11.2.4.5. Financials (Based on Availability)
- 11.2.5 Delphi Technologies
- 11.2.5.1. Overview
- 11.2.5.2. Products
- 11.2.5.3. SWOT Analysis
- 11.2.5.4. Recent Developments
- 11.2.5.5. Financials (Based on Availability)
- 11.2.6 Rheinmetall Automotive
- 11.2.6.1. Overview
- 11.2.6.2. Products
- 11.2.6.3. SWOT Analysis
- 11.2.6.4. Recent Developments
- 11.2.6.5. Financials (Based on Availability)
- 11.2.7 Continental
- 11.2.7.1. Overview
- 11.2.7.2. Products
- 11.2.7.3. SWOT Analysis
- 11.2.7.4. Recent Developments
- 11.2.7.5. Financials (Based on Availability)
- 11.2.8 Mahle
- 11.2.8.1. Overview
- 11.2.8.2. Products
- 11.2.8.3. SWOT Analysis
- 11.2.8.4. Recent Developments
- 11.2.8.5. Financials (Based on Availability)
- 11.2.9 Korens
- 11.2.9.1. Overview
- 11.2.9.2. Products
- 11.2.9.3. SWOT Analysis
- 11.2.9.4. Recent Developments
- 11.2.9.5. Financials (Based on Availability)
- 11.2.10 Keihin
- 11.2.10.1. Overview
- 11.2.10.2. Products
- 11.2.10.3. SWOT Analysis
- 11.2.10.4. Recent Developments
- 11.2.10.5. Financials (Based on Availability)
- 11.2.11 Longsheng Technology
- 11.2.11.1. Overview
- 11.2.11.2. Products
- 11.2.11.3. SWOT Analysis
- 11.2.11.4. Recent Developments
- 11.2.11.5. Financials (Based on Availability)
- 11.2.12 Eberspacher
- 11.2.12.1. Overview
- 11.2.12.2. Products
- 11.2.12.3. SWOT Analysis
- 11.2.12.4. Recent Developments
- 11.2.12.5. Financials (Based on Availability)
- 11.2.13 Faurecia
- 11.2.13.1. Overview
- 11.2.13.2. Products
- 11.2.13.3. SWOT Analysis
- 11.2.13.4. Recent Developments
- 11.2.13.5. Financials (Based on Availability)
- 11.2.14 Yibin Tianruida
- 11.2.14.1. Overview
- 11.2.14.2. Products
- 11.2.14.3. SWOT Analysis
- 11.2.14.4. Recent Developments
- 11.2.14.5. Financials (Based on Availability)
- 11.2.15 MEET Automotive
- 11.2.15.1. Overview
- 11.2.15.2. Products
- 11.2.15.3. SWOT Analysis
- 11.2.15.4. Recent Developments
- 11.2.15.5. Financials (Based on Availability)
- 11.2.16 Klubert + Schmidt
- 11.2.16.1. Overview
- 11.2.16.2. Products
- 11.2.16.3. SWOT Analysis
- 11.2.16.4. Recent Developments
- 11.2.16.5. Financials (Based on Availability)
- 11.2.17 Zhejiang Jiulong
- 11.2.17.1. Overview
- 11.2.17.2. Products
- 11.2.17.3. SWOT Analysis
- 11.2.17.4. Recent Developments
- 11.2.17.5. Financials (Based on Availability)
- 11.2.18 Gits Manufacturing
- 11.2.18.1. Overview
- 11.2.18.2. Products
- 11.2.18.3. SWOT Analysis
- 11.2.18.4. Recent Developments
- 11.2.18.5. Financials (Based on Availability)
- 11.2.19 Yinlun Machinery
- 11.2.19.1. Overview
- 11.2.19.2. Products
- 11.2.19.3. SWOT Analysis
- 11.2.19.4. Recent Developments
- 11.2.19.5. Financials (Based on Availability)
- 11.2.1 Nissens
List of Figures
- Figure 1: Global EGR Valve Revenue Breakdown (undefined, %) by Region 2025 & 2033
- Figure 2: North America EGR Valve Revenue (undefined), by Type 2025 & 2033
- Figure 3: North America EGR Valve Revenue Share (%), by Type 2025 & 2033
- Figure 4: North America EGR Valve Revenue (undefined), by Application 2025 & 2033
- Figure 5: North America EGR Valve Revenue Share (%), by Application 2025 & 2033
- Figure 6: North America EGR Valve Revenue (undefined), by Country 2025 & 2033
- Figure 7: North America EGR Valve Revenue Share (%), by Country 2025 & 2033
- Figure 8: South America EGR Valve Revenue (undefined), by Type 2025 & 2033
- Figure 9: South America EGR Valve Revenue Share (%), by Type 2025 & 2033
- Figure 10: South America EGR Valve Revenue (undefined), by Application 2025 & 2033
- Figure 11: South America EGR Valve Revenue Share (%), by Application 2025 & 2033
- Figure 12: South America EGR Valve Revenue (undefined), by Country 2025 & 2033
- Figure 13: South America EGR Valve Revenue Share (%), by Country 2025 & 2033
- Figure 14: Europe EGR Valve Revenue (undefined), by Type 2025 & 2033
- Figure 15: Europe EGR Valve Revenue Share (%), by Type 2025 & 2033
- Figure 16: Europe EGR Valve Revenue (undefined), by Application 2025 & 2033
- Figure 17: Europe EGR Valve Revenue Share (%), by Application 2025 & 2033
- Figure 18: Europe EGR Valve Revenue (undefined), by Country 2025 & 2033
- Figure 19: Europe EGR Valve Revenue Share (%), by Country 2025 & 2033
- Figure 20: Middle East & Africa EGR Valve Revenue (undefined), by Type 2025 & 2033
- Figure 21: Middle East & Africa EGR Valve Revenue Share (%), by Type 2025 & 2033
- Figure 22: Middle East & Africa EGR Valve Revenue (undefined), by Application 2025 & 2033
- Figure 23: Middle East & Africa EGR Valve Revenue Share (%), by Application 2025 & 2033
- Figure 24: Middle East & Africa EGR Valve Revenue (undefined), by Country 2025 & 2033
- Figure 25: Middle East & Africa EGR Valve Revenue Share (%), by Country 2025 & 2033
- Figure 26: Asia Pacific EGR Valve Revenue (undefined), by Type 2025 & 2033
- Figure 27: Asia Pacific EGR Valve Revenue Share (%), by Type 2025 & 2033
- Figure 28: Asia Pacific EGR Valve Revenue (undefined), by Application 2025 & 2033
- Figure 29: Asia Pacific EGR Valve Revenue Share (%), by Application 2025 & 2033
- Figure 30: Asia Pacific EGR Valve Revenue (undefined), by Country 2025 & 2033
- Figure 31: Asia Pacific EGR Valve Revenue Share (%), by Country 2025 & 2033
List of Tables
- Table 1: Global EGR Valve Revenue undefined Forecast, by Type 2020 & 2033
- Table 2: Global EGR Valve Revenue undefined Forecast, by Application 2020 & 2033
- Table 3: Global EGR Valve Revenue undefined Forecast, by Region 2020 & 2033
- Table 4: Global EGR Valve Revenue undefined Forecast, by Type 2020 & 2033
- Table 5: Global EGR Valve Revenue undefined Forecast, by Application 2020 & 2033
- Table 6: Global EGR Valve Revenue undefined Forecast, by Country 2020 & 2033
- Table 7: United States EGR Valve Revenue (undefined) Forecast, by Application 2020 & 2033
- Table 8: Canada EGR Valve Revenue (undefined) Forecast, by Application 2020 & 2033
- Table 9: Mexico EGR Valve Revenue (undefined) Forecast, by Application 2020 & 2033
- Table 10: Global EGR Valve Revenue undefined Forecast, by Type 2020 & 2033
- Table 11: Global EGR Valve Revenue undefined Forecast, by Application 2020 & 2033
- Table 12: Global EGR Valve Revenue undefined Forecast, by Country 2020 & 2033
- Table 13: Brazil EGR Valve Revenue (undefined) Forecast, by Application 2020 & 2033
- Table 14: Argentina EGR Valve Revenue (undefined) Forecast, by Application 2020 & 2033
- Table 15: Rest of South America EGR Valve Revenue (undefined) Forecast, by Application 2020 & 2033
- Table 16: Global EGR Valve Revenue undefined Forecast, by Type 2020 & 2033
- Table 17: Global EGR Valve Revenue undefined Forecast, by Application 2020 & 2033
- Table 18: Global EGR Valve Revenue undefined Forecast, by Country 2020 & 2033
- Table 19: United Kingdom EGR Valve Revenue (undefined) Forecast, by Application 2020 & 2033
- Table 20: Germany EGR Valve Revenue (undefined) Forecast, by Application 2020 & 2033
- Table 21: France EGR Valve Revenue (undefined) Forecast, by Application 2020 & 2033
- Table 22: Italy EGR Valve Revenue (undefined) Forecast, by Application 2020 & 2033
- Table 23: Spain EGR Valve Revenue (undefined) Forecast, by Application 2020 & 2033
- Table 24: Russia EGR Valve Revenue (undefined) Forecast, by Application 2020 & 2033
- Table 25: Benelux EGR Valve Revenue (undefined) Forecast, by Application 2020 & 2033
- Table 26: Nordics EGR Valve Revenue (undefined) Forecast, by Application 2020 & 2033
- Table 27: Rest of Europe EGR Valve Revenue (undefined) Forecast, by Application 2020 & 2033
- Table 28: Global EGR Valve Revenue undefined Forecast, by Type 2020 & 2033
- Table 29: Global EGR Valve Revenue undefined Forecast, by Application 2020 & 2033
- Table 30: Global EGR Valve Revenue undefined Forecast, by Country 2020 & 2033
- Table 31: Turkey EGR Valve Revenue (undefined) Forecast, by Application 2020 & 2033
- Table 32: Israel EGR Valve Revenue (undefined) Forecast, by Application 2020 & 2033
- Table 33: GCC EGR Valve Revenue (undefined) Forecast, by Application 2020 & 2033
- Table 34: North Africa EGR Valve Revenue (undefined) Forecast, by Application 2020 & 2033
- Table 35: South Africa EGR Valve Revenue (undefined) Forecast, by Application 2020 & 2033
- Table 36: Rest of Middle East & Africa EGR Valve Revenue (undefined) Forecast, by Application 2020 & 2033
- Table 37: Global EGR Valve Revenue undefined Forecast, by Type 2020 & 2033
- Table 38: Global EGR Valve Revenue undefined Forecast, by Application 2020 & 2033
- Table 39: Global EGR Valve Revenue undefined Forecast, by Country 2020 & 2033
- Table 40: China EGR Valve Revenue (undefined) Forecast, by Application 2020 & 2033
- Table 41: India EGR Valve Revenue (undefined) Forecast, by Application 2020 & 2033
- Table 42: Japan EGR Valve Revenue (undefined) Forecast, by Application 2020 & 2033
- Table 43: South Korea EGR Valve Revenue (undefined) Forecast, by Application 2020 & 2033
- Table 44: ASEAN EGR Valve Revenue (undefined) Forecast, by Application 2020 & 2033
- Table 45: Oceania EGR Valve Revenue (undefined) Forecast, by Application 2020 & 2033
- Table 46: Rest of Asia Pacific EGR Valve Revenue (undefined) Forecast, by Application 2020 & 2033
Frequently Asked Questions
1. What is the projected Compound Annual Growth Rate (CAGR) of the EGR Valve?
The projected CAGR is approximately 7.28%.
2. Which companies are prominent players in the EGR Valve?
Key companies in the market include Nissens, BorgWarner, Denso, Valeo, Delphi Technologies, Rheinmetall Automotive, Continental, Mahle, Korens, Keihin, Longsheng Technology, Eberspacher, Faurecia, Yibin Tianruida, MEET Automotive, Klubert + Schmidt, Zhejiang Jiulong, Gits Manufacturing, Yinlun Machinery.
3. What are the main segments of the EGR Valve?
The market segments include Type, Application.
4. Can you provide details about the market size?
The market size is estimated to be USD XXX N/A as of 2022.
5. What are some drivers contributing to market growth?
N/A
6. What are the notable trends driving market growth?
N/A
7. Are there any restraints impacting market growth?
N/A
8. Can you provide examples of recent developments in the market?
N/A
9. What pricing options are available for accessing the report?
Pricing options include single-user, multi-user, and enterprise licenses priced at USD 5600.00, USD 8400.00, and USD 11200.00 respectively.
10. Is the market size provided in terms of value or volume?
The market size is provided in terms of value, measured in N/A.
11. Are there any specific market keywords associated with the report?
Yes, the market keyword associated with the report is "EGR Valve," which aids in identifying and referencing the specific market segment covered.
12. How do I determine which pricing option suits my needs best?
The pricing options vary based on user requirements and access needs. Individual users may opt for single-user licenses, while businesses requiring broader access may choose multi-user or enterprise licenses for cost-effective access to the report.
13. Are there any additional resources or data provided in the EGR Valve report?
While the report offers comprehensive insights, it's advisable to review the specific contents or supplementary materials provided to ascertain if additional resources or data are available.
14. How can I stay updated on further developments or reports in the EGR Valve?
To stay informed about further developments, trends, and reports in the EGR Valve, consider subscribing to industry newsletters, following relevant companies and organizations, or regularly checking reputable industry news sources and publications.
Methodology
Step 1 - Identification of Relevant Samples Size from Population Database


Step 2 - Approaches for Defining Global Market Size (Value, Volume* & Price*)

Note*: In applicable scenarios
Step 3 - Data Sources
Primary Research
- Web Analytics
- Survey Reports
- Research Institute
- Latest Research Reports
- Opinion Leaders
Secondary Research
- Annual Reports
- White Paper
- Latest Press Release
- Industry Association
- Paid Database
- Investor Presentations

Step 4 - Data Triangulation
Involves using different sources of information in order to increase the validity of a study
These sources are likely to be stakeholders in a program - participants, other researchers, program staff, other community members, and so on.
Then we put all data in single framework & apply various statistical tools to find out the dynamic on the market.
During the analysis stage, feedback from the stakeholder groups would be compared to determine areas of agreement as well as areas of divergence