

Key Insights
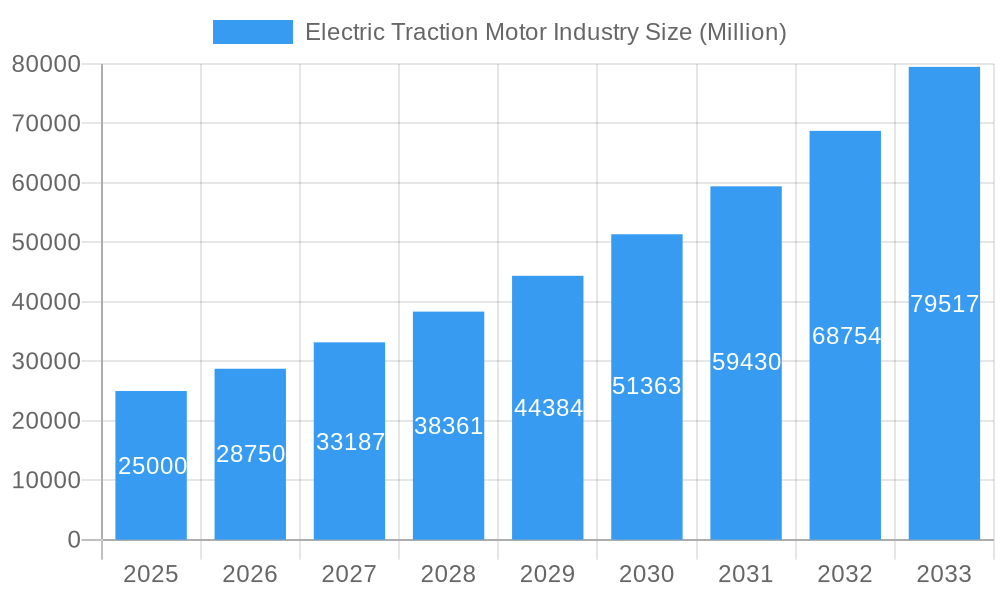
The electric traction motor market is experiencing significant expansion, driven by global sustainability initiatives and industrial electrification. With an estimated market size of 15.87 billion in 2025 and a projected Compound Annual Growth Rate (CAGR) of 8.82%, the industry is set for substantial growth through 2033. Key growth drivers include the rapidly expanding electric vehicle (EV) sector, increased railway electrification, and the growing integration of electric motors in industrial machinery. Technological advancements enhancing efficiency, power density, and durability are further stimulating market development. The market is segmented by motor type (AC and DC), power output (below 200 kW, 200-400 kW, and above 400 kW), and application (railway, electric vehicle, industrial machinery, and others). While initial investment may present a challenge, long-term operational savings from reduced energy consumption and maintenance offer compelling advantages. Supportive government policies and incentives promoting electric mobility and sustainable practices are also reinforcing market growth. Leading companies, including Kirloskar Electric, ABB, Bosch, CRRC, Siemens, and Alstom, are actively innovating and expanding, fostering a competitive and dynamic market environment.
Electric Traction Motor Industry Market Size (In Billion)
Regional market penetration varies, with North America, Europe, and Asia-Pacific anticipated to lead. Rapid industrialization and urbanization, particularly in Asia-Pacific, are generating robust demand. The expansion of high-speed rail networks also significantly contributes to regional growth. Europe's strong commitment to sustainability and stringent emission standards are driving adoption. North America's advanced automotive industry, with a pronounced focus on EVs, further fuels market expansion. Strategic collaborations, mergers, and acquisitions are expected to shape market consolidation. The forecast period (2025-2033) presents considerable growth opportunities across all segments and regions.
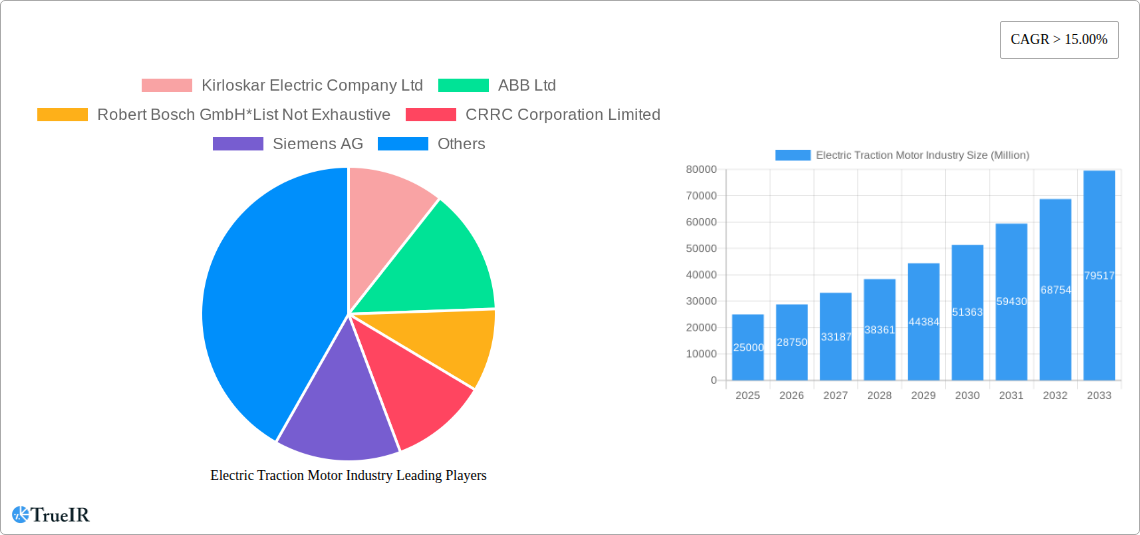
Electric Traction Motor Industry Company Market Share
Electric Traction Motor Industry Market Report: 2019-2033
This comprehensive report provides a detailed analysis of the global Electric Traction Motor industry, offering invaluable insights for stakeholders seeking to navigate this rapidly evolving market. Covering the period 2019-2033, with a base year of 2025 and a forecast period of 2025-2033, this report unveils market dynamics, growth drivers, and key challenges. The global market size is projected to reach xx Million by 2033, exhibiting a robust CAGR. This in-depth study meticulously examines various segments, including AC and DC motors, different power ratings (below 200 kW, 200-400 kW, above 400 kW), and applications across railway, electric vehicle, industrial machinery, and other sectors.
Electric Traction Motor Industry Market Structure & Competitive Landscape
The electric traction motor market is characterized by a moderately concentrated landscape, with several major players holding significant market share. The Herfindahl-Hirschman Index (HHI) for 2024 is estimated at xx, indicating a moderately concentrated market. Key players, including ABB Ltd, Siemens AG, Alstom SA, and CRRC Corporation Limited, drive innovation through continuous R&D investments in high-efficiency, high-power density motors. Regulatory changes, particularly those focused on emission reduction and energy efficiency, exert a significant influence on market dynamics. Furthermore, the growing demand for electric vehicles and railway modernization projects fuels market expansion. Substitute technologies, such as hydraulic and pneumatic systems, face increasing competition due to the superior efficiency and performance of electric traction motors. The industry witnesses frequent mergers and acquisitions (M&A) activities, with a total M&A volume exceeding xx Million in the historical period (2019-2024). End-user segmentation is primarily driven by the railway sector, followed by the electric vehicle industry.
- Market Concentration: Moderately concentrated, with HHI of xx in 2024.
- Innovation Drivers: R&D investments in high-efficiency motors, advancements in power electronics.
- Regulatory Impacts: Stringent emission norms and energy efficiency standards.
- Product Substitutes: Hydraulic and pneumatic systems facing increasing competition.
- End-User Segmentation: Railway sector dominates, followed by electric vehicles.
- M&A Trends: Significant M&A activity, with a total volume exceeding xx Million (2019-2024).
Electric Traction Motor Industry Market Trends & Opportunities
The global electric traction motor market is experiencing significant growth, driven by the burgeoning demand for electric vehicles and the ongoing modernization of railway systems worldwide. The market size is projected to reach xx Million by 2033, exhibiting a substantial CAGR of xx% during the forecast period (2025-2033). Technological advancements, such as the adoption of silicon carbide (SiC) based inverters and permanent magnet synchronous motors (PMSM), are enhancing motor efficiency and performance. Consumer preference shifts towards electric mobility and environmentally friendly transportation solutions are further fueling market expansion. However, the competitive landscape remains intense, with established players and new entrants vying for market share. This necessitates continuous innovation and strategic partnerships to maintain a competitive edge. The market penetration rate for electric traction motors in the railway sector is expected to reach xx% by 2033, while the electric vehicle segment is projected to show even faster growth.
Dominant Markets & Segments in Electric Traction Motor Industry
The railway sector currently dominates the electric traction motor market, accounting for xx% of the total market share in 2024. Within power rating segments, the "Above 400 kW" category leads, driven by high-speed rail applications. Geographically, Asia-Pacific is currently the leading region, followed by Europe and North America.
Key Growth Drivers:
- Railway Sector: Government investments in high-speed rail infrastructure and modernization projects.
- Electric Vehicle Sector: Rising adoption of EVs globally, driven by environmental concerns and technological advancements.
- Industrial Machinery: Growing automation in industrial processes and increasing demand for energy-efficient motors.
Market Dominance Analysis:
- Region: Asia-Pacific holds the largest market share, fueled by rapid industrialization and infrastructure development.
- Type: Alternating Current (AC) motors hold a larger market share compared to Direct Current (DC) motors due to their higher efficiency and better controllability.
- Power Rating: The "Above 400 kW" segment dominates due to its prevalence in high-power applications like high-speed rail and heavy-duty vehicles.
- Application: Railway applications constitute the largest segment, followed by electric vehicles and industrial machinery.
Electric Traction Motor Industry Product Analysis
Technological advancements in electric traction motors are focused on improving efficiency, power density, and reliability. The adoption of rare-earth magnets, advanced cooling techniques, and high-performance power electronics has led to the development of more compact and efficient motors. These advancements are driving the adoption of electric traction motors across diverse applications, from high-speed trains to electric buses and industrial machinery. The competitive advantage lies in offering superior performance, energy efficiency, and longer lifespan, making the product more cost-effective in the long run.
Key Drivers, Barriers & Challenges in Electric Traction Motor Industry
Key Drivers: Increasing demand for electric vehicles and hybrid vehicles is a primary driver, along with government initiatives promoting green transportation and industrial automation. Technological advancements in motor design and power electronics also contribute to growth.
Key Challenges: Supply chain disruptions, particularly related to rare-earth materials used in permanent magnet motors, pose a significant challenge. Stringent regulatory requirements and environmental concerns add to the complexity. Intense competition from established players and emerging market entrants also puts pressure on profit margins. The cost of raw materials like copper and steel fluctuates impacting production cost.
Growth Drivers in the Electric Traction Motor Industry Market
The growth of the electric traction motor market is propelled by several key factors, including the rising demand for electric vehicles, the expansion of high-speed rail networks globally, and stringent government regulations promoting sustainable transportation. Further, advancements in power electronics, material science, and motor design contribute to higher efficiency, power density, and reliability of these motors. These factors collectively create a robust and expanding market.
Challenges Impacting Electric Traction Motor Industry Growth
The growth of the electric traction motor industry faces several challenges. These include the volatile price of raw materials, the increasing complexity of supply chains, and intense competition. Furthermore, environmental concerns related to the disposal of rare-earth magnets and the need for robust recycling infrastructure pose significant hurdles. Stricter emission norms and safety regulations add to the challenges, along with potential technological disruptions.
Key Players Shaping the Electric Traction Motor Industry Market
- Kirloskar Electric Company Ltd
- ABB Ltd
- Robert Bosch GmbH
- CRRC Corporation Limited
- Siemens AG
- Alstom SA
- Traktionssysteme Austria (TSA) GmbH
- CG Power and Industrial Solutions Ltd
- General Electric Company
- Skoda Transportation AS
Significant Electric Traction Motor Industry Industry Milestones
- 2020: Siemens AG launches a new generation of highly efficient traction motors for electric trains.
- 2021: ABB Ltd and Alstom SA announce a strategic partnership to develop next-generation traction motor systems.
- 2022: CRRC Corporation Limited unveils a new high-speed train with improved traction motor technology.
- 2023: Robert Bosch GmbH announces significant investment in R&D for electric motor technology for EVs.
Future Outlook for Electric Traction Motor Industry Market
The future of the electric traction motor industry appears bright, driven by the sustained growth in electric vehicles and the expansion of railway networks globally. Strategic partnerships, technological innovation, and government support will play crucial roles in shaping the market. The focus will likely shift towards enhancing motor efficiency, reducing costs, and improving sustainability. This will lead to further market expansion and diversification.
Electric Traction Motor Industry Segmentation
-
1. Type
- 1.1. Alternating Current
- 1.2. Direct Current
-
2. Power Rating
- 2.1. Below 200 kW
- 2.2. 200 - 400 kW
- 2.3. Above 400 kW
-
3. Application
- 3.1. Railway
- 3.2. Electric Vehicle
- 3.3. Industrial Machinery
- 3.4. Others
Electric Traction Motor Industry Segmentation By Geography
- 1. North America
- 2. Asia Pacific
- 3. Europe
- 4. South America
- 5. Middle East and Africa
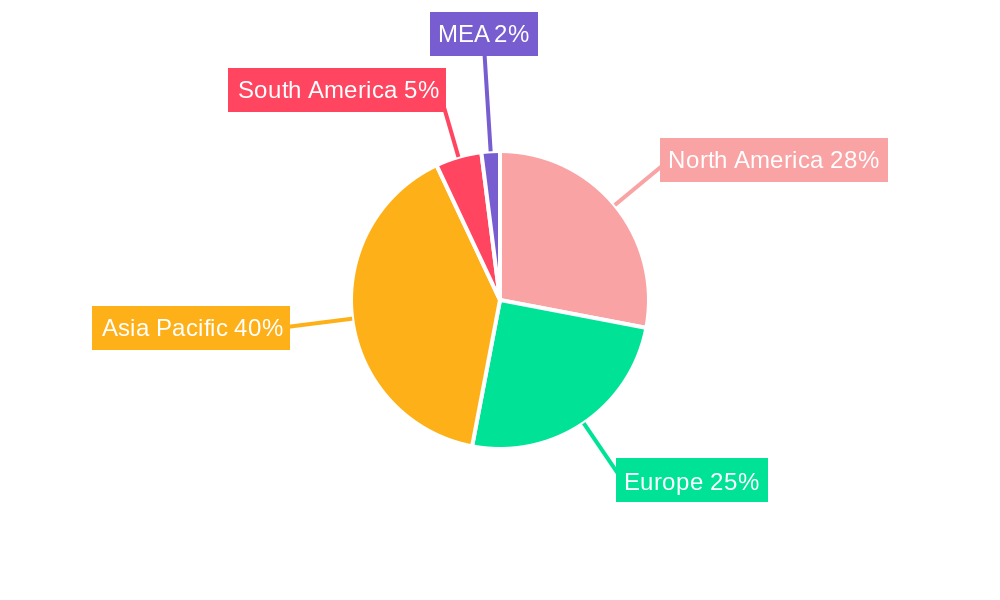
Electric Traction Motor Industry Regional Market Share
Geographic Coverage of Electric Traction Motor Industry
Electric Traction Motor Industry REPORT HIGHLIGHTS
| Aspects | Details |
|---|---|
| Study Period | 2020-2034 |
| Base Year | 2025 |
| Estimated Year | 2026 |
| Forecast Period | 2026-2034 |
| Historical Period | 2020-2025 |
| Growth Rate | CAGR of 8.82% from 2020-2034 |
| Segmentation |
|
Table of Contents
- 1. Introduction
- 1.1. Research Scope
- 1.2. Market Segmentation
- 1.3. Research Objective
- 1.4. Definitions and Assumptions
- 2. Executive Summary
- 2.1. Market Snapshot
- 3. Market Dynamics
- 3.1. Market Drivers
- 3.2. Market Restrains
- 3.3. Market Trends
- 3.4. Market Opportunities
- 4. Market Factor Analysis
- 4.1. Porters Five Forces
- 4.1.1. Bargaining Power of Suppliers
- 4.1.2. Bargaining Power of Buyers
- 4.1.3. Threat of New Entrants
- 4.1.4. Threat of Substitutes
- 4.1.5. Competitive Rivalry
- 4.2. PESTEL analysis
- 4.3. BCG Analysis
- 4.3.1. Stars (High Growth, High Market Share)
- 4.3.2. Cash Cows (Low Growth, High Market Share)
- 4.3.3. Question Mark (High Growth, Low Market Share)
- 4.3.4. Dogs (Low Growth, Low Market Share)
- 4.4. Ansoff Matrix Analysis
- 4.5. Supply Chain Analysis
- 4.6. Regulatory Landscape
- 4.7. Current Market Potential and Opportunity Assessment (TAM–SAM–SOM Framework)
- 4.8. TIR Analyst Note
- 4.1. Porters Five Forces
- 5. Market Analysis, Insights and Forecast 2021-2033
- 5.1. Market Analysis, Insights and Forecast - by Type
- 5.1.1. Alternating Current
- 5.1.2. Direct Current
- 5.2. Market Analysis, Insights and Forecast - by Power Rating
- 5.2.1. Below 200 kW
- 5.2.2. 200 - 400 kW
- 5.2.3. Above 400 kW
- 5.3. Market Analysis, Insights and Forecast - by Application
- 5.3.1. Railway
- 5.3.2. Electric Vehicle
- 5.3.3. Industrial Machinery
- 5.3.4. Others
- 5.4. Market Analysis, Insights and Forecast - by Region
- 5.4.1. North America
- 5.4.2. Asia Pacific
- 5.4.3. Europe
- 5.4.4. South America
- 5.4.5. Middle East and Africa
- 5.1. Market Analysis, Insights and Forecast - by Type
- 6. Global Electric Traction Motor Industry Analysis, Insights and Forecast, 2021-2033
- 6.1. Market Analysis, Insights and Forecast - by Type
- 6.1.1. Alternating Current
- 6.1.2. Direct Current
- 6.2. Market Analysis, Insights and Forecast - by Power Rating
- 6.2.1. Below 200 kW
- 6.2.2. 200 - 400 kW
- 6.2.3. Above 400 kW
- 6.3. Market Analysis, Insights and Forecast - by Application
- 6.3.1. Railway
- 6.3.2. Electric Vehicle
- 6.3.3. Industrial Machinery
- 6.3.4. Others
- 6.1. Market Analysis, Insights and Forecast - by Type
- 7. North America Electric Traction Motor Industry Analysis, Insights and Forecast, 2020-2032
- 7.1. Market Analysis, Insights and Forecast - by Type
- 7.1.1. Alternating Current
- 7.1.2. Direct Current
- 7.2. Market Analysis, Insights and Forecast - by Power Rating
- 7.2.1. Below 200 kW
- 7.2.2. 200 - 400 kW
- 7.2.3. Above 400 kW
- 7.3. Market Analysis, Insights and Forecast - by Application
- 7.3.1. Railway
- 7.3.2. Electric Vehicle
- 7.3.3. Industrial Machinery
- 7.3.4. Others
- 7.1. Market Analysis, Insights and Forecast - by Type
- 8. Asia Pacific Electric Traction Motor Industry Analysis, Insights and Forecast, 2020-2032
- 8.1. Market Analysis, Insights and Forecast - by Type
- 8.1.1. Alternating Current
- 8.1.2. Direct Current
- 8.2. Market Analysis, Insights and Forecast - by Power Rating
- 8.2.1. Below 200 kW
- 8.2.2. 200 - 400 kW
- 8.2.3. Above 400 kW
- 8.3. Market Analysis, Insights and Forecast - by Application
- 8.3.1. Railway
- 8.3.2. Electric Vehicle
- 8.3.3. Industrial Machinery
- 8.3.4. Others
- 8.1. Market Analysis, Insights and Forecast - by Type
- 9. Europe Electric Traction Motor Industry Analysis, Insights and Forecast, 2020-2032
- 9.1. Market Analysis, Insights and Forecast - by Type
- 9.1.1. Alternating Current
- 9.1.2. Direct Current
- 9.2. Market Analysis, Insights and Forecast - by Power Rating
- 9.2.1. Below 200 kW
- 9.2.2. 200 - 400 kW
- 9.2.3. Above 400 kW
- 9.3. Market Analysis, Insights and Forecast - by Application
- 9.3.1. Railway
- 9.3.2. Electric Vehicle
- 9.3.3. Industrial Machinery
- 9.3.4. Others
- 9.1. Market Analysis, Insights and Forecast - by Type
- 10. South America Electric Traction Motor Industry Analysis, Insights and Forecast, 2020-2032
- 10.1. Market Analysis, Insights and Forecast - by Type
- 10.1.1. Alternating Current
- 10.1.2. Direct Current
- 10.2. Market Analysis, Insights and Forecast - by Power Rating
- 10.2.1. Below 200 kW
- 10.2.2. 200 - 400 kW
- 10.2.3. Above 400 kW
- 10.3. Market Analysis, Insights and Forecast - by Application
- 10.3.1. Railway
- 10.3.2. Electric Vehicle
- 10.3.3. Industrial Machinery
- 10.3.4. Others
- 10.1. Market Analysis, Insights and Forecast - by Type
- 11. Middle East and Africa Electric Traction Motor Industry Analysis, Insights and Forecast, 2020-2032
- 11.1. Market Analysis, Insights and Forecast - by Type
- 11.1.1. Alternating Current
- 11.1.2. Direct Current
- 11.2. Market Analysis, Insights and Forecast - by Power Rating
- 11.2.1. Below 200 kW
- 11.2.2. 200 - 400 kW
- 11.2.3. Above 400 kW
- 11.3. Market Analysis, Insights and Forecast - by Application
- 11.3.1. Railway
- 11.3.2. Electric Vehicle
- 11.3.3. Industrial Machinery
- 11.3.4. Others
- 11.1. Market Analysis, Insights and Forecast - by Type
- 12. Competitive Analysis
- 12.1. Company Profiles
- 12.1.1 Kirloskar Electric Company Ltd
- 12.1.1.1. Company Overview
- 12.1.1.2. Products
- 12.1.1.3. Company Financials
- 12.1.1.4. SWOT Analysis
- 12.1.2 ABB Ltd
- 12.1.2.1. Company Overview
- 12.1.2.2. Products
- 12.1.2.3. Company Financials
- 12.1.2.4. SWOT Analysis
- 12.1.3 Robert Bosch GmbH*List Not Exhaustive
- 12.1.3.1. Company Overview
- 12.1.3.2. Products
- 12.1.3.3. Company Financials
- 12.1.3.4. SWOT Analysis
- 12.1.4 CRRC Corporation Limited
- 12.1.4.1. Company Overview
- 12.1.4.2. Products
- 12.1.4.3. Company Financials
- 12.1.4.4. SWOT Analysis
- 12.1.5 Siemens AG
- 12.1.5.1. Company Overview
- 12.1.5.2. Products
- 12.1.5.3. Company Financials
- 12.1.5.4. SWOT Analysis
- 12.1.6 Alstom SA
- 12.1.6.1. Company Overview
- 12.1.6.2. Products
- 12.1.6.3. Company Financials
- 12.1.6.4. SWOT Analysis
- 12.1.7 Traktionssysteme Austria (TSA) GmbH
- 12.1.7.1. Company Overview
- 12.1.7.2. Products
- 12.1.7.3. Company Financials
- 12.1.7.4. SWOT Analysis
- 12.1.8 CG Power and Industrial Solutions Ltd
- 12.1.8.1. Company Overview
- 12.1.8.2. Products
- 12.1.8.3. Company Financials
- 12.1.8.4. SWOT Analysis
- 12.1.9 General Electric Company
- 12.1.9.1. Company Overview
- 12.1.9.2. Products
- 12.1.9.3. Company Financials
- 12.1.9.4. SWOT Analysis
- 12.1.10 Skoda Transportation AS
- 12.1.10.1. Company Overview
- 12.1.10.2. Products
- 12.1.10.3. Company Financials
- 12.1.10.4. SWOT Analysis
- 12.1.1 Kirloskar Electric Company Ltd
- 12.2. Market Entropy
- 12.2.1 Company's Key Areas Served
- 12.2.2 Recent Developments
- 12.3. Company Market Share Analysis 2025
- 12.3.1 Top 5 Companies Market Share Analysis
- 12.3.2 Top 3 Companies Market Share Analysis
- 12.4. List of Potential Customers
- 13. Research Methodology
List of Figures
- Figure 1: Global Electric Traction Motor Industry Revenue Breakdown (billion, %) by Region 2025 & 2033
- Figure 2: North America Electric Traction Motor Industry Revenue (billion), by Type 2025 & 2033
- Figure 3: North America Electric Traction Motor Industry Revenue Share (%), by Type 2025 & 2033
- Figure 4: North America Electric Traction Motor Industry Revenue (billion), by Power Rating 2025 & 2033
- Figure 5: North America Electric Traction Motor Industry Revenue Share (%), by Power Rating 2025 & 2033
- Figure 6: North America Electric Traction Motor Industry Revenue (billion), by Application 2025 & 2033
- Figure 7: North America Electric Traction Motor Industry Revenue Share (%), by Application 2025 & 2033
- Figure 8: North America Electric Traction Motor Industry Revenue (billion), by Country 2025 & 2033
- Figure 9: North America Electric Traction Motor Industry Revenue Share (%), by Country 2025 & 2033
- Figure 10: Asia Pacific Electric Traction Motor Industry Revenue (billion), by Type 2025 & 2033
- Figure 11: Asia Pacific Electric Traction Motor Industry Revenue Share (%), by Type 2025 & 2033
- Figure 12: Asia Pacific Electric Traction Motor Industry Revenue (billion), by Power Rating 2025 & 2033
- Figure 13: Asia Pacific Electric Traction Motor Industry Revenue Share (%), by Power Rating 2025 & 2033
- Figure 14: Asia Pacific Electric Traction Motor Industry Revenue (billion), by Application 2025 & 2033
- Figure 15: Asia Pacific Electric Traction Motor Industry Revenue Share (%), by Application 2025 & 2033
- Figure 16: Asia Pacific Electric Traction Motor Industry Revenue (billion), by Country 2025 & 2033
- Figure 17: Asia Pacific Electric Traction Motor Industry Revenue Share (%), by Country 2025 & 2033
- Figure 18: Europe Electric Traction Motor Industry Revenue (billion), by Type 2025 & 2033
- Figure 19: Europe Electric Traction Motor Industry Revenue Share (%), by Type 2025 & 2033
- Figure 20: Europe Electric Traction Motor Industry Revenue (billion), by Power Rating 2025 & 2033
- Figure 21: Europe Electric Traction Motor Industry Revenue Share (%), by Power Rating 2025 & 2033
- Figure 22: Europe Electric Traction Motor Industry Revenue (billion), by Application 2025 & 2033
- Figure 23: Europe Electric Traction Motor Industry Revenue Share (%), by Application 2025 & 2033
- Figure 24: Europe Electric Traction Motor Industry Revenue (billion), by Country 2025 & 2033
- Figure 25: Europe Electric Traction Motor Industry Revenue Share (%), by Country 2025 & 2033
- Figure 26: South America Electric Traction Motor Industry Revenue (billion), by Type 2025 & 2033
- Figure 27: South America Electric Traction Motor Industry Revenue Share (%), by Type 2025 & 2033
- Figure 28: South America Electric Traction Motor Industry Revenue (billion), by Power Rating 2025 & 2033
- Figure 29: South America Electric Traction Motor Industry Revenue Share (%), by Power Rating 2025 & 2033
- Figure 30: South America Electric Traction Motor Industry Revenue (billion), by Application 2025 & 2033
- Figure 31: South America Electric Traction Motor Industry Revenue Share (%), by Application 2025 & 2033
- Figure 32: South America Electric Traction Motor Industry Revenue (billion), by Country 2025 & 2033
- Figure 33: South America Electric Traction Motor Industry Revenue Share (%), by Country 2025 & 2033
- Figure 34: Middle East and Africa Electric Traction Motor Industry Revenue (billion), by Type 2025 & 2033
- Figure 35: Middle East and Africa Electric Traction Motor Industry Revenue Share (%), by Type 2025 & 2033
- Figure 36: Middle East and Africa Electric Traction Motor Industry Revenue (billion), by Power Rating 2025 & 2033
- Figure 37: Middle East and Africa Electric Traction Motor Industry Revenue Share (%), by Power Rating 2025 & 2033
- Figure 38: Middle East and Africa Electric Traction Motor Industry Revenue (billion), by Application 2025 & 2033
- Figure 39: Middle East and Africa Electric Traction Motor Industry Revenue Share (%), by Application 2025 & 2033
- Figure 40: Middle East and Africa Electric Traction Motor Industry Revenue (billion), by Country 2025 & 2033
- Figure 41: Middle East and Africa Electric Traction Motor Industry Revenue Share (%), by Country 2025 & 2033
List of Tables
- Table 1: Global Electric Traction Motor Industry Revenue billion Forecast, by Type 2020 & 2033
- Table 2: Global Electric Traction Motor Industry Revenue billion Forecast, by Power Rating 2020 & 2033
- Table 3: Global Electric Traction Motor Industry Revenue billion Forecast, by Application 2020 & 2033
- Table 4: Global Electric Traction Motor Industry Revenue billion Forecast, by Region 2020 & 2033
- Table 5: Global Electric Traction Motor Industry Revenue billion Forecast, by Type 2020 & 2033
- Table 6: Global Electric Traction Motor Industry Revenue billion Forecast, by Power Rating 2020 & 2033
- Table 7: Global Electric Traction Motor Industry Revenue billion Forecast, by Application 2020 & 2033
- Table 8: Global Electric Traction Motor Industry Revenue billion Forecast, by Country 2020 & 2033
- Table 9: Global Electric Traction Motor Industry Revenue billion Forecast, by Type 2020 & 2033
- Table 10: Global Electric Traction Motor Industry Revenue billion Forecast, by Power Rating 2020 & 2033
- Table 11: Global Electric Traction Motor Industry Revenue billion Forecast, by Application 2020 & 2033
- Table 12: Global Electric Traction Motor Industry Revenue billion Forecast, by Country 2020 & 2033
- Table 13: Global Electric Traction Motor Industry Revenue billion Forecast, by Type 2020 & 2033
- Table 14: Global Electric Traction Motor Industry Revenue billion Forecast, by Power Rating 2020 & 2033
- Table 15: Global Electric Traction Motor Industry Revenue billion Forecast, by Application 2020 & 2033
- Table 16: Global Electric Traction Motor Industry Revenue billion Forecast, by Country 2020 & 2033
- Table 17: Global Electric Traction Motor Industry Revenue billion Forecast, by Type 2020 & 2033
- Table 18: Global Electric Traction Motor Industry Revenue billion Forecast, by Power Rating 2020 & 2033
- Table 19: Global Electric Traction Motor Industry Revenue billion Forecast, by Application 2020 & 2033
- Table 20: Global Electric Traction Motor Industry Revenue billion Forecast, by Country 2020 & 2033
- Table 21: Global Electric Traction Motor Industry Revenue billion Forecast, by Type 2020 & 2033
- Table 22: Global Electric Traction Motor Industry Revenue billion Forecast, by Power Rating 2020 & 2033
- Table 23: Global Electric Traction Motor Industry Revenue billion Forecast, by Application 2020 & 2033
- Table 24: Global Electric Traction Motor Industry Revenue billion Forecast, by Country 2020 & 2033
Frequently Asked Questions
1. What is the projected Compound Annual Growth Rate (CAGR) of the Electric Traction Motor Industry?
The projected CAGR is approximately 8.82%.
2. Which companies are prominent players in the Electric Traction Motor Industry?
Key companies in the market include Kirloskar Electric Company Ltd, ABB Ltd, Robert Bosch GmbH*List Not Exhaustive, CRRC Corporation Limited, Siemens AG, Alstom SA, Traktionssysteme Austria (TSA) GmbH, CG Power and Industrial Solutions Ltd, General Electric Company, Skoda Transportation AS.
3. What are the main segments of the Electric Traction Motor Industry?
The market segments include Type, Power Rating, Application.
4. Can you provide details about the market size?
The market size is estimated to be USD 15.87 billion as of 2022.
5. What are some drivers contributing to market growth?
4.; Increasing Integration Of Renewable Energy Generation4.; Aging Power Grids And Investments In Transmission And Distribution Infrastructure.
6. What are the notable trends driving market growth?
Electric Vehicle to Witness Significant Growth.
7. Are there any restraints impacting market growth?
4.; Lack Of Investor Confidence Due To Sociopolitical Instability In Some Countries.
8. Can you provide examples of recent developments in the market?
N/A
9. What pricing options are available for accessing the report?
Pricing options include single-user, multi-user, and enterprise licenses priced at USD 4750, USD 5250, and USD 8750 respectively.
10. Is the market size provided in terms of value or volume?
The market size is provided in terms of value, measured in billion.
11. Are there any specific market keywords associated with the report?
Yes, the market keyword associated with the report is "Electric Traction Motor Industry," which aids in identifying and referencing the specific market segment covered.
12. How do I determine which pricing option suits my needs best?
The pricing options vary based on user requirements and access needs. Individual users may opt for single-user licenses, while businesses requiring broader access may choose multi-user or enterprise licenses for cost-effective access to the report.
13. Are there any additional resources or data provided in the Electric Traction Motor Industry report?
While the report offers comprehensive insights, it's advisable to review the specific contents or supplementary materials provided to ascertain if additional resources or data are available.
14. How can I stay updated on further developments or reports in the Electric Traction Motor Industry?
To stay informed about further developments, trends, and reports in the Electric Traction Motor Industry, consider subscribing to industry newsletters, following relevant companies and organizations, or regularly checking reputable industry news sources and publications.
Methodology
Step 1 - Identification of Relevant Samples Size from Population Database


Step 2 - Approaches for Defining Global Market Size (Value, Volume* & Price*)

Note*: In applicable scenarios
Step 3 - Data Sources
Primary Research
- Web Analytics
- Survey Reports
- Research Institute
- Latest Research Reports
- Opinion Leaders
Secondary Research
- Annual Reports
- White Paper
- Latest Press Release
- Industry Association
- Paid Database
- Investor Presentations

Step 4 - Data Triangulation
Involves using different sources of information in order to increase the validity of a study
These sources are likely to be stakeholders in a program - participants, other researchers, program staff, other community members, and so on.
Then we put all data in single framework & apply various statistical tools to find out the dynamic on the market.
During the analysis stage, feedback from the stakeholder groups would be compared to determine areas of agreement as well as areas of divergence