

Key Insights
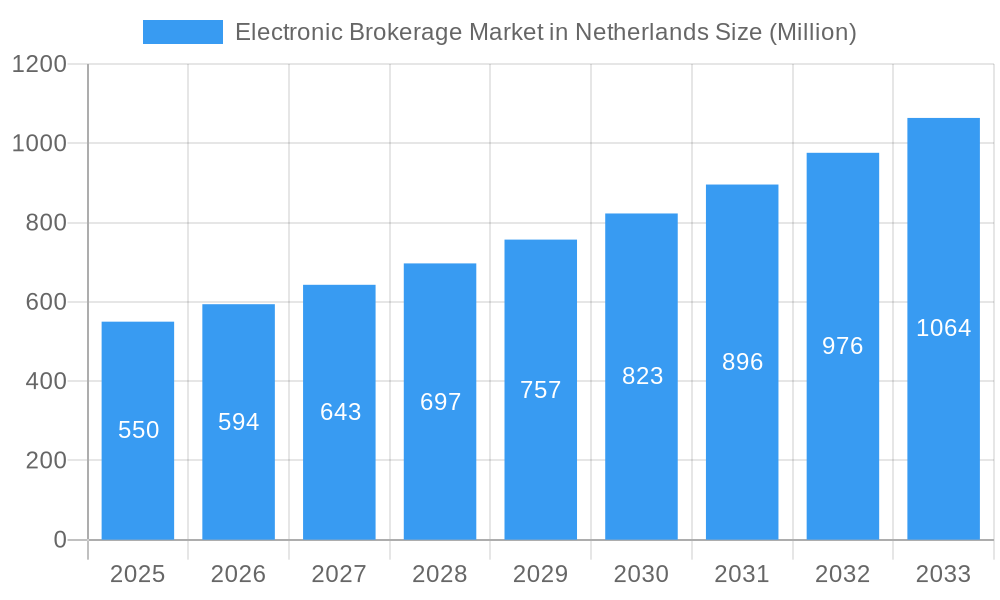
The Netherlands electronic brokerage market demonstrates strong growth potential, aligning with global trends. Fueled by a sophisticated financial infrastructure, high internet penetration, and a digitally adept population, the market is poised for significant expansion. The historical period (2019-2024) saw consistent growth driven by increased online trading, facilitated by mobile accessibility and commission-free platforms. Projecting from a base year of 2024, the market, estimated at 1.12 billion, is expected to expand at a CAGR of 7.3% through 2033. Key growth drivers include evolving investor demographics, regulatory advancements in online trading, and the adoption of innovative technologies such as AI-driven trading tools.
Electronic Brokerage Market in Netherlands Market Size (In Billion)
The competitive environment will remain dynamic, characterized by competition among established international firms and specialized niche brokerages. Key differentiators will include superior user experience, robust security protocols, and competitive fee structures. The integration of fintech solutions and the proliferation of robo-advisors will further refine market growth, offering enhanced and accessible investment opportunities to a broader Dutch investor base.
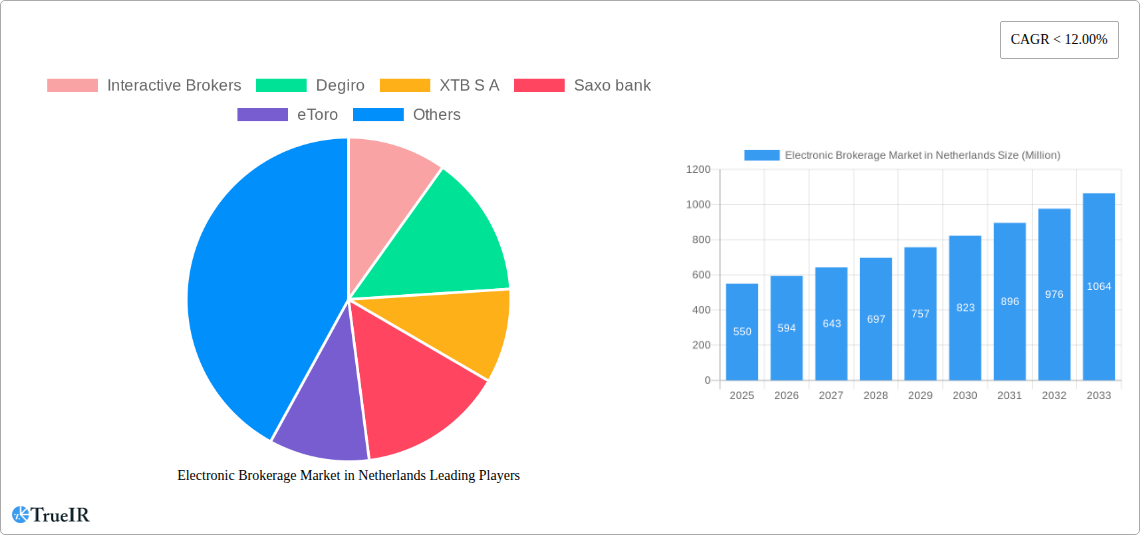
Electronic Brokerage Market in Netherlands Company Market Share
Electronic Brokerage Market in Netherlands: A Comprehensive Report (2019-2033)
This dynamic report provides an in-depth analysis of the Electronic Brokerage Market in the Netherlands, covering the period 2019-2033. It offers invaluable insights into market structure, competitive dynamics, growth drivers, and future prospects, making it an essential resource for investors, industry professionals, and strategic decision-makers. The report leverages extensive data analysis and expert commentary to forecast a robust growth trajectory for the market, providing a clear roadmap for navigating this evolving landscape. Key players like Interactive Brokers, Degiro, XTB S A, Saxo Bank, eToro, Euronext Group, LYNX, IC Markets, RoboForex, and FP Markets (list not exhaustive) are profiled, highlighting their strategies and market positions. The report's detailed segmentation and quantitative projections provide a powerful tool for understanding the intricacies of this dynamic market.
Electronic Brokerage Market in Netherlands Market Structure & Competitive Landscape
The Netherlands' electronic brokerage market exhibits a moderately concentrated structure, with a few dominant players capturing significant market share. The Herfindahl-Hirschman Index (HHI) for 2024 is estimated at xx, indicating a relatively competitive yet consolidated landscape. Innovation is a key driver, with companies constantly introducing new trading platforms, tools, and investment products to attract and retain clients. Regulatory oversight by De Nederlandsche Bank (DNB) significantly shapes market practices, demanding robust compliance and security measures. The market faces competition from traditional brokerage firms, but the convenience and cost-effectiveness of electronic platforms are driving market growth. End-users are segmented primarily into retail investors and institutional investors, each with unique needs and preferences. The past five years have witnessed significant M&A activity, with an estimated xx Million EUR in deals completed between 2019 and 2024, reflecting industry consolidation and strategic expansion.
- Market Concentration: HHI estimated at xx (2024).
- Innovation Drivers: Development of mobile trading apps, algorithmic trading tools, and fractional share trading.
- Regulatory Impacts: DNB regulations on security, transparency, and client protection.
- Product Substitutes: Traditional brokerage services, direct investment in securities.
- End-User Segmentation: Retail investors, institutional investors.
- M&A Trends: High M&A activity, estimated at xx Million EUR (2019-2024).
Electronic Brokerage Market in Netherlands Market Trends & Opportunities
The Netherlands' electronic brokerage market is projected to experience robust growth, with a Compound Annual Growth Rate (CAGR) of xx% from 2025 to 2033. Market size is estimated to reach xx Million EUR in 2025, driven by increasing digital adoption among investors, rising smartphone penetration, and the growing popularity of online trading platforms. Technological advancements such as AI-powered trading tools and blockchain-based solutions are further accelerating market expansion. Consumer preferences are shifting towards user-friendly platforms with advanced charting tools, educational resources, and competitive pricing. Intense competitive pressures are pushing companies to innovate and enhance their service offerings, creating numerous opportunities for market entrants and established players. Market penetration rates are expected to increase steadily, with a projected xx% of the adult population using online brokerage services by 2033.
Dominant Markets & Segments in Electronic Brokerage Market in Netherlands
The Dutch electronic brokerage market is dominated by the retail investor segment, fueled by increasing financial literacy and the desire for independent investment management. Key growth drivers include:
- Technological Advancements: Mobile trading apps, user-friendly platforms.
- Government Initiatives: Regulatory support for fintech innovation.
- Economic Factors: Low interest rates, seeking higher returns on investments.
The dominance of the retail segment is attributed to the ease of access, lower commission fees, and diversified investment options offered by electronic brokerage platforms. The increasing use of mobile trading apps has further propelled the growth of this segment, making it more convenient and accessible for investors.
Electronic Brokerage Market in Netherlands Product Analysis
The market offers a wide array of products, including online trading platforms with advanced charting tools, research reports, educational resources, and a range of investment products such as stocks, ETFs, options, and futures. Recent innovations focus on AI-powered trading assistants, personalized investment advice, and fractional share trading to cater to diverse investor needs. Competitive advantages stem from superior technology, user experience, pricing strategies, and customer service. The market's success hinges on a strong user-friendly interface, competitive fees, regulatory compliance, and a reliable trading infrastructure.
Key Drivers, Barriers & Challenges in Electronic Brokerage Market in Netherlands
Key Drivers:
- Increased digital literacy and adoption of technology among investors.
- Growing popularity of online and mobile trading platforms.
- Competitive pricing and innovative offerings by brokerage firms.
- Government initiatives to promote financial inclusion and digitalization.
Challenges:
- Stringent regulatory compliance requirements.
- Concerns related to cybersecurity and data privacy.
- Intense competition among established and emerging players.
- Fluctuations in the global financial markets can impact investor sentiment.
Growth Drivers in the Electronic Brokerage Market in Netherlands Market
The market is propelled by growing digital literacy, the rising adoption of mobile trading apps, increasing demand for diversified investment options, and supportive government policies fostering financial technology innovation. Competitive pricing strategies, coupled with innovative product offerings, also stimulate market growth.
Challenges Impacting Electronic Brokerage Market in Netherlands Growth
Key challenges include regulatory compliance, cybersecurity concerns, and intense competition among numerous players. Maintaining investor trust while managing security risks is crucial. Market volatility can also significantly impact investor confidence and trading activity.
Key Players Shaping the Electronic Brokerage Market in Netherlands Market
- Interactive Brokers
- Degiro
- XTB S A
- Saxo Bank
- eToro
- Euronext Group
- LYNX
- IC Markets
- RoboForex
- FP Markets
Significant Electronic Brokerage Market in Netherlands Industry Milestones
- September 2022: Scalable Capital expands into the Netherlands, offering ETFs, stocks, cryptocurrencies, and mutual funds.
- 2020: Flatex acquires 100% of DEGIRO for a total consideration of EUR 36.4 Million in cash and 7.5 Million new flatex shares.
Future Outlook for Electronic Brokerage Market in Netherlands Market
The Netherlands' electronic brokerage market is poised for continued expansion, driven by technological innovations, favorable regulatory environments, and increasing investor participation. Strategic partnerships, mergers and acquisitions, and the development of niche investment products will shape the market's future trajectory, presenting lucrative opportunities for both established and emerging players.
Electronic Brokerage Market in Netherlands Segmentation
-
1. Investor Type
- 1.1. Retail
- 1.2. Institutional
-
2. Services Provided
- 2.1. Full Time Brokers
- 2.2. Discount Brokers
-
3. Operation
- 3.1. Domestic
- 3.2. International
Electronic Brokerage Market in Netherlands Segmentation By Geography
-
1. North America
- 1.1. United States
- 1.2. Canada
- 1.3. Mexico
-
2. South America
- 2.1. Brazil
- 2.2. Argentina
- 2.3. Rest of South America
-
3. Europe
- 3.1. United Kingdom
- 3.2. Germany
- 3.3. France
- 3.4. Italy
- 3.5. Spain
- 3.6. Russia
- 3.7. Benelux
- 3.8. Nordics
- 3.9. Rest of Europe
-
4. Middle East & Africa
- 4.1. Turkey
- 4.2. Israel
- 4.3. GCC
- 4.4. North Africa
- 4.5. South Africa
- 4.6. Rest of Middle East & Africa
-
5. Asia Pacific
- 5.1. China
- 5.2. India
- 5.3. Japan
- 5.4. South Korea
- 5.5. ASEAN
- 5.6. Oceania
- 5.7. Rest of Asia Pacific
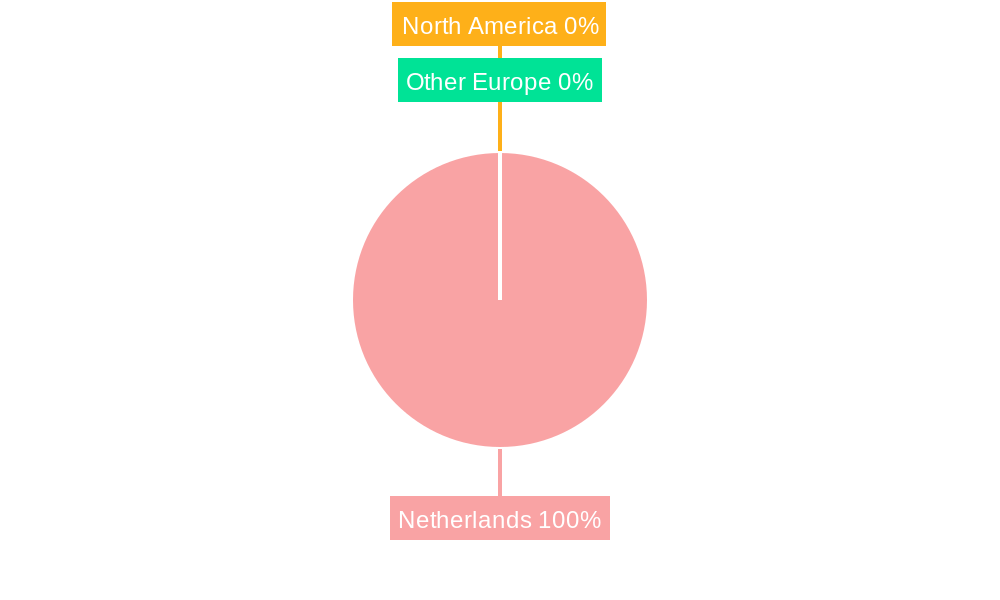
Electronic Brokerage Market in Netherlands Regional Market Share
Geographic Coverage of Electronic Brokerage Market in Netherlands
Electronic Brokerage Market in Netherlands REPORT HIGHLIGHTS
| Aspects | Details |
|---|---|
| Study Period | 2020-2034 |
| Base Year | 2025 |
| Estimated Year | 2026 |
| Forecast Period | 2026-2034 |
| Historical Period | 2020-2025 |
| Growth Rate | CAGR of 7.3% from 2020-2034 |
| Segmentation |
|
Table of Contents
- 1. Introduction
- 1.1. Research Scope
- 1.2. Market Segmentation
- 1.3. Research Objective
- 1.4. Definitions and Assumptions
- 2. Executive Summary
- 2.1. Market Snapshot
- 3. Market Dynamics
- 3.1. Market Drivers
- 3.2. Market Restrains
- 3.3. Market Trends
- 3.4. Market Opportunities
- 4. Market Factor Analysis
- 4.1. Porters Five Forces
- 4.1.1. Bargaining Power of Suppliers
- 4.1.2. Bargaining Power of Buyers
- 4.1.3. Threat of New Entrants
- 4.1.4. Threat of Substitutes
- 4.1.5. Competitive Rivalry
- 4.2. PESTEL analysis
- 4.3. BCG Analysis
- 4.3.1. Stars (High Growth, High Market Share)
- 4.3.2. Cash Cows (Low Growth, High Market Share)
- 4.3.3. Question Mark (High Growth, Low Market Share)
- 4.3.4. Dogs (Low Growth, Low Market Share)
- 4.4. Ansoff Matrix Analysis
- 4.5. Supply Chain Analysis
- 4.6. Regulatory Landscape
- 4.7. Current Market Potential and Opportunity Assessment (TAM–SAM–SOM Framework)
- 4.8. TIR Analyst Note
- 4.1. Porters Five Forces
- 5. Market Analysis, Insights and Forecast 2021-2033
- 5.1. Market Analysis, Insights and Forecast - by Investor Type
- 5.1.1. Retail
- 5.1.2. Institutional
- 5.2. Market Analysis, Insights and Forecast - by Services Provided
- 5.2.1. Full Time Brokers
- 5.2.2. Discount Brokers
- 5.3. Market Analysis, Insights and Forecast - by Operation
- 5.3.1. Domestic
- 5.3.2. International
- 5.4. Market Analysis, Insights and Forecast - by Region
- 5.4.1. North America
- 5.4.2. South America
- 5.4.3. Europe
- 5.4.4. Middle East & Africa
- 5.4.5. Asia Pacific
- 5.1. Market Analysis, Insights and Forecast - by Investor Type
- 6. Global Electronic Brokerage Market in Netherlands Analysis, Insights and Forecast, 2021-2033
- 6.1. Market Analysis, Insights and Forecast - by Investor Type
- 6.1.1. Retail
- 6.1.2. Institutional
- 6.2. Market Analysis, Insights and Forecast - by Services Provided
- 6.2.1. Full Time Brokers
- 6.2.2. Discount Brokers
- 6.3. Market Analysis, Insights and Forecast - by Operation
- 6.3.1. Domestic
- 6.3.2. International
- 6.1. Market Analysis, Insights and Forecast - by Investor Type
- 7. North America Electronic Brokerage Market in Netherlands Analysis, Insights and Forecast, 2020-2032
- 7.1. Market Analysis, Insights and Forecast - by Investor Type
- 7.1.1. Retail
- 7.1.2. Institutional
- 7.2. Market Analysis, Insights and Forecast - by Services Provided
- 7.2.1. Full Time Brokers
- 7.2.2. Discount Brokers
- 7.3. Market Analysis, Insights and Forecast - by Operation
- 7.3.1. Domestic
- 7.3.2. International
- 7.1. Market Analysis, Insights and Forecast - by Investor Type
- 8. South America Electronic Brokerage Market in Netherlands Analysis, Insights and Forecast, 2020-2032
- 8.1. Market Analysis, Insights and Forecast - by Investor Type
- 8.1.1. Retail
- 8.1.2. Institutional
- 8.2. Market Analysis, Insights and Forecast - by Services Provided
- 8.2.1. Full Time Brokers
- 8.2.2. Discount Brokers
- 8.3. Market Analysis, Insights and Forecast - by Operation
- 8.3.1. Domestic
- 8.3.2. International
- 8.1. Market Analysis, Insights and Forecast - by Investor Type
- 9. Europe Electronic Brokerage Market in Netherlands Analysis, Insights and Forecast, 2020-2032
- 9.1. Market Analysis, Insights and Forecast - by Investor Type
- 9.1.1. Retail
- 9.1.2. Institutional
- 9.2. Market Analysis, Insights and Forecast - by Services Provided
- 9.2.1. Full Time Brokers
- 9.2.2. Discount Brokers
- 9.3. Market Analysis, Insights and Forecast - by Operation
- 9.3.1. Domestic
- 9.3.2. International
- 9.1. Market Analysis, Insights and Forecast - by Investor Type
- 10. Middle East & Africa Electronic Brokerage Market in Netherlands Analysis, Insights and Forecast, 2020-2032
- 10.1. Market Analysis, Insights and Forecast - by Investor Type
- 10.1.1. Retail
- 10.1.2. Institutional
- 10.2. Market Analysis, Insights and Forecast - by Services Provided
- 10.2.1. Full Time Brokers
- 10.2.2. Discount Brokers
- 10.3. Market Analysis, Insights and Forecast - by Operation
- 10.3.1. Domestic
- 10.3.2. International
- 10.1. Market Analysis, Insights and Forecast - by Investor Type
- 11. Asia Pacific Electronic Brokerage Market in Netherlands Analysis, Insights and Forecast, 2020-2032
- 11.1. Market Analysis, Insights and Forecast - by Investor Type
- 11.1.1. Retail
- 11.1.2. Institutional
- 11.2. Market Analysis, Insights and Forecast - by Services Provided
- 11.2.1. Full Time Brokers
- 11.2.2. Discount Brokers
- 11.3. Market Analysis, Insights and Forecast - by Operation
- 11.3.1. Domestic
- 11.3.2. International
- 11.1. Market Analysis, Insights and Forecast - by Investor Type
- 12. Competitive Analysis
- 12.1. Company Profiles
- 12.1.1 Interactive Brokers
- 12.1.1.1. Company Overview
- 12.1.1.2. Products
- 12.1.1.3. Company Financials
- 12.1.1.4. SWOT Analysis
- 12.1.2 Degiro
- 12.1.2.1. Company Overview
- 12.1.2.2. Products
- 12.1.2.3. Company Financials
- 12.1.2.4. SWOT Analysis
- 12.1.3 XTB S A
- 12.1.3.1. Company Overview
- 12.1.3.2. Products
- 12.1.3.3. Company Financials
- 12.1.3.4. SWOT Analysis
- 12.1.4 Saxo bank
- 12.1.4.1. Company Overview
- 12.1.4.2. Products
- 12.1.4.3. Company Financials
- 12.1.4.4. SWOT Analysis
- 12.1.5 eToro
- 12.1.5.1. Company Overview
- 12.1.5.2. Products
- 12.1.5.3. Company Financials
- 12.1.5.4. SWOT Analysis
- 12.1.6 Euronext Group
- 12.1.6.1. Company Overview
- 12.1.6.2. Products
- 12.1.6.3. Company Financials
- 12.1.6.4. SWOT Analysis
- 12.1.7 LYNX
- 12.1.7.1. Company Overview
- 12.1.7.2. Products
- 12.1.7.3. Company Financials
- 12.1.7.4. SWOT Analysis
- 12.1.8 IC Markets
- 12.1.8.1. Company Overview
- 12.1.8.2. Products
- 12.1.8.3. Company Financials
- 12.1.8.4. SWOT Analysis
- 12.1.9 RoboForex
- 12.1.9.1. Company Overview
- 12.1.9.2. Products
- 12.1.9.3. Company Financials
- 12.1.9.4. SWOT Analysis
- 12.1.10 FP Markets**List Not Exhaustive
- 12.1.10.1. Company Overview
- 12.1.10.2. Products
- 12.1.10.3. Company Financials
- 12.1.10.4. SWOT Analysis
- 12.1.1 Interactive Brokers
- 12.2. Market Entropy
- 12.2.1 Company's Key Areas Served
- 12.2.2 Recent Developments
- 12.3. Company Market Share Analysis 2025
- 12.3.1 Top 5 Companies Market Share Analysis
- 12.3.2 Top 3 Companies Market Share Analysis
- 12.4. List of Potential Customers
- 13. Research Methodology
List of Figures
- Figure 1: Global Electronic Brokerage Market in Netherlands Revenue Breakdown (billion, %) by Region 2025 & 2033
- Figure 2: North America Electronic Brokerage Market in Netherlands Revenue (billion), by Investor Type 2025 & 2033
- Figure 3: North America Electronic Brokerage Market in Netherlands Revenue Share (%), by Investor Type 2025 & 2033
- Figure 4: North America Electronic Brokerage Market in Netherlands Revenue (billion), by Services Provided 2025 & 2033
- Figure 5: North America Electronic Brokerage Market in Netherlands Revenue Share (%), by Services Provided 2025 & 2033
- Figure 6: North America Electronic Brokerage Market in Netherlands Revenue (billion), by Operation 2025 & 2033
- Figure 7: North America Electronic Brokerage Market in Netherlands Revenue Share (%), by Operation 2025 & 2033
- Figure 8: North America Electronic Brokerage Market in Netherlands Revenue (billion), by Country 2025 & 2033
- Figure 9: North America Electronic Brokerage Market in Netherlands Revenue Share (%), by Country 2025 & 2033
- Figure 10: South America Electronic Brokerage Market in Netherlands Revenue (billion), by Investor Type 2025 & 2033
- Figure 11: South America Electronic Brokerage Market in Netherlands Revenue Share (%), by Investor Type 2025 & 2033
- Figure 12: South America Electronic Brokerage Market in Netherlands Revenue (billion), by Services Provided 2025 & 2033
- Figure 13: South America Electronic Brokerage Market in Netherlands Revenue Share (%), by Services Provided 2025 & 2033
- Figure 14: South America Electronic Brokerage Market in Netherlands Revenue (billion), by Operation 2025 & 2033
- Figure 15: South America Electronic Brokerage Market in Netherlands Revenue Share (%), by Operation 2025 & 2033
- Figure 16: South America Electronic Brokerage Market in Netherlands Revenue (billion), by Country 2025 & 2033
- Figure 17: South America Electronic Brokerage Market in Netherlands Revenue Share (%), by Country 2025 & 2033
- Figure 18: Europe Electronic Brokerage Market in Netherlands Revenue (billion), by Investor Type 2025 & 2033
- Figure 19: Europe Electronic Brokerage Market in Netherlands Revenue Share (%), by Investor Type 2025 & 2033
- Figure 20: Europe Electronic Brokerage Market in Netherlands Revenue (billion), by Services Provided 2025 & 2033
- Figure 21: Europe Electronic Brokerage Market in Netherlands Revenue Share (%), by Services Provided 2025 & 2033
- Figure 22: Europe Electronic Brokerage Market in Netherlands Revenue (billion), by Operation 2025 & 2033
- Figure 23: Europe Electronic Brokerage Market in Netherlands Revenue Share (%), by Operation 2025 & 2033
- Figure 24: Europe Electronic Brokerage Market in Netherlands Revenue (billion), by Country 2025 & 2033
- Figure 25: Europe Electronic Brokerage Market in Netherlands Revenue Share (%), by Country 2025 & 2033
- Figure 26: Middle East & Africa Electronic Brokerage Market in Netherlands Revenue (billion), by Investor Type 2025 & 2033
- Figure 27: Middle East & Africa Electronic Brokerage Market in Netherlands Revenue Share (%), by Investor Type 2025 & 2033
- Figure 28: Middle East & Africa Electronic Brokerage Market in Netherlands Revenue (billion), by Services Provided 2025 & 2033
- Figure 29: Middle East & Africa Electronic Brokerage Market in Netherlands Revenue Share (%), by Services Provided 2025 & 2033
- Figure 30: Middle East & Africa Electronic Brokerage Market in Netherlands Revenue (billion), by Operation 2025 & 2033
- Figure 31: Middle East & Africa Electronic Brokerage Market in Netherlands Revenue Share (%), by Operation 2025 & 2033
- Figure 32: Middle East & Africa Electronic Brokerage Market in Netherlands Revenue (billion), by Country 2025 & 2033
- Figure 33: Middle East & Africa Electronic Brokerage Market in Netherlands Revenue Share (%), by Country 2025 & 2033
- Figure 34: Asia Pacific Electronic Brokerage Market in Netherlands Revenue (billion), by Investor Type 2025 & 2033
- Figure 35: Asia Pacific Electronic Brokerage Market in Netherlands Revenue Share (%), by Investor Type 2025 & 2033
- Figure 36: Asia Pacific Electronic Brokerage Market in Netherlands Revenue (billion), by Services Provided 2025 & 2033
- Figure 37: Asia Pacific Electronic Brokerage Market in Netherlands Revenue Share (%), by Services Provided 2025 & 2033
- Figure 38: Asia Pacific Electronic Brokerage Market in Netherlands Revenue (billion), by Operation 2025 & 2033
- Figure 39: Asia Pacific Electronic Brokerage Market in Netherlands Revenue Share (%), by Operation 2025 & 2033
- Figure 40: Asia Pacific Electronic Brokerage Market in Netherlands Revenue (billion), by Country 2025 & 2033
- Figure 41: Asia Pacific Electronic Brokerage Market in Netherlands Revenue Share (%), by Country 2025 & 2033
List of Tables
- Table 1: Global Electronic Brokerage Market in Netherlands Revenue billion Forecast, by Investor Type 2020 & 2033
- Table 2: Global Electronic Brokerage Market in Netherlands Revenue billion Forecast, by Services Provided 2020 & 2033
- Table 3: Global Electronic Brokerage Market in Netherlands Revenue billion Forecast, by Operation 2020 & 2033
- Table 4: Global Electronic Brokerage Market in Netherlands Revenue billion Forecast, by Region 2020 & 2033
- Table 5: Global Electronic Brokerage Market in Netherlands Revenue billion Forecast, by Investor Type 2020 & 2033
- Table 6: Global Electronic Brokerage Market in Netherlands Revenue billion Forecast, by Services Provided 2020 & 2033
- Table 7: Global Electronic Brokerage Market in Netherlands Revenue billion Forecast, by Operation 2020 & 2033
- Table 8: Global Electronic Brokerage Market in Netherlands Revenue billion Forecast, by Country 2020 & 2033
- Table 9: United States Electronic Brokerage Market in Netherlands Revenue (billion) Forecast, by Application 2020 & 2033
- Table 10: Canada Electronic Brokerage Market in Netherlands Revenue (billion) Forecast, by Application 2020 & 2033
- Table 11: Mexico Electronic Brokerage Market in Netherlands Revenue (billion) Forecast, by Application 2020 & 2033
- Table 12: Global Electronic Brokerage Market in Netherlands Revenue billion Forecast, by Investor Type 2020 & 2033
- Table 13: Global Electronic Brokerage Market in Netherlands Revenue billion Forecast, by Services Provided 2020 & 2033
- Table 14: Global Electronic Brokerage Market in Netherlands Revenue billion Forecast, by Operation 2020 & 2033
- Table 15: Global Electronic Brokerage Market in Netherlands Revenue billion Forecast, by Country 2020 & 2033
- Table 16: Brazil Electronic Brokerage Market in Netherlands Revenue (billion) Forecast, by Application 2020 & 2033
- Table 17: Argentina Electronic Brokerage Market in Netherlands Revenue (billion) Forecast, by Application 2020 & 2033
- Table 18: Rest of South America Electronic Brokerage Market in Netherlands Revenue (billion) Forecast, by Application 2020 & 2033
- Table 19: Global Electronic Brokerage Market in Netherlands Revenue billion Forecast, by Investor Type 2020 & 2033
- Table 20: Global Electronic Brokerage Market in Netherlands Revenue billion Forecast, by Services Provided 2020 & 2033
- Table 21: Global Electronic Brokerage Market in Netherlands Revenue billion Forecast, by Operation 2020 & 2033
- Table 22: Global Electronic Brokerage Market in Netherlands Revenue billion Forecast, by Country 2020 & 2033
- Table 23: United Kingdom Electronic Brokerage Market in Netherlands Revenue (billion) Forecast, by Application 2020 & 2033
- Table 24: Germany Electronic Brokerage Market in Netherlands Revenue (billion) Forecast, by Application 2020 & 2033
- Table 25: France Electronic Brokerage Market in Netherlands Revenue (billion) Forecast, by Application 2020 & 2033
- Table 26: Italy Electronic Brokerage Market in Netherlands Revenue (billion) Forecast, by Application 2020 & 2033
- Table 27: Spain Electronic Brokerage Market in Netherlands Revenue (billion) Forecast, by Application 2020 & 2033
- Table 28: Russia Electronic Brokerage Market in Netherlands Revenue (billion) Forecast, by Application 2020 & 2033
- Table 29: Benelux Electronic Brokerage Market in Netherlands Revenue (billion) Forecast, by Application 2020 & 2033
- Table 30: Nordics Electronic Brokerage Market in Netherlands Revenue (billion) Forecast, by Application 2020 & 2033
- Table 31: Rest of Europe Electronic Brokerage Market in Netherlands Revenue (billion) Forecast, by Application 2020 & 2033
- Table 32: Global Electronic Brokerage Market in Netherlands Revenue billion Forecast, by Investor Type 2020 & 2033
- Table 33: Global Electronic Brokerage Market in Netherlands Revenue billion Forecast, by Services Provided 2020 & 2033
- Table 34: Global Electronic Brokerage Market in Netherlands Revenue billion Forecast, by Operation 2020 & 2033
- Table 35: Global Electronic Brokerage Market in Netherlands Revenue billion Forecast, by Country 2020 & 2033
- Table 36: Turkey Electronic Brokerage Market in Netherlands Revenue (billion) Forecast, by Application 2020 & 2033
- Table 37: Israel Electronic Brokerage Market in Netherlands Revenue (billion) Forecast, by Application 2020 & 2033
- Table 38: GCC Electronic Brokerage Market in Netherlands Revenue (billion) Forecast, by Application 2020 & 2033
- Table 39: North Africa Electronic Brokerage Market in Netherlands Revenue (billion) Forecast, by Application 2020 & 2033
- Table 40: South Africa Electronic Brokerage Market in Netherlands Revenue (billion) Forecast, by Application 2020 & 2033
- Table 41: Rest of Middle East & Africa Electronic Brokerage Market in Netherlands Revenue (billion) Forecast, by Application 2020 & 2033
- Table 42: Global Electronic Brokerage Market in Netherlands Revenue billion Forecast, by Investor Type 2020 & 2033
- Table 43: Global Electronic Brokerage Market in Netherlands Revenue billion Forecast, by Services Provided 2020 & 2033
- Table 44: Global Electronic Brokerage Market in Netherlands Revenue billion Forecast, by Operation 2020 & 2033
- Table 45: Global Electronic Brokerage Market in Netherlands Revenue billion Forecast, by Country 2020 & 2033
- Table 46: China Electronic Brokerage Market in Netherlands Revenue (billion) Forecast, by Application 2020 & 2033
- Table 47: India Electronic Brokerage Market in Netherlands Revenue (billion) Forecast, by Application 2020 & 2033
- Table 48: Japan Electronic Brokerage Market in Netherlands Revenue (billion) Forecast, by Application 2020 & 2033
- Table 49: South Korea Electronic Brokerage Market in Netherlands Revenue (billion) Forecast, by Application 2020 & 2033
- Table 50: ASEAN Electronic Brokerage Market in Netherlands Revenue (billion) Forecast, by Application 2020 & 2033
- Table 51: Oceania Electronic Brokerage Market in Netherlands Revenue (billion) Forecast, by Application 2020 & 2033
- Table 52: Rest of Asia Pacific Electronic Brokerage Market in Netherlands Revenue (billion) Forecast, by Application 2020 & 2033
Frequently Asked Questions
1. What is the projected Compound Annual Growth Rate (CAGR) of the Electronic Brokerage Market in Netherlands?
The projected CAGR is approximately 7.3%.
2. Which companies are prominent players in the Electronic Brokerage Market in Netherlands?
Key companies in the market include Interactive Brokers, Degiro, XTB S A, Saxo bank, eToro, Euronext Group, LYNX, IC Markets, RoboForex, FP Markets**List Not Exhaustive.
3. What are the main segments of the Electronic Brokerage Market in Netherlands?
The market segments include Investor Type, Services Provided, Operation.
4. Can you provide details about the market size?
The market size is estimated to be USD 1.12 billion as of 2022.
5. What are some drivers contributing to market growth?
N/A
6. What are the notable trends driving market growth?
Growing Investing Household Signifying Rising E-Brokerage in Netherlands.
7. Are there any restraints impacting market growth?
N/A
8. Can you provide examples of recent developments in the market?
In September 2022, the leading European digital invetment platform, Scalable Capital expanded its presence in the Netherlands. Its subsidiaries Scalable Crypto and Scalable Broker are providing cost-effective and convenient trading and saving plans for Dutch retail clients with products like exchange traded funds (ETFs), stocks, cryptocurrencies, and mutual funds.
9. What pricing options are available for accessing the report?
Pricing options include single-user, multi-user, and enterprise licenses priced at USD 3800, USD 4500, and USD 5800 respectively.
10. Is the market size provided in terms of value or volume?
The market size is provided in terms of value, measured in billion.
11. Are there any specific market keywords associated with the report?
Yes, the market keyword associated with the report is "Electronic Brokerage Market in Netherlands," which aids in identifying and referencing the specific market segment covered.
12. How do I determine which pricing option suits my needs best?
The pricing options vary based on user requirements and access needs. Individual users may opt for single-user licenses, while businesses requiring broader access may choose multi-user or enterprise licenses for cost-effective access to the report.
13. Are there any additional resources or data provided in the Electronic Brokerage Market in Netherlands report?
While the report offers comprehensive insights, it's advisable to review the specific contents or supplementary materials provided to ascertain if additional resources or data are available.
14. How can I stay updated on further developments or reports in the Electronic Brokerage Market in Netherlands?
To stay informed about further developments, trends, and reports in the Electronic Brokerage Market in Netherlands, consider subscribing to industry newsletters, following relevant companies and organizations, or regularly checking reputable industry news sources and publications.
Methodology
Step 1 - Identification of Relevant Samples Size from Population Database


Step 2 - Approaches for Defining Global Market Size (Value, Volume* & Price*)

Note*: In applicable scenarios
Step 3 - Data Sources
Primary Research
- Web Analytics
- Survey Reports
- Research Institute
- Latest Research Reports
- Opinion Leaders
Secondary Research
- Annual Reports
- White Paper
- Latest Press Release
- Industry Association
- Paid Database
- Investor Presentations

Step 4 - Data Triangulation
Involves using different sources of information in order to increase the validity of a study
These sources are likely to be stakeholders in a program - participants, other researchers, program staff, other community members, and so on.
Then we put all data in single framework & apply various statistical tools to find out the dynamic on the market.
During the analysis stage, feedback from the stakeholder groups would be compared to determine areas of agreement as well as areas of divergence