

Key Insights
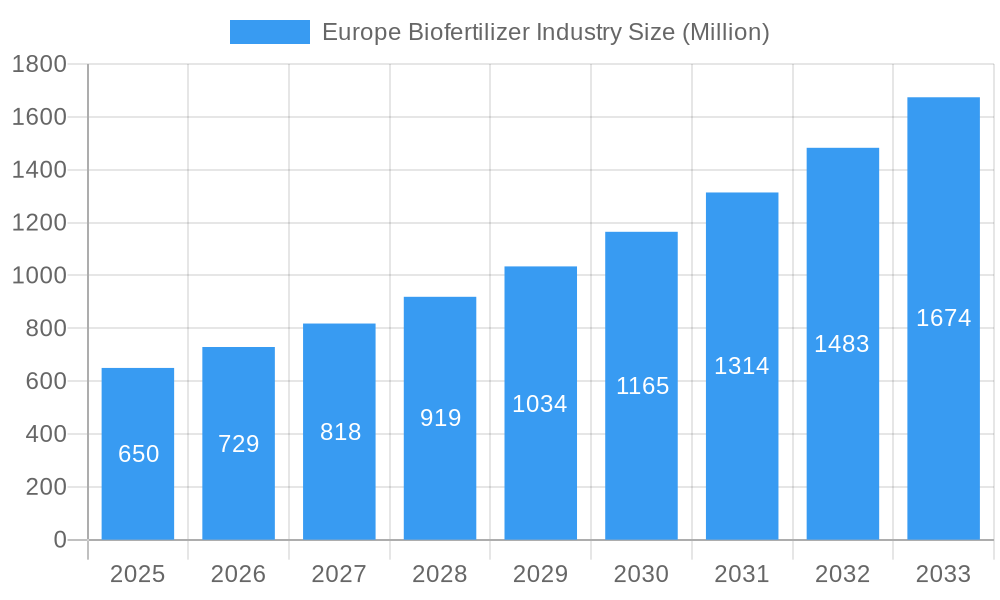
The European biofertilizer market, valued at €650 million in 2025, is experiencing robust growth, projected to reach €1.6 billion by 2033, exhibiting a Compound Annual Growth Rate (CAGR) of 12.1%. This expansion is driven by the increasing awareness of sustainable agriculture practices among European farmers, coupled with stringent regulations on synthetic fertilizers aimed at mitigating environmental damage. The rising demand for organic and pesticide-free food products further fuels the market's trajectory. Key application segments include soil treatment and seed treatment, with grains and cereals dominating crop type demand. Carrier-enriched and liquid biofertilizers represent significant technological advancements contributing to the market's growth. Within the microbial segment, Rhizobium, Azospirillum, and Phosphate Solubilizing Bacteria are leading the charge due to their proven efficacy in improving crop yields and soil health. Germany, France, and the United Kingdom are major contributors to the European market, with growing adoption across other nations in the region driving overall expansion.
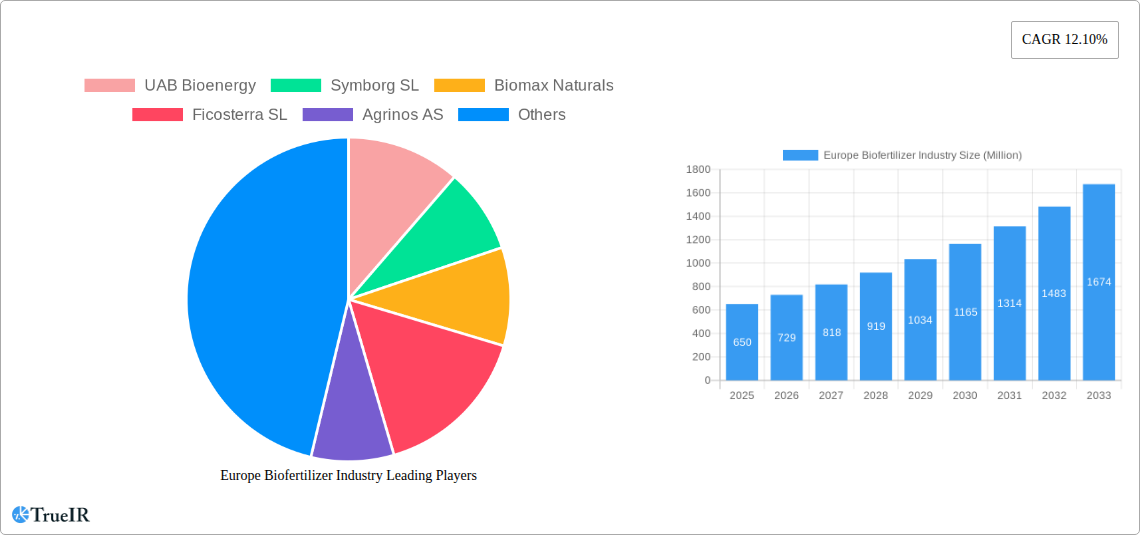
Europe Biofertilizer Industry Market Size (In Million)
The market's growth is not without challenges. High initial investment costs associated with biofertilizer adoption, along with a lack of awareness among certain farming communities, pose notable restraints. However, ongoing research and development focused on improving biofertilizer efficacy and reducing costs, alongside supportive government policies and initiatives promoting sustainable agriculture, are expected to alleviate these constraints in the coming years. The competitive landscape is characterized by a mix of established players and emerging companies, indicating a dynamic and innovative market. The continued development of specialized biofertilizers tailored to specific crop types and regional conditions will be critical to capturing the considerable growth opportunities within this sector. The focus on precision agriculture and data-driven insights will also play a key role in maximizing the impact of biofertilizers and ensuring sustainable agricultural practices across Europe.
Europe Biofertilizer Industry Company Market Share
Europe Biofertilizer Industry: A Comprehensive Market Report (2019-2033)
This dynamic report provides a detailed analysis of the Europe biofertilizer industry, offering invaluable insights for investors, industry professionals, and strategic decision-makers. We delve into market structure, competitive dynamics, growth drivers, challenges, and future outlook, leveraging extensive data and analysis from 2019 to 2033 (forecast period: 2025-2033; base year: 2025; estimated year: 2025; historical period: 2019-2024). The report uses high-volume keywords to ensure optimal search engine visibility and covers key segments including application, crop type, technology, and microorganism.
Europe Biofertilizer Industry Market Structure & Competitive Landscape
The European biofertilizer market is characterized by a moderately concentrated structure, with a few major players and numerous smaller niche operators. The Herfindahl-Hirschman Index (HHI) for 2024 is estimated at xx, indicating a moderately competitive landscape. Innovation is a key driver, fueled by the increasing demand for sustainable agricultural practices and the development of novel biofertilizer technologies. Regulatory frameworks, particularly those related to environmental protection and product registration, significantly impact market dynamics. Product substitutes, such as conventional chemical fertilizers, pose a competitive challenge, though the growing awareness of environmental concerns and the benefits of biofertilizers are mitigating this pressure. End-user segmentation is primarily driven by farm size and crop type, with large-scale commercial farms representing a significant portion of the market. M&A activity in the sector has been moderate, with approximately xx Million in deals closed between 2019 and 2024.
- Market Concentration: HHI estimated at xx in 2024.
- Innovation Drivers: Demand for sustainable agriculture, technological advancements in biofertilizer production.
- Regulatory Impacts: Stringent environmental regulations influence product development and market access.
- Product Substitutes: Competition from conventional chemical fertilizers.
- End-User Segmentation: Large-scale commercial farms dominate the market.
- M&A Trends: Approximately xx Million in M&A activity (2019-2024).
Europe Biofertilizer Industry Market Trends & Opportunities
The European biofertilizer market is experiencing robust growth, with a projected Compound Annual Growth Rate (CAGR) of xx% from 2025 to 2033. Market size is estimated at xx Million in 2025 and is expected to reach xx Million by 2033. This growth is driven by several factors, including increasing consumer demand for organically produced food, stringent environmental regulations promoting sustainable agriculture, and the rising awareness of the benefits of biofertilizers in enhancing soil health, crop yields, and reducing the reliance on synthetic fertilizers. Technological advancements, such as the development of more efficient biofertilizer formulations and application methods, are further accelerating market expansion. The market penetration rate for biofertilizers in Europe is currently estimated at xx%, with significant potential for further growth. Competitive dynamics are shaped by both established players and emerging companies, leading to innovation and diversification of product offerings.
Dominant Markets & Segments in Europe Biofertilizer Industry
The German market is expected to be the largest within Europe in the biofertilizer market, followed by France and the UK. Growth is driven by strong government support for sustainable agriculture, coupled with a significant agricultural sector.
- Leading Regions: Germany, France, UK.
- Dominant Application: Soil treatment holds the largest market share, followed by seed treatment.
- Key Crop Types: Grains and cereals, pulses and oilseeds, and fruits and vegetables are the major crop types employing biofertilizers.
- Leading Technologies: Liquid biofertilizers and carrier-enriched biofertilizers hold a significant market share.
- Most Used Microorganisms: Rhizobium, Phosphate Solubilizing Bacteria, and Mycorrhiza are widely utilized.
- Growth Drivers: Strong government support for sustainable agriculture, increasing consumer demand for organic produce, and favorable climatic conditions in several regions.
Europe Biofertilizer Industry Product Analysis
The European biofertilizer market showcases a diverse range of products based on different microorganisms, formulations (liquid, granular, etc.), and delivery methods. Recent innovations focus on enhancing the efficacy and shelf-life of biofertilizers through advanced formulation techniques and the incorporation of carrier materials for better soil application and distribution. The competitive advantage hinges on factors such as product efficacy, cost-effectiveness, ease of application, and environmental impact.
Key Drivers, Barriers & Challenges in Europe Biofertilizer Industry
Key Drivers:
- Growing awareness of sustainable agriculture practices.
- Increasing demand for organic food products.
- Stringent environmental regulations promoting biofertilizers.
- Technological advancements in biofertilizer formulation and application.
Challenges and Restraints:
- High initial investment costs associated with biofertilizer adoption.
- Inconsistent efficacy of biofertilizers compared to chemical fertilizers.
- Lack of awareness among farmers regarding the benefits of biofertilizers.
- Complex regulatory frameworks and approval processes for new biofertilizer products.
Growth Drivers in the Europe Biofertilizer Industry Market
The market is propelled by the rising consumer preference for organic produce, strengthened by stringent environmental regulations incentivizing sustainable farming methods. Technological breakthroughs enhancing biofertilizer efficacy and application further fuel growth. Government subsidies and supportive policies significantly encourage adoption.
Challenges Impacting Europe Biofertilizer Industry Growth
High initial investment costs and inconsistent efficacy against conventional fertilizers hinder widespread adoption. Regulatory complexities and farmer awareness gaps create additional challenges. Competition from established chemical fertilizer players also presents a significant restraint.
Key Players Shaping the Europe Biofertilizer Industry Market
- UAB Bioenergy
- Symborg SL
- Biomax Naturals
- Ficosterra SL
- Agrinos AS
- Rizobacter Argentina S
- Biocorrection AS
- ASB Greenworld
Significant Europe Biofertilizer Industry Industry Milestones
- March 2021: Symborg Corporate SL opened a new manufacturing facility in Spain, boosting biofertilizer production capacity.
- July 2021: Symborg Corporate SL signed a distribution agreement with Corteva Agrisciences, expanding market reach for its BlueN biofertilizers across the EU.
- June 2022: Novozymes A/S and AgroFresh partnered to develop biological solutions, signifying increased industry collaboration and innovation in post-harvest technologies.
Future Outlook for Europe Biofertilizer Industry Market
The European biofertilizer market is poised for significant growth, driven by supportive policies, rising consumer demand, and technological advancements. Strategic partnerships and investments in research and development will further shape market dynamics. The market's potential is considerable, with opportunities for innovation and expansion across diverse segments and applications.
Europe Biofertilizer Industry Segmentation
- 1. Production Analysis
- 2. Consumption Analysis
- 3. Import Market Analysis (Value & Volume)
- 4. Export Market Analysis (Value & Volume)
- 5. Price Trend Analysis
Europe Biofertilizer Industry Segmentation By Geography
-
1. Europe
- 1.1. United Kingdom
- 1.2. Germany
- 1.3. France
- 1.4. Italy
- 1.5. Spain
- 1.6. Netherlands
- 1.7. Belgium
- 1.8. Sweden
- 1.9. Norway
- 1.10. Poland
- 1.11. Denmark
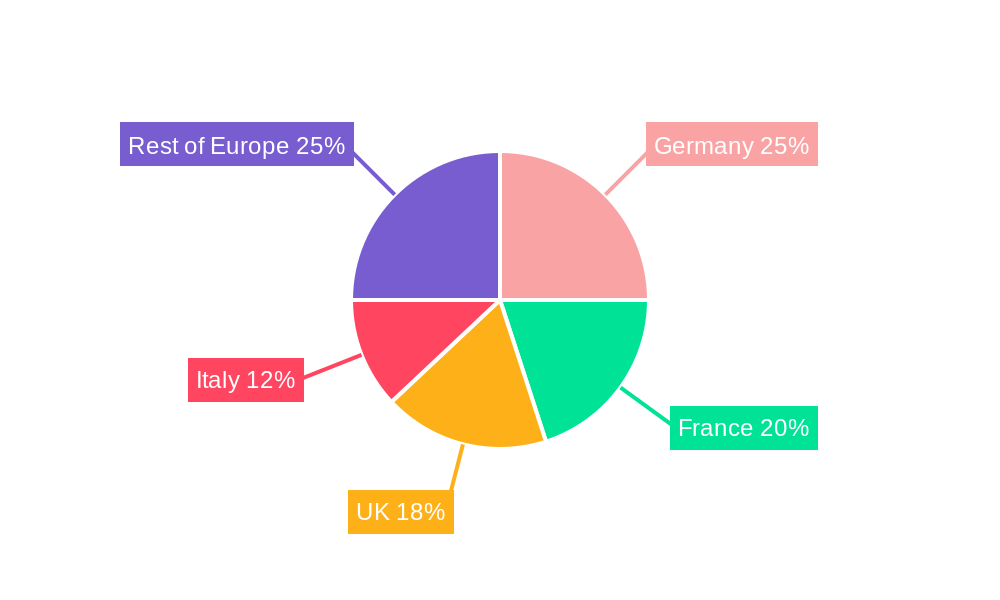
Europe Biofertilizer Industry Regional Market Share
Geographic Coverage of Europe Biofertilizer Industry
Europe Biofertilizer Industry REPORT HIGHLIGHTS
| Aspects | Details |
|---|---|
| Study Period | 2020-2034 |
| Base Year | 2025 |
| Estimated Year | 2026 |
| Forecast Period | 2026-2034 |
| Historical Period | 2020-2025 |
| Growth Rate | CAGR of 12.10% from 2020-2034 |
| Segmentation |
|
Table of Contents
- 1. Introduction
- 1.1. Research Scope
- 1.2. Market Segmentation
- 1.3. Research Methodology
- 1.4. Definitions and Assumptions
- 2. Executive Summary
- 2.1. Introduction
- 3. Market Dynamics
- 3.1. Introduction
- 3.2. Market Drivers
- 3.2.1. Need for Custom Product Development; Use of CROs for Regulatory Services
- 3.3. Market Restrains
- 3.3.1. Data and Cyber Security Concerns; Lack of Experts and Professionals in this Industry
- 3.4. Market Trends
- 3.4.1. Adoption of Organic Farming Practice
- 4. Market Factor Analysis
- 4.1. Porters Five Forces
- 4.2. Supply/Value Chain
- 4.3. PESTEL analysis
- 4.4. Market Entropy
- 4.5. Patent/Trademark Analysis
- 5. Europe Biofertilizer Industry Analysis, Insights and Forecast, 2020-2032
- 5.1. Market Analysis, Insights and Forecast - by Production Analysis
- 5.2. Market Analysis, Insights and Forecast - by Consumption Analysis
- 5.3. Market Analysis, Insights and Forecast - by Import Market Analysis (Value & Volume)
- 5.4. Market Analysis, Insights and Forecast - by Export Market Analysis (Value & Volume)
- 5.5. Market Analysis, Insights and Forecast - by Price Trend Analysis
- 5.6. Market Analysis, Insights and Forecast - by Region
- 5.6.1. Europe
- 5.1. Market Analysis, Insights and Forecast - by Production Analysis
- 6. Competitive Analysis
- 6.1. Market Share Analysis 2025
- 6.2. Company Profiles
- 6.2.1 UAB Bioenergy
- 6.2.1.1. Overview
- 6.2.1.2. Products
- 6.2.1.3. SWOT Analysis
- 6.2.1.4. Recent Developments
- 6.2.1.5. Financials (Based on Availability)
- 6.2.2 Symborg SL
- 6.2.2.1. Overview
- 6.2.2.2. Products
- 6.2.2.3. SWOT Analysis
- 6.2.2.4. Recent Developments
- 6.2.2.5. Financials (Based on Availability)
- 6.2.3 Biomax Naturals
- 6.2.3.1. Overview
- 6.2.3.2. Products
- 6.2.3.3. SWOT Analysis
- 6.2.3.4. Recent Developments
- 6.2.3.5. Financials (Based on Availability)
- 6.2.4 Ficosterra SL
- 6.2.4.1. Overview
- 6.2.4.2. Products
- 6.2.4.3. SWOT Analysis
- 6.2.4.4. Recent Developments
- 6.2.4.5. Financials (Based on Availability)
- 6.2.5 Agrinos AS
- 6.2.5.1. Overview
- 6.2.5.2. Products
- 6.2.5.3. SWOT Analysis
- 6.2.5.4. Recent Developments
- 6.2.5.5. Financials (Based on Availability)
- 6.2.6 Rizobacter Argentina S
- 6.2.6.1. Overview
- 6.2.6.2. Products
- 6.2.6.3. SWOT Analysis
- 6.2.6.4. Recent Developments
- 6.2.6.5. Financials (Based on Availability)
- 6.2.7 Biocorrection AS
- 6.2.7.1. Overview
- 6.2.7.2. Products
- 6.2.7.3. SWOT Analysis
- 6.2.7.4. Recent Developments
- 6.2.7.5. Financials (Based on Availability)
- 6.2.8 ASB Greenworld
- 6.2.8.1. Overview
- 6.2.8.2. Products
- 6.2.8.3. SWOT Analysis
- 6.2.8.4. Recent Developments
- 6.2.8.5. Financials (Based on Availability)
- 6.2.1 UAB Bioenergy
List of Figures
- Figure 1: Europe Biofertilizer Industry Revenue Breakdown (Million, %) by Product 2025 & 2033
- Figure 2: Europe Biofertilizer Industry Share (%) by Company 2025
List of Tables
- Table 1: Europe Biofertilizer Industry Revenue Million Forecast, by Production Analysis 2020 & 2033
- Table 2: Europe Biofertilizer Industry Revenue Million Forecast, by Consumption Analysis 2020 & 2033
- Table 3: Europe Biofertilizer Industry Revenue Million Forecast, by Import Market Analysis (Value & Volume) 2020 & 2033
- Table 4: Europe Biofertilizer Industry Revenue Million Forecast, by Export Market Analysis (Value & Volume) 2020 & 2033
- Table 5: Europe Biofertilizer Industry Revenue Million Forecast, by Price Trend Analysis 2020 & 2033
- Table 6: Europe Biofertilizer Industry Revenue Million Forecast, by Region 2020 & 2033
- Table 7: Europe Biofertilizer Industry Revenue Million Forecast, by Production Analysis 2020 & 2033
- Table 8: Europe Biofertilizer Industry Revenue Million Forecast, by Consumption Analysis 2020 & 2033
- Table 9: Europe Biofertilizer Industry Revenue Million Forecast, by Import Market Analysis (Value & Volume) 2020 & 2033
- Table 10: Europe Biofertilizer Industry Revenue Million Forecast, by Export Market Analysis (Value & Volume) 2020 & 2033
- Table 11: Europe Biofertilizer Industry Revenue Million Forecast, by Price Trend Analysis 2020 & 2033
- Table 12: Europe Biofertilizer Industry Revenue Million Forecast, by Country 2020 & 2033
- Table 13: United Kingdom Europe Biofertilizer Industry Revenue (Million) Forecast, by Application 2020 & 2033
- Table 14: Germany Europe Biofertilizer Industry Revenue (Million) Forecast, by Application 2020 & 2033
- Table 15: France Europe Biofertilizer Industry Revenue (Million) Forecast, by Application 2020 & 2033
- Table 16: Italy Europe Biofertilizer Industry Revenue (Million) Forecast, by Application 2020 & 2033
- Table 17: Spain Europe Biofertilizer Industry Revenue (Million) Forecast, by Application 2020 & 2033
- Table 18: Netherlands Europe Biofertilizer Industry Revenue (Million) Forecast, by Application 2020 & 2033
- Table 19: Belgium Europe Biofertilizer Industry Revenue (Million) Forecast, by Application 2020 & 2033
- Table 20: Sweden Europe Biofertilizer Industry Revenue (Million) Forecast, by Application 2020 & 2033
- Table 21: Norway Europe Biofertilizer Industry Revenue (Million) Forecast, by Application 2020 & 2033
- Table 22: Poland Europe Biofertilizer Industry Revenue (Million) Forecast, by Application 2020 & 2033
- Table 23: Denmark Europe Biofertilizer Industry Revenue (Million) Forecast, by Application 2020 & 2033
Frequently Asked Questions
1. What is the projected Compound Annual Growth Rate (CAGR) of the Europe Biofertilizer Industry?
The projected CAGR is approximately 12.10%.
2. Which companies are prominent players in the Europe Biofertilizer Industry?
Key companies in the market include UAB Bioenergy, Symborg SL, Biomax Naturals, Ficosterra SL, Agrinos AS, Rizobacter Argentina S, Biocorrection AS, ASB Greenworld.
3. What are the main segments of the Europe Biofertilizer Industry?
The market segments include Production Analysis, Consumption Analysis, Import Market Analysis (Value & Volume), Export Market Analysis (Value & Volume), Price Trend Analysis.
4. Can you provide details about the market size?
The market size is estimated to be USD 0.65 Million as of 2022.
5. What are some drivers contributing to market growth?
Need for Custom Product Development; Use of CROs for Regulatory Services.
6. What are the notable trends driving market growth?
Adoption of Organic Farming Practice.
7. Are there any restraints impacting market growth?
Data and Cyber Security Concerns; Lack of Experts and Professionals in this Industry.
8. Can you provide examples of recent developments in the market?
June 2022: Novozymes A/S and AgroFresh form a partnership to develop biological solutions and improve post-harvest food quality.
9. What pricing options are available for accessing the report?
Pricing options include single-user, multi-user, and enterprise licenses priced at USD 4750, USD 5250, and USD 8750 respectively.
10. Is the market size provided in terms of value or volume?
The market size is provided in terms of value, measured in Million.
11. Are there any specific market keywords associated with the report?
Yes, the market keyword associated with the report is "Europe Biofertilizer Industry," which aids in identifying and referencing the specific market segment covered.
12. How do I determine which pricing option suits my needs best?
The pricing options vary based on user requirements and access needs. Individual users may opt for single-user licenses, while businesses requiring broader access may choose multi-user or enterprise licenses for cost-effective access to the report.
13. Are there any additional resources or data provided in the Europe Biofertilizer Industry report?
While the report offers comprehensive insights, it's advisable to review the specific contents or supplementary materials provided to ascertain if additional resources or data are available.
14. How can I stay updated on further developments or reports in the Europe Biofertilizer Industry?
To stay informed about further developments, trends, and reports in the Europe Biofertilizer Industry, consider subscribing to industry newsletters, following relevant companies and organizations, or regularly checking reputable industry news sources and publications.
Methodology
Step 1 - Identification of Relevant Samples Size from Population Database


Step 2 - Approaches for Defining Global Market Size (Value, Volume* & Price*)

Note*: In applicable scenarios
Step 3 - Data Sources
Primary Research
- Web Analytics
- Survey Reports
- Research Institute
- Latest Research Reports
- Opinion Leaders
Secondary Research
- Annual Reports
- White Paper
- Latest Press Release
- Industry Association
- Paid Database
- Investor Presentations

Step 4 - Data Triangulation
Involves using different sources of information in order to increase the validity of a study
These sources are likely to be stakeholders in a program - participants, other researchers, program staff, other community members, and so on.
Then we put all data in single framework & apply various statistical tools to find out the dynamic on the market.
During the analysis stage, feedback from the stakeholder groups would be compared to determine areas of agreement as well as areas of divergence