

Key Insights
The European e-brokerage market is experiencing substantial growth, driven by increasing digital adoption and a burgeoning tech-savvy investor base. Factors such as enhanced internet and mobile penetration, coupled with the appeal of user-friendly online trading platforms offering diverse investment options, are fueling this expansion. The market is segmented to accommodate a wide spectrum of investors, from novices to experienced traders, providing services from basic stock transactions to complex derivatives. Leading players like Interactive Brokers, eToro, Plus500, and Saxo Bank are actively competing through commission structures, platform capabilities, educational support, and customer service. Evolving investor needs and regulatory shifts are continuously shaping platform development and security protocols. Maintaining trust and security, while embracing technological advancements, will be pivotal for sustained success.
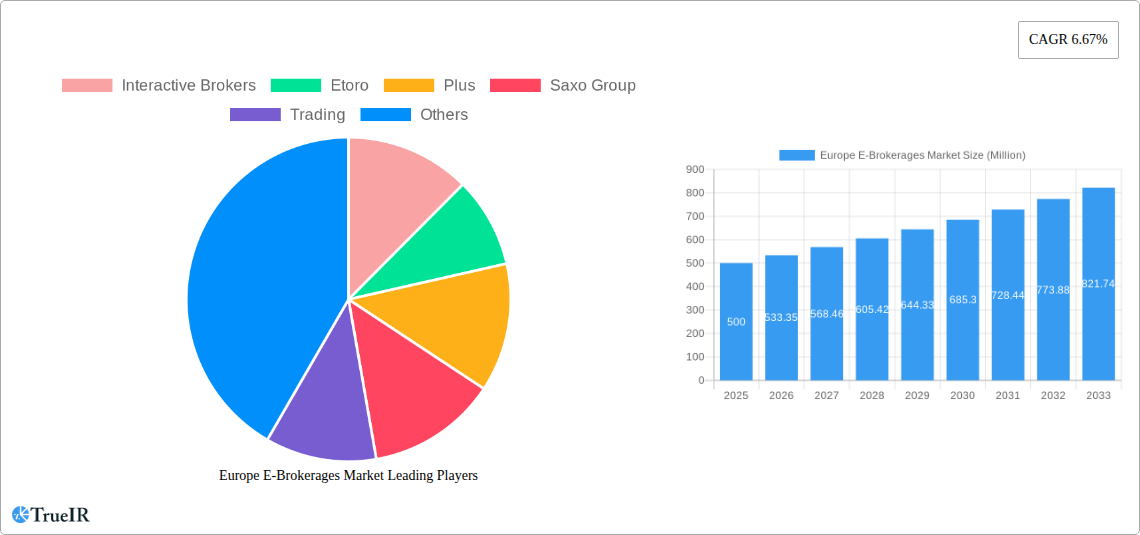
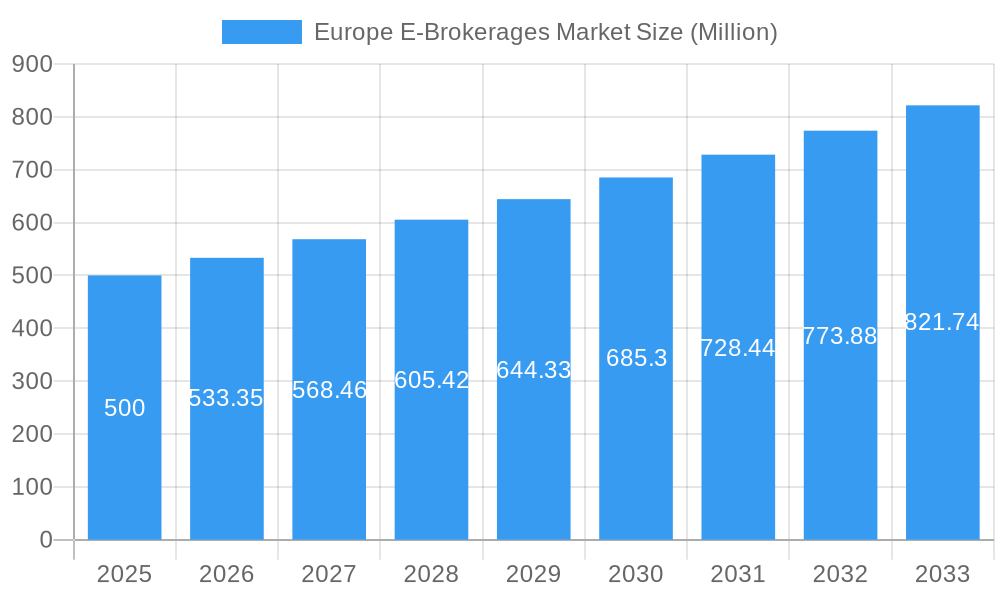
Europe E-Brokerages Market Market Size (In Billion)
Technological innovation, including AI-powered trading tools and personalized investment guidance, will significantly influence market expansion. The emergence of fintech startups offering novel solutions is expected to intensify competition. Challenges such as stringent regulatory compliance, cybersecurity risks, and inherent trading volatility may present restraints. Despite these, the persistent shift towards digital finance and growing financial literacy among younger demographics project a positive outlook. Strategic alliances, mergers, acquisitions, and market expansion will be key determinants of the industry's future competitive dynamics. With a projected Compound Annual Growth Rate (CAGR) of 9.4%, and a market size of €14.1 billion in the base year 2024, the market is set for significant advancement.
Europe E-Brokerages Market Company Market Share
Europe E-Brokerages Market: A Comprehensive Report (2019-2033)
This dynamic report provides an in-depth analysis of the Europe E-brokerages market, offering invaluable insights for investors, industry professionals, and strategic decision-makers. The study period spans 2019-2033, with a base year of 2025 and a forecast period of 2025-2033. Leveraging extensive data analysis and expert insights, this report unveils market size, growth trajectories, competitive dynamics, and future opportunities within this rapidly evolving sector. The report also considers the impact of recent key industry milestones. The estimated market value in 2025 is xx Million.
Europe E-Brokerages Market Market Structure & Competitive Landscape
The European e-brokerage market exhibits a moderately concentrated structure, with several major players vying for market share. The top 5 players, including Interactive Brokers, eToro, Plus500, Saxo Bank, and Degiro, collectively hold an estimated xx% market share in 2025. However, the market also features numerous smaller players and niche providers, indicating a competitive landscape.
Market Concentration:
- High concentration in the top tier (xx%)
- Fragmented lower tier with numerous smaller firms
- Emerging players driving innovation and competition
Innovation Drivers:
- Technological advancements (AI, algorithmic trading, mobile platforms)
- Regulatory changes driving adoption of new technologies
- Customer demand for sophisticated trading tools
Regulatory Impacts:
- MiFID II and other regulations impact operational costs and compliance.
- Varying regulatory frameworks across European countries create complexity.
- Compliance costs vary significantly across the different regions in Europe
Product Substitutes:
- Traditional brokerage services
- Peer-to-peer lending platforms
- Investment funds
End-User Segmentation:
- Retail investors (individual traders)
- Institutional investors (hedge funds, asset managers)
- High-net-worth individuals
M&A Trends:
- Consolidation is expected, with larger players acquiring smaller firms.
- M&A activity is driven by the need to expand market reach and enhance offerings.
- Estimated M&A volume in 2024: xx Million
Europe E-Brokerages Market Market Trends & Opportunities
The European e-brokerage market is experiencing significant growth, driven by several key factors. The market size is projected to reach xx Million by 2033, exhibiting a Compound Annual Growth Rate (CAGR) of xx% during the forecast period. This growth is fueled by increasing retail investor participation, technological advancements, and evolving consumer preferences. The market penetration rate is anticipated to reach xx% by 2033, reflecting widespread adoption of online trading platforms.
Technological shifts are reshaping the landscape, with the rise of mobile trading apps, AI-powered trading tools, and the increasing adoption of cryptocurrencies and other digital assets driving significant shifts. Consumer preferences are evolving towards user-friendly platforms offering personalized services, competitive pricing, and advanced analytical tools. Competitive dynamics are intense, with existing players constantly innovating and new entrants emerging to disrupt the market.
Dominant Markets & Segments in Europe E-Brokerages Market
The UK, Germany, and France represent the dominant markets within the European e-brokerage sector, collectively accounting for approximately xx% of the total market value in 2025. These markets benefit from robust financial infrastructure, favorable regulatory environments, and a high concentration of retail investors.
Key Growth Drivers:
- UK: Established financial ecosystem, high investor participation.
- Germany: Growing retail investor base, increasing adoption of online trading.
- France: Expanding fintech sector, supportive government policies.
Market Dominance Analysis:
The UK maintains its leading position due to factors such as the mature financial markets and existing high investor base. Germany's strong economic performance and growing adoption of online trading platforms are fueling its market growth. France's supportive regulatory environment and the growth of the Fintech sector further enhance its growth.
Europe E-Brokerages Market Product Analysis
The e-brokerage industry is characterized by constant innovation in trading platforms, investment tools, and analytical capabilities. Platforms are becoming increasingly user-friendly, offering features like mobile trading, advanced charting tools, and personalized investment recommendations. The competitive advantage lies in providing a seamless user experience, advanced analytical capabilities, competitive pricing structures, and exceptional customer service. Technological advancements, such as AI-driven trading algorithms and enhanced security measures, are critical for market success.
Key Drivers, Barriers & Challenges in Europe E-Brokerages Market
Key Drivers:
- Growing retail investor participation
- Technological advancements (mobile trading, AI)
- Favorable regulatory environment in certain markets
- Increased financial literacy among consumers
Challenges & Restraints:
- Regulatory complexities (varying regulations across Europe)
- Cybersecurity threats and data breaches
- Intense competition from established and new players
- Economic uncertainties influencing investor sentiment (estimated impact on market growth: xx%)
Growth Drivers in the Europe E-Brokerages Market Market
The market's growth is propelled by increased retail investor participation, fueled by heightened financial literacy and the accessibility of online trading platforms. Technological advancements, including AI-powered trading tools and mobile apps, enhance convenience and efficiency, contributing to market expansion. Favorable regulatory environments in some European countries further stimulate growth by encouraging innovation and competition.
Challenges Impacting Europe E-Brokerages Market Growth
Regulatory complexities and varying regulations across the European Union present a significant challenge. Cybersecurity risks and potential data breaches pose a major threat to investor trust and market stability. Intense competition from existing players and the emergence of new fintech companies further complicates market dynamics. Economic downturns and market volatility can significantly impact investor sentiment and transaction volumes.
Key Players Shaping the Europe E-Brokerages Market Market
- Interactive Brokers
- eToro
- Plus500
- Saxo Group
- Trading 212
- Degiro
- Exante
- X-Trade Brokers
- Robinhood
- Swissquote
- BUX
- Vanguard
- Capital.com
- Tradestation
- Freetrade
- Hargreaves Lansdown
- IC Markets
- Other Key Players (List Not Exhaustive)
Significant Europe E-Brokerages Market Industry Milestones
- February 2023: Interactive Brokers launched its new IBUSOPT order destination to improve price execution for options trading.
- January 2023: eToro introduced ValueGurus, a portfolio offering long-term exposure to value-investing strategies.
Future Outlook for Europe E-Brokerages Market Market
The European e-brokerage market is poised for continued growth, driven by technological innovation, increasing retail investor participation, and the expansion of online trading. Strategic opportunities exist for players who can effectively leverage technological advancements, offer personalized services, and cater to evolving investor preferences. The market is expected to witness further consolidation, with larger players acquiring smaller firms to gain market share and expand their product offerings. The overall outlook remains positive, with significant growth potential in the coming years.
Europe E-Brokerages Market Segmentation
-
1. Investor Type
- 1.1. Retail
- 1.2. Institutional
-
2. Services Offered
- 2.1. Full Time Brokers
- 2.2. Discount Brokers
-
3. Operation
- 3.1. Domestic
- 3.2. Foreign
Europe E-Brokerages Market Segmentation By Geography
- 1. Germany
- 2. United Kingdom
- 3. Russia
- 4. Spain
- 5. Netherlands
- 6. Denmark
- 7. Sweden
- 8. Finland
- 9. Norway
- 10. Rest of Europe
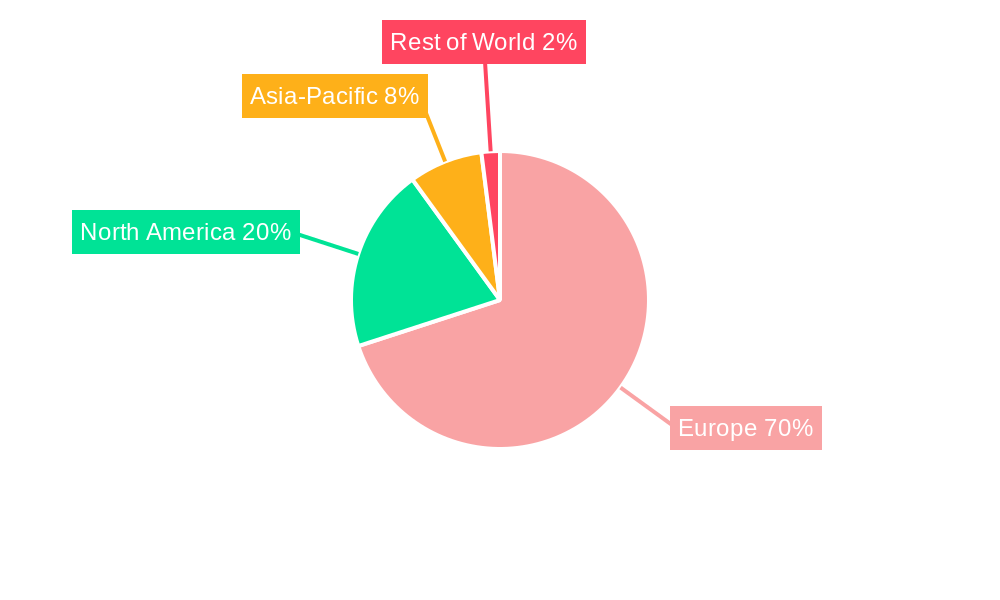
Europe E-Brokerages Market Regional Market Share
Geographic Coverage of Europe E-Brokerages Market
Europe E-Brokerages Market REPORT HIGHLIGHTS
| Aspects | Details |
|---|---|
| Study Period | 2020-2034 |
| Base Year | 2025 |
| Estimated Year | 2026 |
| Forecast Period | 2026-2034 |
| Historical Period | 2020-2025 |
| Growth Rate | CAGR of 9.4% from 2020-2034 |
| Segmentation |
|
Table of Contents
- 1. Introduction
- 1.1. Research Scope
- 1.2. Market Segmentation
- 1.3. Research Objective
- 1.4. Definitions and Assumptions
- 2. Executive Summary
- 2.1. Market Snapshot
- 3. Market Dynamics
- 3.1. Market Drivers
- 3.2. Market Restrains
- 3.3. Market Trends
- 3.4. Market Opportunities
- 4. Market Factor Analysis
- 4.1. Porters Five Forces
- 4.1.1. Bargaining Power of Suppliers
- 4.1.2. Bargaining Power of Buyers
- 4.1.3. Threat of New Entrants
- 4.1.4. Threat of Substitutes
- 4.1.5. Competitive Rivalry
- 4.2. PESTEL analysis
- 4.3. BCG Analysis
- 4.3.1. Stars (High Growth, High Market Share)
- 4.3.2. Cash Cows (Low Growth, High Market Share)
- 4.3.3. Question Mark (High Growth, Low Market Share)
- 4.3.4. Dogs (Low Growth, Low Market Share)
- 4.4. Ansoff Matrix Analysis
- 4.5. Supply Chain Analysis
- 4.6. Regulatory Landscape
- 4.7. Current Market Potential and Opportunity Assessment (TAM–SAM–SOM Framework)
- 4.8. TIR Analyst Note
- 4.1. Porters Five Forces
- 5. Market Analysis, Insights and Forecast 2021-2033
- 5.1. Market Analysis, Insights and Forecast - by Investor Type
- 5.1.1. Retail
- 5.1.2. Institutional
- 5.2. Market Analysis, Insights and Forecast - by Services Offered
- 5.2.1. Full Time Brokers
- 5.2.2. Discount Brokers
- 5.3. Market Analysis, Insights and Forecast - by Operation
- 5.3.1. Domestic
- 5.3.2. Foreign
- 5.4. Market Analysis, Insights and Forecast - by Region
- 5.4.1. Germany
- 5.4.2. United Kingdom
- 5.4.3. Russia
- 5.4.4. Spain
- 5.4.5. Netherlands
- 5.4.6. Denmark
- 5.4.7. Sweden
- 5.4.8. Finland
- 5.4.9. Norway
- 5.4.10. Rest of Europe
- 5.1. Market Analysis, Insights and Forecast - by Investor Type
- 6. Global Europe E-Brokerages Market Analysis, Insights and Forecast, 2021-2033
- 6.1. Market Analysis, Insights and Forecast - by Investor Type
- 6.1.1. Retail
- 6.1.2. Institutional
- 6.2. Market Analysis, Insights and Forecast - by Services Offered
- 6.2.1. Full Time Brokers
- 6.2.2. Discount Brokers
- 6.3. Market Analysis, Insights and Forecast - by Operation
- 6.3.1. Domestic
- 6.3.2. Foreign
- 6.1. Market Analysis, Insights and Forecast - by Investor Type
- 7. Germany Europe E-Brokerages Market Analysis, Insights and Forecast, 2020-2032
- 7.1. Market Analysis, Insights and Forecast - by Investor Type
- 7.1.1. Retail
- 7.1.2. Institutional
- 7.2. Market Analysis, Insights and Forecast - by Services Offered
- 7.2.1. Full Time Brokers
- 7.2.2. Discount Brokers
- 7.3. Market Analysis, Insights and Forecast - by Operation
- 7.3.1. Domestic
- 7.3.2. Foreign
- 7.1. Market Analysis, Insights and Forecast - by Investor Type
- 8. United Kingdom Europe E-Brokerages Market Analysis, Insights and Forecast, 2020-2032
- 8.1. Market Analysis, Insights and Forecast - by Investor Type
- 8.1.1. Retail
- 8.1.2. Institutional
- 8.2. Market Analysis, Insights and Forecast - by Services Offered
- 8.2.1. Full Time Brokers
- 8.2.2. Discount Brokers
- 8.3. Market Analysis, Insights and Forecast - by Operation
- 8.3.1. Domestic
- 8.3.2. Foreign
- 8.1. Market Analysis, Insights and Forecast - by Investor Type
- 9. Russia Europe E-Brokerages Market Analysis, Insights and Forecast, 2020-2032
- 9.1. Market Analysis, Insights and Forecast - by Investor Type
- 9.1.1. Retail
- 9.1.2. Institutional
- 9.2. Market Analysis, Insights and Forecast - by Services Offered
- 9.2.1. Full Time Brokers
- 9.2.2. Discount Brokers
- 9.3. Market Analysis, Insights and Forecast - by Operation
- 9.3.1. Domestic
- 9.3.2. Foreign
- 9.1. Market Analysis, Insights and Forecast - by Investor Type
- 10. Spain Europe E-Brokerages Market Analysis, Insights and Forecast, 2020-2032
- 10.1. Market Analysis, Insights and Forecast - by Investor Type
- 10.1.1. Retail
- 10.1.2. Institutional
- 10.2. Market Analysis, Insights and Forecast - by Services Offered
- 10.2.1. Full Time Brokers
- 10.2.2. Discount Brokers
- 10.3. Market Analysis, Insights and Forecast - by Operation
- 10.3.1. Domestic
- 10.3.2. Foreign
- 10.1. Market Analysis, Insights and Forecast - by Investor Type
- 11. Netherlands Europe E-Brokerages Market Analysis, Insights and Forecast, 2020-2032
- 11.1. Market Analysis, Insights and Forecast - by Investor Type
- 11.1.1. Retail
- 11.1.2. Institutional
- 11.2. Market Analysis, Insights and Forecast - by Services Offered
- 11.2.1. Full Time Brokers
- 11.2.2. Discount Brokers
- 11.3. Market Analysis, Insights and Forecast - by Operation
- 11.3.1. Domestic
- 11.3.2. Foreign
- 11.1. Market Analysis, Insights and Forecast - by Investor Type
- 12. Denmark Europe E-Brokerages Market Analysis, Insights and Forecast, 2020-2032
- 12.1. Market Analysis, Insights and Forecast - by Investor Type
- 12.1.1. Retail
- 12.1.2. Institutional
- 12.2. Market Analysis, Insights and Forecast - by Services Offered
- 12.2.1. Full Time Brokers
- 12.2.2. Discount Brokers
- 12.3. Market Analysis, Insights and Forecast - by Operation
- 12.3.1. Domestic
- 12.3.2. Foreign
- 12.1. Market Analysis, Insights and Forecast - by Investor Type
- 13. Sweden Europe E-Brokerages Market Analysis, Insights and Forecast, 2020-2032
- 13.1. Market Analysis, Insights and Forecast - by Investor Type
- 13.1.1. Retail
- 13.1.2. Institutional
- 13.2. Market Analysis, Insights and Forecast - by Services Offered
- 13.2.1. Full Time Brokers
- 13.2.2. Discount Brokers
- 13.3. Market Analysis, Insights and Forecast - by Operation
- 13.3.1. Domestic
- 13.3.2. Foreign
- 13.1. Market Analysis, Insights and Forecast - by Investor Type
- 14. Finland Europe E-Brokerages Market Analysis, Insights and Forecast, 2020-2032
- 14.1. Market Analysis, Insights and Forecast - by Investor Type
- 14.1.1. Retail
- 14.1.2. Institutional
- 14.2. Market Analysis, Insights and Forecast - by Services Offered
- 14.2.1. Full Time Brokers
- 14.2.2. Discount Brokers
- 14.3. Market Analysis, Insights and Forecast - by Operation
- 14.3.1. Domestic
- 14.3.2. Foreign
- 14.1. Market Analysis, Insights and Forecast - by Investor Type
- 15. Norway Europe E-Brokerages Market Analysis, Insights and Forecast, 2020-2032
- 15.1. Market Analysis, Insights and Forecast - by Investor Type
- 15.1.1. Retail
- 15.1.2. Institutional
- 15.2. Market Analysis, Insights and Forecast - by Services Offered
- 15.2.1. Full Time Brokers
- 15.2.2. Discount Brokers
- 15.3. Market Analysis, Insights and Forecast - by Operation
- 15.3.1. Domestic
- 15.3.2. Foreign
- 15.1. Market Analysis, Insights and Forecast - by Investor Type
- 16. Rest of Europe Europe E-Brokerages Market Analysis, Insights and Forecast, 2020-2032
- 16.1. Market Analysis, Insights and Forecast - by Investor Type
- 16.1.1. Retail
- 16.1.2. Institutional
- 16.2. Market Analysis, Insights and Forecast - by Services Offered
- 16.2.1. Full Time Brokers
- 16.2.2. Discount Brokers
- 16.3. Market Analysis, Insights and Forecast - by Operation
- 16.3.1. Domestic
- 16.3.2. Foreign
- 16.1. Market Analysis, Insights and Forecast - by Investor Type
- 17. Competitive Analysis
- 17.1. Company Profiles
- 17.1.1 Interactive Brokers
- 17.1.1.1. Company Overview
- 17.1.1.2. Products
- 17.1.1.3. Company Financials
- 17.1.1.4. SWOT Analysis
- 17.1.2 Etoro
- 17.1.2.1. Company Overview
- 17.1.2.2. Products
- 17.1.2.3. Company Financials
- 17.1.2.4. SWOT Analysis
- 17.1.3 Plus
- 17.1.3.1. Company Overview
- 17.1.3.2. Products
- 17.1.3.3. Company Financials
- 17.1.3.4. SWOT Analysis
- 17.1.4 Saxo Group
- 17.1.4.1. Company Overview
- 17.1.4.2. Products
- 17.1.4.3. Company Financials
- 17.1.4.4. SWOT Analysis
- 17.1.5 Trading
- 17.1.5.1. Company Overview
- 17.1.5.2. Products
- 17.1.5.3. Company Financials
- 17.1.5.4. SWOT Analysis
- 17.1.6 Degiro
- 17.1.6.1. Company Overview
- 17.1.6.2. Products
- 17.1.6.3. Company Financials
- 17.1.6.4. SWOT Analysis
- 17.1.7 Exante
- 17.1.7.1. Company Overview
- 17.1.7.2. Products
- 17.1.7.3. Company Financials
- 17.1.7.4. SWOT Analysis
- 17.1.8 X-Trade Brokers
- 17.1.8.1. Company Overview
- 17.1.8.2. Products
- 17.1.8.3. Company Financials
- 17.1.8.4. SWOT Analysis
- 17.1.9 Robinhood
- 17.1.9.1. Company Overview
- 17.1.9.2. Products
- 17.1.9.3. Company Financials
- 17.1.9.4. SWOT Analysis
- 17.1.10 SwissQuote
- 17.1.10.1. Company Overview
- 17.1.10.2. Products
- 17.1.10.3. Company Financials
- 17.1.10.4. SWOT Analysis
- 17.1.11 BUX
- 17.1.11.1. Company Overview
- 17.1.11.2. Products
- 17.1.11.3. Company Financials
- 17.1.11.4. SWOT Analysis
- 17.1.12 Vanguard
- 17.1.12.1. Company Overview
- 17.1.12.2. Products
- 17.1.12.3. Company Financials
- 17.1.12.4. SWOT Analysis
- 17.1.13 Capital Com
- 17.1.13.1. Company Overview
- 17.1.13.2. Products
- 17.1.13.3. Company Financials
- 17.1.13.4. SWOT Analysis
- 17.1.14 Tradestation
- 17.1.14.1. Company Overview
- 17.1.14.2. Products
- 17.1.14.3. Company Financials
- 17.1.14.4. SWOT Analysis
- 17.1.15 Freetrade
- 17.1.15.1. Company Overview
- 17.1.15.2. Products
- 17.1.15.3. Company Financials
- 17.1.15.4. SWOT Analysis
- 17.1.16 Hargreaves Lansdown
- 17.1.16.1. Company Overview
- 17.1.16.2. Products
- 17.1.16.3. Company Financials
- 17.1.16.4. SWOT Analysis
- 17.1.17 IC Market
- 17.1.17.1. Company Overview
- 17.1.17.2. Products
- 17.1.17.3. Company Financials
- 17.1.17.4. SWOT Analysis
- 17.1.18 Other Key Players**List Not Exhaustive
- 17.1.18.1. Company Overview
- 17.1.18.2. Products
- 17.1.18.3. Company Financials
- 17.1.18.4. SWOT Analysis
- 17.1.1 Interactive Brokers
- 17.2. Market Entropy
- 17.2.1 Company's Key Areas Served
- 17.2.2 Recent Developments
- 17.3. Company Market Share Analysis 2025
- 17.3.1 Top 5 Companies Market Share Analysis
- 17.3.2 Top 3 Companies Market Share Analysis
- 17.4. List of Potential Customers
- 18. Research Methodology
List of Figures
- Figure 1: Global Europe E-Brokerages Market Revenue Breakdown (billion, %) by Region 2025 & 2033
- Figure 2: Germany Europe E-Brokerages Market Revenue (billion), by Investor Type 2025 & 2033
- Figure 3: Germany Europe E-Brokerages Market Revenue Share (%), by Investor Type 2025 & 2033
- Figure 4: Germany Europe E-Brokerages Market Revenue (billion), by Services Offered 2025 & 2033
- Figure 5: Germany Europe E-Brokerages Market Revenue Share (%), by Services Offered 2025 & 2033
- Figure 6: Germany Europe E-Brokerages Market Revenue (billion), by Operation 2025 & 2033
- Figure 7: Germany Europe E-Brokerages Market Revenue Share (%), by Operation 2025 & 2033
- Figure 8: Germany Europe E-Brokerages Market Revenue (billion), by Country 2025 & 2033
- Figure 9: Germany Europe E-Brokerages Market Revenue Share (%), by Country 2025 & 2033
- Figure 10: United Kingdom Europe E-Brokerages Market Revenue (billion), by Investor Type 2025 & 2033
- Figure 11: United Kingdom Europe E-Brokerages Market Revenue Share (%), by Investor Type 2025 & 2033
- Figure 12: United Kingdom Europe E-Brokerages Market Revenue (billion), by Services Offered 2025 & 2033
- Figure 13: United Kingdom Europe E-Brokerages Market Revenue Share (%), by Services Offered 2025 & 2033
- Figure 14: United Kingdom Europe E-Brokerages Market Revenue (billion), by Operation 2025 & 2033
- Figure 15: United Kingdom Europe E-Brokerages Market Revenue Share (%), by Operation 2025 & 2033
- Figure 16: United Kingdom Europe E-Brokerages Market Revenue (billion), by Country 2025 & 2033
- Figure 17: United Kingdom Europe E-Brokerages Market Revenue Share (%), by Country 2025 & 2033
- Figure 18: Russia Europe E-Brokerages Market Revenue (billion), by Investor Type 2025 & 2033
- Figure 19: Russia Europe E-Brokerages Market Revenue Share (%), by Investor Type 2025 & 2033
- Figure 20: Russia Europe E-Brokerages Market Revenue (billion), by Services Offered 2025 & 2033
- Figure 21: Russia Europe E-Brokerages Market Revenue Share (%), by Services Offered 2025 & 2033
- Figure 22: Russia Europe E-Brokerages Market Revenue (billion), by Operation 2025 & 2033
- Figure 23: Russia Europe E-Brokerages Market Revenue Share (%), by Operation 2025 & 2033
- Figure 24: Russia Europe E-Brokerages Market Revenue (billion), by Country 2025 & 2033
- Figure 25: Russia Europe E-Brokerages Market Revenue Share (%), by Country 2025 & 2033
- Figure 26: Spain Europe E-Brokerages Market Revenue (billion), by Investor Type 2025 & 2033
- Figure 27: Spain Europe E-Brokerages Market Revenue Share (%), by Investor Type 2025 & 2033
- Figure 28: Spain Europe E-Brokerages Market Revenue (billion), by Services Offered 2025 & 2033
- Figure 29: Spain Europe E-Brokerages Market Revenue Share (%), by Services Offered 2025 & 2033
- Figure 30: Spain Europe E-Brokerages Market Revenue (billion), by Operation 2025 & 2033
- Figure 31: Spain Europe E-Brokerages Market Revenue Share (%), by Operation 2025 & 2033
- Figure 32: Spain Europe E-Brokerages Market Revenue (billion), by Country 2025 & 2033
- Figure 33: Spain Europe E-Brokerages Market Revenue Share (%), by Country 2025 & 2033
- Figure 34: Netherlands Europe E-Brokerages Market Revenue (billion), by Investor Type 2025 & 2033
- Figure 35: Netherlands Europe E-Brokerages Market Revenue Share (%), by Investor Type 2025 & 2033
- Figure 36: Netherlands Europe E-Brokerages Market Revenue (billion), by Services Offered 2025 & 2033
- Figure 37: Netherlands Europe E-Brokerages Market Revenue Share (%), by Services Offered 2025 & 2033
- Figure 38: Netherlands Europe E-Brokerages Market Revenue (billion), by Operation 2025 & 2033
- Figure 39: Netherlands Europe E-Brokerages Market Revenue Share (%), by Operation 2025 & 2033
- Figure 40: Netherlands Europe E-Brokerages Market Revenue (billion), by Country 2025 & 2033
- Figure 41: Netherlands Europe E-Brokerages Market Revenue Share (%), by Country 2025 & 2033
- Figure 42: Denmark Europe E-Brokerages Market Revenue (billion), by Investor Type 2025 & 2033
- Figure 43: Denmark Europe E-Brokerages Market Revenue Share (%), by Investor Type 2025 & 2033
- Figure 44: Denmark Europe E-Brokerages Market Revenue (billion), by Services Offered 2025 & 2033
- Figure 45: Denmark Europe E-Brokerages Market Revenue Share (%), by Services Offered 2025 & 2033
- Figure 46: Denmark Europe E-Brokerages Market Revenue (billion), by Operation 2025 & 2033
- Figure 47: Denmark Europe E-Brokerages Market Revenue Share (%), by Operation 2025 & 2033
- Figure 48: Denmark Europe E-Brokerages Market Revenue (billion), by Country 2025 & 2033
- Figure 49: Denmark Europe E-Brokerages Market Revenue Share (%), by Country 2025 & 2033
- Figure 50: Sweden Europe E-Brokerages Market Revenue (billion), by Investor Type 2025 & 2033
- Figure 51: Sweden Europe E-Brokerages Market Revenue Share (%), by Investor Type 2025 & 2033
- Figure 52: Sweden Europe E-Brokerages Market Revenue (billion), by Services Offered 2025 & 2033
- Figure 53: Sweden Europe E-Brokerages Market Revenue Share (%), by Services Offered 2025 & 2033
- Figure 54: Sweden Europe E-Brokerages Market Revenue (billion), by Operation 2025 & 2033
- Figure 55: Sweden Europe E-Brokerages Market Revenue Share (%), by Operation 2025 & 2033
- Figure 56: Sweden Europe E-Brokerages Market Revenue (billion), by Country 2025 & 2033
- Figure 57: Sweden Europe E-Brokerages Market Revenue Share (%), by Country 2025 & 2033
- Figure 58: Finland Europe E-Brokerages Market Revenue (billion), by Investor Type 2025 & 2033
- Figure 59: Finland Europe E-Brokerages Market Revenue Share (%), by Investor Type 2025 & 2033
- Figure 60: Finland Europe E-Brokerages Market Revenue (billion), by Services Offered 2025 & 2033
- Figure 61: Finland Europe E-Brokerages Market Revenue Share (%), by Services Offered 2025 & 2033
- Figure 62: Finland Europe E-Brokerages Market Revenue (billion), by Operation 2025 & 2033
- Figure 63: Finland Europe E-Brokerages Market Revenue Share (%), by Operation 2025 & 2033
- Figure 64: Finland Europe E-Brokerages Market Revenue (billion), by Country 2025 & 2033
- Figure 65: Finland Europe E-Brokerages Market Revenue Share (%), by Country 2025 & 2033
- Figure 66: Norway Europe E-Brokerages Market Revenue (billion), by Investor Type 2025 & 2033
- Figure 67: Norway Europe E-Brokerages Market Revenue Share (%), by Investor Type 2025 & 2033
- Figure 68: Norway Europe E-Brokerages Market Revenue (billion), by Services Offered 2025 & 2033
- Figure 69: Norway Europe E-Brokerages Market Revenue Share (%), by Services Offered 2025 & 2033
- Figure 70: Norway Europe E-Brokerages Market Revenue (billion), by Operation 2025 & 2033
- Figure 71: Norway Europe E-Brokerages Market Revenue Share (%), by Operation 2025 & 2033
- Figure 72: Norway Europe E-Brokerages Market Revenue (billion), by Country 2025 & 2033
- Figure 73: Norway Europe E-Brokerages Market Revenue Share (%), by Country 2025 & 2033
- Figure 74: Rest of Europe Europe E-Brokerages Market Revenue (billion), by Investor Type 2025 & 2033
- Figure 75: Rest of Europe Europe E-Brokerages Market Revenue Share (%), by Investor Type 2025 & 2033
- Figure 76: Rest of Europe Europe E-Brokerages Market Revenue (billion), by Services Offered 2025 & 2033
- Figure 77: Rest of Europe Europe E-Brokerages Market Revenue Share (%), by Services Offered 2025 & 2033
- Figure 78: Rest of Europe Europe E-Brokerages Market Revenue (billion), by Operation 2025 & 2033
- Figure 79: Rest of Europe Europe E-Brokerages Market Revenue Share (%), by Operation 2025 & 2033
- Figure 80: Rest of Europe Europe E-Brokerages Market Revenue (billion), by Country 2025 & 2033
- Figure 81: Rest of Europe Europe E-Brokerages Market Revenue Share (%), by Country 2025 & 2033
List of Tables
- Table 1: Global Europe E-Brokerages Market Revenue billion Forecast, by Investor Type 2020 & 2033
- Table 2: Global Europe E-Brokerages Market Revenue billion Forecast, by Services Offered 2020 & 2033
- Table 3: Global Europe E-Brokerages Market Revenue billion Forecast, by Operation 2020 & 2033
- Table 4: Global Europe E-Brokerages Market Revenue billion Forecast, by Region 2020 & 2033
- Table 5: Global Europe E-Brokerages Market Revenue billion Forecast, by Investor Type 2020 & 2033
- Table 6: Global Europe E-Brokerages Market Revenue billion Forecast, by Services Offered 2020 & 2033
- Table 7: Global Europe E-Brokerages Market Revenue billion Forecast, by Operation 2020 & 2033
- Table 8: Global Europe E-Brokerages Market Revenue billion Forecast, by Country 2020 & 2033
- Table 9: Global Europe E-Brokerages Market Revenue billion Forecast, by Investor Type 2020 & 2033
- Table 10: Global Europe E-Brokerages Market Revenue billion Forecast, by Services Offered 2020 & 2033
- Table 11: Global Europe E-Brokerages Market Revenue billion Forecast, by Operation 2020 & 2033
- Table 12: Global Europe E-Brokerages Market Revenue billion Forecast, by Country 2020 & 2033
- Table 13: Global Europe E-Brokerages Market Revenue billion Forecast, by Investor Type 2020 & 2033
- Table 14: Global Europe E-Brokerages Market Revenue billion Forecast, by Services Offered 2020 & 2033
- Table 15: Global Europe E-Brokerages Market Revenue billion Forecast, by Operation 2020 & 2033
- Table 16: Global Europe E-Brokerages Market Revenue billion Forecast, by Country 2020 & 2033
- Table 17: Global Europe E-Brokerages Market Revenue billion Forecast, by Investor Type 2020 & 2033
- Table 18: Global Europe E-Brokerages Market Revenue billion Forecast, by Services Offered 2020 & 2033
- Table 19: Global Europe E-Brokerages Market Revenue billion Forecast, by Operation 2020 & 2033
- Table 20: Global Europe E-Brokerages Market Revenue billion Forecast, by Country 2020 & 2033
- Table 21: Global Europe E-Brokerages Market Revenue billion Forecast, by Investor Type 2020 & 2033
- Table 22: Global Europe E-Brokerages Market Revenue billion Forecast, by Services Offered 2020 & 2033
- Table 23: Global Europe E-Brokerages Market Revenue billion Forecast, by Operation 2020 & 2033
- Table 24: Global Europe E-Brokerages Market Revenue billion Forecast, by Country 2020 & 2033
- Table 25: Global Europe E-Brokerages Market Revenue billion Forecast, by Investor Type 2020 & 2033
- Table 26: Global Europe E-Brokerages Market Revenue billion Forecast, by Services Offered 2020 & 2033
- Table 27: Global Europe E-Brokerages Market Revenue billion Forecast, by Operation 2020 & 2033
- Table 28: Global Europe E-Brokerages Market Revenue billion Forecast, by Country 2020 & 2033
- Table 29: Global Europe E-Brokerages Market Revenue billion Forecast, by Investor Type 2020 & 2033
- Table 30: Global Europe E-Brokerages Market Revenue billion Forecast, by Services Offered 2020 & 2033
- Table 31: Global Europe E-Brokerages Market Revenue billion Forecast, by Operation 2020 & 2033
- Table 32: Global Europe E-Brokerages Market Revenue billion Forecast, by Country 2020 & 2033
- Table 33: Global Europe E-Brokerages Market Revenue billion Forecast, by Investor Type 2020 & 2033
- Table 34: Global Europe E-Brokerages Market Revenue billion Forecast, by Services Offered 2020 & 2033
- Table 35: Global Europe E-Brokerages Market Revenue billion Forecast, by Operation 2020 & 2033
- Table 36: Global Europe E-Brokerages Market Revenue billion Forecast, by Country 2020 & 2033
- Table 37: Global Europe E-Brokerages Market Revenue billion Forecast, by Investor Type 2020 & 2033
- Table 38: Global Europe E-Brokerages Market Revenue billion Forecast, by Services Offered 2020 & 2033
- Table 39: Global Europe E-Brokerages Market Revenue billion Forecast, by Operation 2020 & 2033
- Table 40: Global Europe E-Brokerages Market Revenue billion Forecast, by Country 2020 & 2033
- Table 41: Global Europe E-Brokerages Market Revenue billion Forecast, by Investor Type 2020 & 2033
- Table 42: Global Europe E-Brokerages Market Revenue billion Forecast, by Services Offered 2020 & 2033
- Table 43: Global Europe E-Brokerages Market Revenue billion Forecast, by Operation 2020 & 2033
- Table 44: Global Europe E-Brokerages Market Revenue billion Forecast, by Country 2020 & 2033
Frequently Asked Questions
1. What is the projected Compound Annual Growth Rate (CAGR) of the Europe E-Brokerages Market?
The projected CAGR is approximately 9.4%.
2. Which companies are prominent players in the Europe E-Brokerages Market?
Key companies in the market include Interactive Brokers, Etoro, Plus, Saxo Group, Trading, Degiro, Exante, X-Trade Brokers, Robinhood, SwissQuote, BUX, Vanguard, Capital Com, Tradestation, Freetrade, Hargreaves Lansdown, IC Market, Other Key Players**List Not Exhaustive.
3. What are the main segments of the Europe E-Brokerages Market?
The market segments include Investor Type, Services Offered, Operation.
4. Can you provide details about the market size?
The market size is estimated to be USD 14.1 billion as of 2022.
5. What are some drivers contributing to market growth?
N/A
6. What are the notable trends driving market growth?
Growing Retail Investors in The Region is Driving The E-Brokerages Market.
7. Are there any restraints impacting market growth?
N/A
8. Can you provide examples of recent developments in the market?
February 2023: Interactive Brokers announced the launch of its new IBUSOPT order destination. With the dramatic increase in retail options trading, Interactive Brokers has launched this new order destination to help its retail and institutional clients achieve better price execution on their options trades.
9. What pricing options are available for accessing the report?
Pricing options include single-user, multi-user, and enterprise licenses priced at USD 4750, USD 5250, and USD 8750 respectively.
10. Is the market size provided in terms of value or volume?
The market size is provided in terms of value, measured in billion.
11. Are there any specific market keywords associated with the report?
Yes, the market keyword associated with the report is "Europe E-Brokerages Market," which aids in identifying and referencing the specific market segment covered.
12. How do I determine which pricing option suits my needs best?
The pricing options vary based on user requirements and access needs. Individual users may opt for single-user licenses, while businesses requiring broader access may choose multi-user or enterprise licenses for cost-effective access to the report.
13. Are there any additional resources or data provided in the Europe E-Brokerages Market report?
While the report offers comprehensive insights, it's advisable to review the specific contents or supplementary materials provided to ascertain if additional resources or data are available.
14. How can I stay updated on further developments or reports in the Europe E-Brokerages Market?
To stay informed about further developments, trends, and reports in the Europe E-Brokerages Market, consider subscribing to industry newsletters, following relevant companies and organizations, or regularly checking reputable industry news sources and publications.
Methodology
Step 1 - Identification of Relevant Samples Size from Population Database


Step 2 - Approaches for Defining Global Market Size (Value, Volume* & Price*)

Note*: In applicable scenarios
Step 3 - Data Sources
Primary Research
- Web Analytics
- Survey Reports
- Research Institute
- Latest Research Reports
- Opinion Leaders
Secondary Research
- Annual Reports
- White Paper
- Latest Press Release
- Industry Association
- Paid Database
- Investor Presentations

Step 4 - Data Triangulation
Involves using different sources of information in order to increase the validity of a study
These sources are likely to be stakeholders in a program - participants, other researchers, program staff, other community members, and so on.
Then we put all data in single framework & apply various statistical tools to find out the dynamic on the market.
During the analysis stage, feedback from the stakeholder groups would be compared to determine areas of agreement as well as areas of divergence