

Key Insights
The European rice market, valued at €729.50 million in 2025, is projected to experience steady growth, driven by rising consumer demand for healthy and convenient food options. Parboiled rice, favored for its longer shelf life and nutritional benefits, is expected to dominate the product type segment. The food and beverage industry is the primary application, with increasing usage in ready-to-eat meals, snacks, and processed foods fueling market expansion. Organic rice is gaining traction, driven by increasing health consciousness and willingness to pay a premium for sustainably produced food. However, the market faces challenges from fluctuating rice prices influenced by global production and trade dynamics, as well as competition from other staple grains. Major players like BASF, Corteva Agriscience, Syngenta, Bayer CropScience, and Rallis India are actively investing in research and development to enhance rice yield and quality, and to develop innovative rice varieties tailored to European consumer preferences. Growth is also being influenced by the increasing adoption of sustainable agricultural practices within the rice industry.
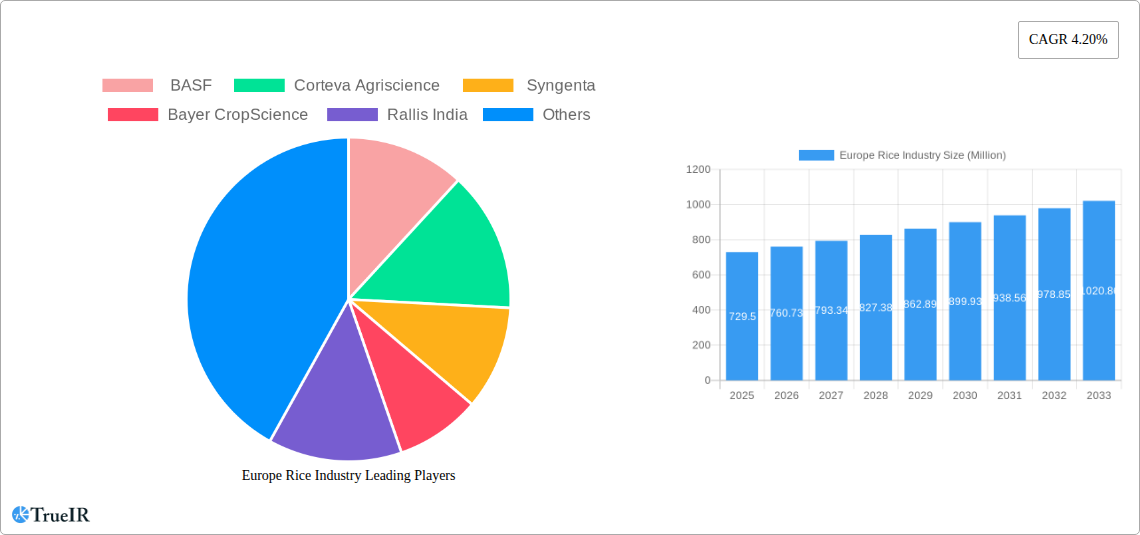
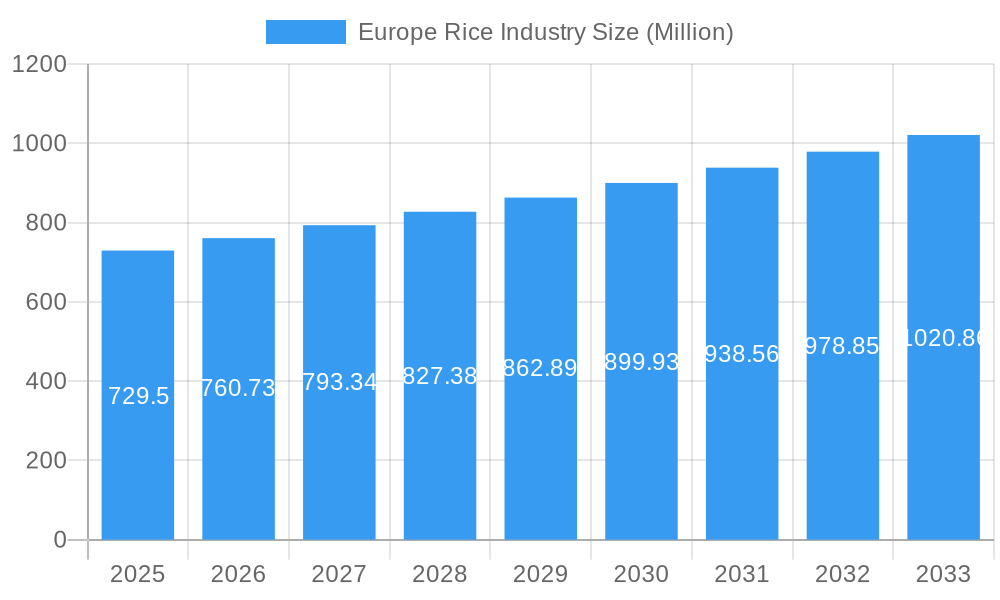
Europe Rice Industry Market Size (In Million)
The projected Compound Annual Growth Rate (CAGR) of 4.20% from 2025 to 2033 suggests a gradual yet consistent market expansion. This growth is anticipated to be driven primarily by increasing urbanization and changing dietary habits within Europe, leading to higher consumption of processed foods incorporating rice. The segmental breakdown shows the significant contribution of established companies to the market, indicating a competitive landscape. Regional analysis within Europe highlights key markets such as Germany, France, Italy, the United Kingdom, and the Netherlands as significant contributors to the overall market size. Future market penetration will likely depend on the successful introduction of new rice varieties, marketing strategies to address consumer health concerns, and the sustainable production and sourcing of rice. Further market segmentation may need to be considered in future assessments, including geographical data at a more granular level and investigation into factors like import/export dynamics influencing pricing and availability.
Europe Rice Industry Company Market Share
This comprehensive report delivers an in-depth analysis of the dynamic Europe rice industry, projecting robust growth from 2025 to 2033. It provides crucial insights for industry stakeholders, investors, and strategic decision-makers seeking to navigate this evolving market. The study period covers 2019-2033, with 2025 as the base and estimated year. The forecast period is 2025-2033, and the historical period encompasses 2019-2024.
Europe Rice Industry Market Structure & Competitive Landscape
The European rice market exhibits a moderately concentrated structure, with a few major players and several smaller regional actors vying for market share. The Herfindahl-Hirschman Index (HHI) is estimated at xx in 2025, indicating a moderately competitive landscape. Innovation is driven by factors such as the increasing demand for high-quality rice varieties, advancements in rice processing technologies, and the growing popularity of organic and functional rice products. Regulatory impacts, particularly those related to food safety, sustainability, and genetically modified organisms (GMOs), are significant. The market also experiences pressure from substitute products, including other grains and starches.
- End-user segmentation: The market is primarily driven by food and beverage applications, with a significant but smaller portion used in animal feed.
- M&A trends: The past five years have witnessed xx M&A deals in the European rice industry, primarily focused on consolidation and expansion into new markets.
- Major Players: The competitive landscape is shaped by companies like BASF, Corteva Agriscience, Syngenta, Bayer CropScience, and Rallis India, each employing distinct strategies for market penetration. The market share of the top five players is estimated to be xx% in 2025.
Europe Rice Industry Market Trends & Opportunities
The European rice market is projected to experience a Compound Annual Growth Rate (CAGR) of xx% from 2025 to 2033, driven by several key factors. Rising disposable incomes and changing consumer preferences towards healthier and more convenient food options are fueling demand. Technological advancements in rice cultivation and processing, such as precision agriculture and improved milling techniques, are enhancing efficiency and product quality. The market penetration rate of organic rice is steadily increasing, reflecting growing consumer awareness of sustainability and health benefits. The competitive landscape is characterized by both price competition and product differentiation, with companies investing in research and development to create innovative rice varieties and products. The market size is estimated at €xx Million in 2025 and projected to reach €xx Million by 2033. Consumer preferences are shifting towards convenience and specific health benefits, leading to the growth of value-added rice products.
Dominant Markets & Segments in Europe Rice Industry
The European rice industry is characterized by a robust demand for conventional rice, driven by its widespread use in the vast food and beverage sector. While conventional rice remains the market leader, segments like parboiled and organic rice are experiencing notable growth, reflecting evolving consumer preferences and dietary trends.
Product Type:
- Conventional Rice: This segment continues to dominate due to its inherent affordability, versatility, and consistent demand across a wide spectrum of culinary applications. Its staple status in many European cuisines underpins its sustained market presence.
- Parboiled Rice: Experiencing steady expansion, parboiled rice appeals to consumers seeking its enhanced nutritional profile and improved cooking qualities, including reduced stickiness and a longer shelf life. This makes it a preferred choice for both home cooks and food manufacturers.
- Organic Rice: This rapidly growing niche segment is a testament to the increasing consumer consciousness regarding health and sustainability. The demand for organic rice is fueled by a desire for food produced with environmentally friendly practices and free from synthetic pesticides and fertilizers.
Application:
- Food and Beverage: Unquestionably the largest application segment, this encompasses a wide array of uses, from staple meals and side dishes to ingredients in processed foods, confectionery, and ethnic cuisines. The versatility and adaptability of rice ensure its continued prominence.
- Animal Feed: While a smaller contributor, the animal feed sector provides a stable demand for rice, particularly rice by-products. Its cost-effectiveness as an energy source in feed formulations makes it a consistent component in this market.
Key Growth Drivers (by region and segment will vary, Italy and Spain are examples):
- Italy: With a deep-rooted culinary heritage and a significant population, Italy presents a substantial market for rice, particularly in its traditional dishes like risotto.
- Spain: Mirroring Italy's strength, Spain's strong culinary traditions, especially its affinity for paella, drive consistent and high demand for rice.
- Infrastructure: A well-developed logistics network, including efficient transportation and advanced storage facilities, is crucial for maintaining a stable supply chain, ensuring product quality, and minimizing post-harvest losses.
- Government Policies: Supportive government initiatives, including subsidies for domestic production, promotion of sustainable farming practices, and measures aimed at ensuring food security, play a vital role in fostering a conducive environment for the rice industry.
Europe Rice Industry Product Analysis
The European rice industry showcases ongoing innovation in rice varieties, processing techniques, and packaging solutions. Advancements focus on improving nutritional value, extending shelf life, and enhancing convenience. For example, the development of fortified rice varieties addresses micronutrient deficiencies, while innovative packaging technologies maintain product quality and reduce waste. Companies are also investing in technologies to enhance product differentiation and cater to evolving consumer preferences.
Key Drivers, Barriers & Challenges in Europe Rice Industry
Key Drivers:
The European rice market is significantly propelled by a growing consumer inclination towards healthier food choices and the demand for convenient meal solutions, amplified by rising disposable incomes and evolving lifestyles. Continuous innovation in rice cultivation techniques, processing technologies, and product development further fuels market expansion. Additionally, supportive government policies that champion sustainable agriculture and promote food self-sufficiency act as powerful catalysts for growth.
Key Challenges:
The industry grapples with significant challenges including potential supply chain disruptions stemming from the unpredictable impacts of climate change and volatile geopolitical landscapes. Stringent and evolving regulatory frameworks concerning food safety standards and detailed product labeling requirements necessitate considerable investment in compliance, increasing operational costs. Intense price competition from alternative grains and rice-exporting nations also exerts considerable pressure on profit margins, potentially limiting market expansion and investment in new developments. For instance, an estimated [Insert Specific Percentage]% of rice imports experienced significant delays in 2024 due to persistent port congestion, resulting in an estimated economic impact of [Insert Specific Euro Amount] million euros on profitability.
Growth Drivers in the Europe Rice Industry Market
Technological advancements such as precision agriculture and improved milling techniques enhance efficiency and product quality. Growing consumer preference for healthy and convenient foods fuels demand. Government initiatives promoting sustainable agriculture and food security also contribute to market expansion. Increased disposable incomes in several European countries further boost demand.
Challenges Impacting Europe Rice Industry Growth
The resilience of the Europe rice industry is tested by inherent supply chain vulnerabilities, exacerbated by the unpredictability of climate change and ongoing geopolitical instabilities. Navigating the complex web of stringent regulatory mandates for food safety and comprehensive labeling requirements presents a significant compliance burden and increases operational expenditure. Furthermore, the competitive landscape is intensified by the availability of alternative grains and aggressive pricing strategies from major rice-importing countries, placing continuous pressure on profitability and market share.
Key Players Shaping the Europe Rice Industry Market
The European rice industry is actively shaped by a diverse range of companies, from major agricultural input providers to specialized rice processors. Key stakeholders include:
- BASF (Agrochemicals and solutions)
- Corteva Agriscience (Seeds and crop protection)
- Syngenta (Crop protection and seeds)
- Bayer CropScience (Seeds, traits, and crop protection)
- Rallis India (Agrochemicals and seeds)
Significant Europe Rice Industry Industry Milestones
- 2021: Introduction of a new high-yield rice variety by Syngenta.
- 2022: Acquisition of a smaller rice processing company by BASF.
- 2023: Implementation of stricter food safety regulations across several European countries.
- 2024: Launch of a new line of organic rice products by Corteva Agriscience.
Future Outlook for Europe Rice Industry Market
The European rice market is projected to maintain a trajectory of sustained growth, primarily fueled by a continually increasing consumer appetite for nutritious, healthy, and convenient rice-based products. Strategic investments in research and development will be paramount, focusing on the innovation of novel rice varieties with enhanced nutritional profiles and superior processing technologies that optimize quality and efficiency. Companies that demonstrate agility in adapting to evolving consumer preferences and adeptly navigate the intricate regulatory environment are best positioned for future success. Expansion into emerging and specialized segments, such as premium organic rice and functional rice products with added health benefits, presents significant opportunities for sustained market leadership and revenue generation.
Europe Rice Industry Segmentation
- 1. Production Analysis
- 2. Consumption Analysis
- 3. Import Market Analysis (Value & Volume)
- 4. Export Market Analysis (Value & Volume)
- 5. Price Trend Analysis
Europe Rice Industry Segmentation By Geography
- 1. Belgium
- 2. United Kingdom
- 3. France
- 4. Italy
- 5. Germany
- 6. Spain
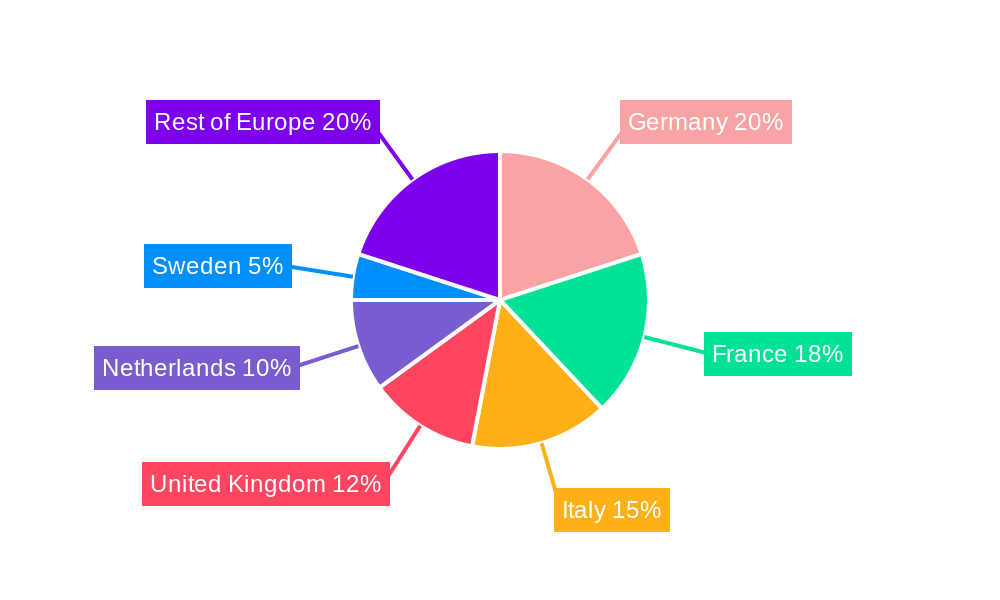
Europe Rice Industry Regional Market Share
Geographic Coverage of Europe Rice Industry
Europe Rice Industry REPORT HIGHLIGHTS
| Aspects | Details |
|---|---|
| Study Period | 2020-2034 |
| Base Year | 2025 |
| Estimated Year | 2026 |
| Forecast Period | 2026-2034 |
| Historical Period | 2020-2025 |
| Growth Rate | CAGR of 4.20% from 2020-2034 |
| Segmentation |
|
Table of Contents
- 1. Introduction
- 1.1. Research Scope
- 1.2. Market Segmentation
- 1.3. Research Methodology
- 1.4. Definitions and Assumptions
- 2. Executive Summary
- 2.1. Introduction
- 3. Market Dynamics
- 3.1. Introduction
- 3.2. Market Drivers
- 3.2.1. Rising Consumption of Cashew Nuts in the Country; Favorable Government Initiatives
- 3.3. Market Restrains
- 3.3.1. Hazardous Climatic Condition Hinders Cashew Production; Stringent Regulations Related to Food Quality Standards
- 3.4. Market Trends
- 3.4.1. Strong Demand in Northwestern Europe
- 4. Market Factor Analysis
- 4.1. Porters Five Forces
- 4.2. Supply/Value Chain
- 4.3. PESTEL analysis
- 4.4. Market Entropy
- 4.5. Patent/Trademark Analysis
- 5. Europe Rice Industry Analysis, Insights and Forecast, 2020-2032
- 5.1. Market Analysis, Insights and Forecast - by Production Analysis
- 5.2. Market Analysis, Insights and Forecast - by Consumption Analysis
- 5.3. Market Analysis, Insights and Forecast - by Import Market Analysis (Value & Volume)
- 5.4. Market Analysis, Insights and Forecast - by Export Market Analysis (Value & Volume)
- 5.5. Market Analysis, Insights and Forecast - by Price Trend Analysis
- 5.6. Market Analysis, Insights and Forecast - by Region
- 5.6.1. Belgium
- 5.6.2. United Kingdom
- 5.6.3. France
- 5.6.4. Italy
- 5.6.5. Germany
- 5.6.6. Spain
- 5.1. Market Analysis, Insights and Forecast - by Production Analysis
- 6. Belgium Europe Rice Industry Analysis, Insights and Forecast, 2020-2032
- 6.1. Market Analysis, Insights and Forecast - by Production Analysis
- 6.2. Market Analysis, Insights and Forecast - by Consumption Analysis
- 6.3. Market Analysis, Insights and Forecast - by Import Market Analysis (Value & Volume)
- 6.4. Market Analysis, Insights and Forecast - by Export Market Analysis (Value & Volume)
- 6.5. Market Analysis, Insights and Forecast - by Price Trend Analysis
- 6.1. Market Analysis, Insights and Forecast - by Production Analysis
- 7. United Kingdom Europe Rice Industry Analysis, Insights and Forecast, 2020-2032
- 7.1. Market Analysis, Insights and Forecast - by Production Analysis
- 7.2. Market Analysis, Insights and Forecast - by Consumption Analysis
- 7.3. Market Analysis, Insights and Forecast - by Import Market Analysis (Value & Volume)
- 7.4. Market Analysis, Insights and Forecast - by Export Market Analysis (Value & Volume)
- 7.5. Market Analysis, Insights and Forecast - by Price Trend Analysis
- 7.1. Market Analysis, Insights and Forecast - by Production Analysis
- 8. France Europe Rice Industry Analysis, Insights and Forecast, 2020-2032
- 8.1. Market Analysis, Insights and Forecast - by Production Analysis
- 8.2. Market Analysis, Insights and Forecast - by Consumption Analysis
- 8.3. Market Analysis, Insights and Forecast - by Import Market Analysis (Value & Volume)
- 8.4. Market Analysis, Insights and Forecast - by Export Market Analysis (Value & Volume)
- 8.5. Market Analysis, Insights and Forecast - by Price Trend Analysis
- 8.1. Market Analysis, Insights and Forecast - by Production Analysis
- 9. Italy Europe Rice Industry Analysis, Insights and Forecast, 2020-2032
- 9.1. Market Analysis, Insights and Forecast - by Production Analysis
- 9.2. Market Analysis, Insights and Forecast - by Consumption Analysis
- 9.3. Market Analysis, Insights and Forecast - by Import Market Analysis (Value & Volume)
- 9.4. Market Analysis, Insights and Forecast - by Export Market Analysis (Value & Volume)
- 9.5. Market Analysis, Insights and Forecast - by Price Trend Analysis
- 9.1. Market Analysis, Insights and Forecast - by Production Analysis
- 10. Germany Europe Rice Industry Analysis, Insights and Forecast, 2020-2032
- 10.1. Market Analysis, Insights and Forecast - by Production Analysis
- 10.2. Market Analysis, Insights and Forecast - by Consumption Analysis
- 10.3. Market Analysis, Insights and Forecast - by Import Market Analysis (Value & Volume)
- 10.4. Market Analysis, Insights and Forecast - by Export Market Analysis (Value & Volume)
- 10.5. Market Analysis, Insights and Forecast - by Price Trend Analysis
- 10.1. Market Analysis, Insights and Forecast - by Production Analysis
- 11. Spain Europe Rice Industry Analysis, Insights and Forecast, 2020-2032
- 11.1. Market Analysis, Insights and Forecast - by Production Analysis
- 11.2. Market Analysis, Insights and Forecast - by Consumption Analysis
- 11.3. Market Analysis, Insights and Forecast - by Import Market Analysis (Value & Volume)
- 11.4. Market Analysis, Insights and Forecast - by Export Market Analysis (Value & Volume)
- 11.5. Market Analysis, Insights and Forecast - by Price Trend Analysis
- 11.1. Market Analysis, Insights and Forecast - by Production Analysis
- 12. Competitive Analysis
- 12.1. Market Share Analysis 2025
- 12.2. Company Profiles
- 12.2.1 BASF
- 12.2.1.1. Overview
- 12.2.1.2. Products
- 12.2.1.3. SWOT Analysis
- 12.2.1.4. Recent Developments
- 12.2.1.5. Financials (Based on Availability)
- 12.2.2 Corteva Agriscience
- 12.2.2.1. Overview
- 12.2.2.2. Products
- 12.2.2.3. SWOT Analysis
- 12.2.2.4. Recent Developments
- 12.2.2.5. Financials (Based on Availability)
- 12.2.3 Syngenta
- 12.2.3.1. Overview
- 12.2.3.2. Products
- 12.2.3.3. SWOT Analysis
- 12.2.3.4. Recent Developments
- 12.2.3.5. Financials (Based on Availability)
- 12.2.4 Bayer CropScience
- 12.2.4.1. Overview
- 12.2.4.2. Products
- 12.2.4.3. SWOT Analysis
- 12.2.4.4. Recent Developments
- 12.2.4.5. Financials (Based on Availability)
- 12.2.5 Rallis India
- 12.2.5.1. Overview
- 12.2.5.2. Products
- 12.2.5.3. SWOT Analysis
- 12.2.5.4. Recent Developments
- 12.2.5.5. Financials (Based on Availability)
- 12.2.1 BASF
List of Figures
- Figure 1: Europe Rice Industry Revenue Breakdown (Million, %) by Product 2025 & 2033
- Figure 2: Europe Rice Industry Share (%) by Company 2025
List of Tables
- Table 1: Europe Rice Industry Revenue Million Forecast, by Production Analysis 2020 & 2033
- Table 2: Europe Rice Industry Volume Kiloton Forecast, by Production Analysis 2020 & 2033
- Table 3: Europe Rice Industry Revenue Million Forecast, by Consumption Analysis 2020 & 2033
- Table 4: Europe Rice Industry Volume Kiloton Forecast, by Consumption Analysis 2020 & 2033
- Table 5: Europe Rice Industry Revenue Million Forecast, by Import Market Analysis (Value & Volume) 2020 & 2033
- Table 6: Europe Rice Industry Volume Kiloton Forecast, by Import Market Analysis (Value & Volume) 2020 & 2033
- Table 7: Europe Rice Industry Revenue Million Forecast, by Export Market Analysis (Value & Volume) 2020 & 2033
- Table 8: Europe Rice Industry Volume Kiloton Forecast, by Export Market Analysis (Value & Volume) 2020 & 2033
- Table 9: Europe Rice Industry Revenue Million Forecast, by Price Trend Analysis 2020 & 2033
- Table 10: Europe Rice Industry Volume Kiloton Forecast, by Price Trend Analysis 2020 & 2033
- Table 11: Europe Rice Industry Revenue Million Forecast, by Region 2020 & 2033
- Table 12: Europe Rice Industry Volume Kiloton Forecast, by Region 2020 & 2033
- Table 13: Europe Rice Industry Revenue Million Forecast, by Production Analysis 2020 & 2033
- Table 14: Europe Rice Industry Volume Kiloton Forecast, by Production Analysis 2020 & 2033
- Table 15: Europe Rice Industry Revenue Million Forecast, by Consumption Analysis 2020 & 2033
- Table 16: Europe Rice Industry Volume Kiloton Forecast, by Consumption Analysis 2020 & 2033
- Table 17: Europe Rice Industry Revenue Million Forecast, by Import Market Analysis (Value & Volume) 2020 & 2033
- Table 18: Europe Rice Industry Volume Kiloton Forecast, by Import Market Analysis (Value & Volume) 2020 & 2033
- Table 19: Europe Rice Industry Revenue Million Forecast, by Export Market Analysis (Value & Volume) 2020 & 2033
- Table 20: Europe Rice Industry Volume Kiloton Forecast, by Export Market Analysis (Value & Volume) 2020 & 2033
- Table 21: Europe Rice Industry Revenue Million Forecast, by Price Trend Analysis 2020 & 2033
- Table 22: Europe Rice Industry Volume Kiloton Forecast, by Price Trend Analysis 2020 & 2033
- Table 23: Europe Rice Industry Revenue Million Forecast, by Country 2020 & 2033
- Table 24: Europe Rice Industry Volume Kiloton Forecast, by Country 2020 & 2033
- Table 25: Europe Rice Industry Revenue Million Forecast, by Production Analysis 2020 & 2033
- Table 26: Europe Rice Industry Volume Kiloton Forecast, by Production Analysis 2020 & 2033
- Table 27: Europe Rice Industry Revenue Million Forecast, by Consumption Analysis 2020 & 2033
- Table 28: Europe Rice Industry Volume Kiloton Forecast, by Consumption Analysis 2020 & 2033
- Table 29: Europe Rice Industry Revenue Million Forecast, by Import Market Analysis (Value & Volume) 2020 & 2033
- Table 30: Europe Rice Industry Volume Kiloton Forecast, by Import Market Analysis (Value & Volume) 2020 & 2033
- Table 31: Europe Rice Industry Revenue Million Forecast, by Export Market Analysis (Value & Volume) 2020 & 2033
- Table 32: Europe Rice Industry Volume Kiloton Forecast, by Export Market Analysis (Value & Volume) 2020 & 2033
- Table 33: Europe Rice Industry Revenue Million Forecast, by Price Trend Analysis 2020 & 2033
- Table 34: Europe Rice Industry Volume Kiloton Forecast, by Price Trend Analysis 2020 & 2033
- Table 35: Europe Rice Industry Revenue Million Forecast, by Country 2020 & 2033
- Table 36: Europe Rice Industry Volume Kiloton Forecast, by Country 2020 & 2033
- Table 37: Europe Rice Industry Revenue Million Forecast, by Production Analysis 2020 & 2033
- Table 38: Europe Rice Industry Volume Kiloton Forecast, by Production Analysis 2020 & 2033
- Table 39: Europe Rice Industry Revenue Million Forecast, by Consumption Analysis 2020 & 2033
- Table 40: Europe Rice Industry Volume Kiloton Forecast, by Consumption Analysis 2020 & 2033
- Table 41: Europe Rice Industry Revenue Million Forecast, by Import Market Analysis (Value & Volume) 2020 & 2033
- Table 42: Europe Rice Industry Volume Kiloton Forecast, by Import Market Analysis (Value & Volume) 2020 & 2033
- Table 43: Europe Rice Industry Revenue Million Forecast, by Export Market Analysis (Value & Volume) 2020 & 2033
- Table 44: Europe Rice Industry Volume Kiloton Forecast, by Export Market Analysis (Value & Volume) 2020 & 2033
- Table 45: Europe Rice Industry Revenue Million Forecast, by Price Trend Analysis 2020 & 2033
- Table 46: Europe Rice Industry Volume Kiloton Forecast, by Price Trend Analysis 2020 & 2033
- Table 47: Europe Rice Industry Revenue Million Forecast, by Country 2020 & 2033
- Table 48: Europe Rice Industry Volume Kiloton Forecast, by Country 2020 & 2033
- Table 49: Europe Rice Industry Revenue Million Forecast, by Production Analysis 2020 & 2033
- Table 50: Europe Rice Industry Volume Kiloton Forecast, by Production Analysis 2020 & 2033
- Table 51: Europe Rice Industry Revenue Million Forecast, by Consumption Analysis 2020 & 2033
- Table 52: Europe Rice Industry Volume Kiloton Forecast, by Consumption Analysis 2020 & 2033
- Table 53: Europe Rice Industry Revenue Million Forecast, by Import Market Analysis (Value & Volume) 2020 & 2033
- Table 54: Europe Rice Industry Volume Kiloton Forecast, by Import Market Analysis (Value & Volume) 2020 & 2033
- Table 55: Europe Rice Industry Revenue Million Forecast, by Export Market Analysis (Value & Volume) 2020 & 2033
- Table 56: Europe Rice Industry Volume Kiloton Forecast, by Export Market Analysis (Value & Volume) 2020 & 2033
- Table 57: Europe Rice Industry Revenue Million Forecast, by Price Trend Analysis 2020 & 2033
- Table 58: Europe Rice Industry Volume Kiloton Forecast, by Price Trend Analysis 2020 & 2033
- Table 59: Europe Rice Industry Revenue Million Forecast, by Country 2020 & 2033
- Table 60: Europe Rice Industry Volume Kiloton Forecast, by Country 2020 & 2033
- Table 61: Europe Rice Industry Revenue Million Forecast, by Production Analysis 2020 & 2033
- Table 62: Europe Rice Industry Volume Kiloton Forecast, by Production Analysis 2020 & 2033
- Table 63: Europe Rice Industry Revenue Million Forecast, by Consumption Analysis 2020 & 2033
- Table 64: Europe Rice Industry Volume Kiloton Forecast, by Consumption Analysis 2020 & 2033
- Table 65: Europe Rice Industry Revenue Million Forecast, by Import Market Analysis (Value & Volume) 2020 & 2033
- Table 66: Europe Rice Industry Volume Kiloton Forecast, by Import Market Analysis (Value & Volume) 2020 & 2033
- Table 67: Europe Rice Industry Revenue Million Forecast, by Export Market Analysis (Value & Volume) 2020 & 2033
- Table 68: Europe Rice Industry Volume Kiloton Forecast, by Export Market Analysis (Value & Volume) 2020 & 2033
- Table 69: Europe Rice Industry Revenue Million Forecast, by Price Trend Analysis 2020 & 2033
- Table 70: Europe Rice Industry Volume Kiloton Forecast, by Price Trend Analysis 2020 & 2033
- Table 71: Europe Rice Industry Revenue Million Forecast, by Country 2020 & 2033
- Table 72: Europe Rice Industry Volume Kiloton Forecast, by Country 2020 & 2033
- Table 73: Europe Rice Industry Revenue Million Forecast, by Production Analysis 2020 & 2033
- Table 74: Europe Rice Industry Volume Kiloton Forecast, by Production Analysis 2020 & 2033
- Table 75: Europe Rice Industry Revenue Million Forecast, by Consumption Analysis 2020 & 2033
- Table 76: Europe Rice Industry Volume Kiloton Forecast, by Consumption Analysis 2020 & 2033
- Table 77: Europe Rice Industry Revenue Million Forecast, by Import Market Analysis (Value & Volume) 2020 & 2033
- Table 78: Europe Rice Industry Volume Kiloton Forecast, by Import Market Analysis (Value & Volume) 2020 & 2033
- Table 79: Europe Rice Industry Revenue Million Forecast, by Export Market Analysis (Value & Volume) 2020 & 2033
- Table 80: Europe Rice Industry Volume Kiloton Forecast, by Export Market Analysis (Value & Volume) 2020 & 2033
- Table 81: Europe Rice Industry Revenue Million Forecast, by Price Trend Analysis 2020 & 2033
- Table 82: Europe Rice Industry Volume Kiloton Forecast, by Price Trend Analysis 2020 & 2033
- Table 83: Europe Rice Industry Revenue Million Forecast, by Country 2020 & 2033
- Table 84: Europe Rice Industry Volume Kiloton Forecast, by Country 2020 & 2033
Frequently Asked Questions
1. What is the projected Compound Annual Growth Rate (CAGR) of the Europe Rice Industry?
The projected CAGR is approximately 4.20%.
2. Which companies are prominent players in the Europe Rice Industry?
Key companies in the market include BASF , Corteva Agriscience , Syngenta, Bayer CropScience , Rallis India.
3. What are the main segments of the Europe Rice Industry?
The market segments include Production Analysis, Consumption Analysis, Import Market Analysis (Value & Volume), Export Market Analysis (Value & Volume), Price Trend Analysis.
4. Can you provide details about the market size?
The market size is estimated to be USD 729.50 Million as of 2022.
5. What are some drivers contributing to market growth?
Rising Consumption of Cashew Nuts in the Country; Favorable Government Initiatives.
6. What are the notable trends driving market growth?
Strong Demand in Northwestern Europe.
7. Are there any restraints impacting market growth?
Hazardous Climatic Condition Hinders Cashew Production; Stringent Regulations Related to Food Quality Standards.
8. Can you provide examples of recent developments in the market?
N/A
9. What pricing options are available for accessing the report?
Pricing options include single-user, multi-user, and enterprise licenses priced at USD 4750, USD 5250, and USD 8750 respectively.
10. Is the market size provided in terms of value or volume?
The market size is provided in terms of value, measured in Million and volume, measured in Kiloton.
11. Are there any specific market keywords associated with the report?
Yes, the market keyword associated with the report is "Europe Rice Industry," which aids in identifying and referencing the specific market segment covered.
12. How do I determine which pricing option suits my needs best?
The pricing options vary based on user requirements and access needs. Individual users may opt for single-user licenses, while businesses requiring broader access may choose multi-user or enterprise licenses for cost-effective access to the report.
13. Are there any additional resources or data provided in the Europe Rice Industry report?
While the report offers comprehensive insights, it's advisable to review the specific contents or supplementary materials provided to ascertain if additional resources or data are available.
14. How can I stay updated on further developments or reports in the Europe Rice Industry?
To stay informed about further developments, trends, and reports in the Europe Rice Industry, consider subscribing to industry newsletters, following relevant companies and organizations, or regularly checking reputable industry news sources and publications.
Methodology
Step 1 - Identification of Relevant Samples Size from Population Database


Step 2 - Approaches for Defining Global Market Size (Value, Volume* & Price*)

Note*: In applicable scenarios
Step 3 - Data Sources
Primary Research
- Web Analytics
- Survey Reports
- Research Institute
- Latest Research Reports
- Opinion Leaders
Secondary Research
- Annual Reports
- White Paper
- Latest Press Release
- Industry Association
- Paid Database
- Investor Presentations

Step 4 - Data Triangulation
Involves using different sources of information in order to increase the validity of a study
These sources are likely to be stakeholders in a program - participants, other researchers, program staff, other community members, and so on.
Then we put all data in single framework & apply various statistical tools to find out the dynamic on the market.
During the analysis stage, feedback from the stakeholder groups would be compared to determine areas of agreement as well as areas of divergence