

Key Insights
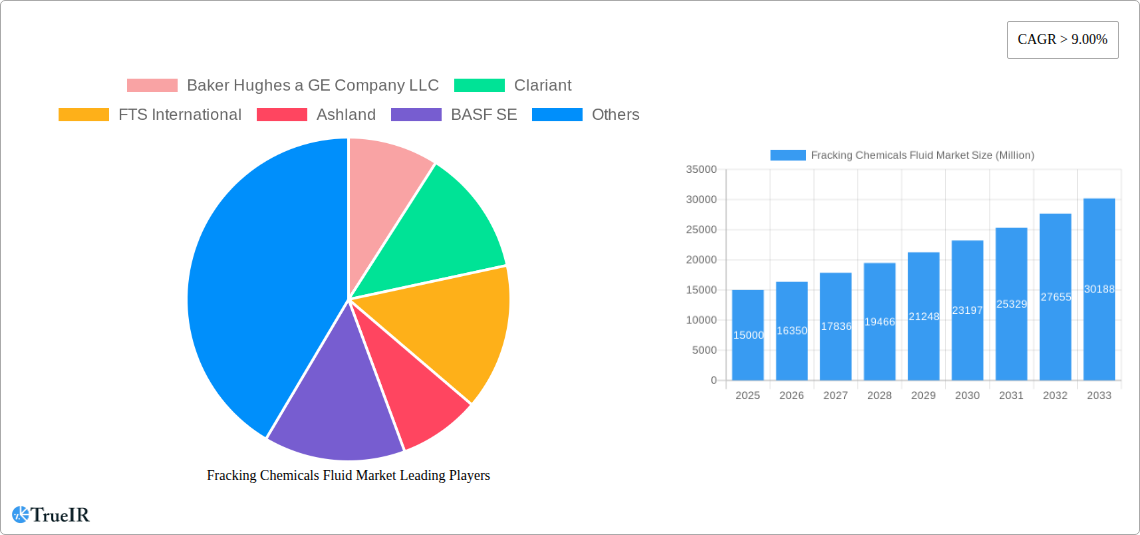
The global fracking chemicals fluid market is experiencing robust growth, driven by the increasing demand for oil and gas extraction, particularly in unconventional resources like shale gas and tight oil. The market's Compound Annual Growth Rate (CAGR) exceeding 9% from 2019-2033 signifies substantial expansion. Several factors contribute to this growth: the rising global energy consumption necessitating increased hydrocarbon production; technological advancements in hydraulic fracturing techniques leading to enhanced efficiency and reduced environmental impact; and the growing adoption of horizontal drilling, which necessitates larger volumes of fracking fluids. The market segmentation reveals significant opportunities across various fluid types, with water-based fluids maintaining a considerable share due to their cost-effectiveness and environmental considerations. However, the demand for high-performance fluids like slick water-based and synthetic-based fluids is also growing rapidly, driven by the need for improved efficiency and reduced formation damage. Different product types, such as borate cross-linked fluids and organometallic cross-linked fluids, cater to specific well conditions and geological formations, contributing to the market's diverse landscape. Furthermore, the varied functions of these chemicals, including friction reduction, corrosion inhibition, and scale prevention, highlight their crucial role in optimizing the entire fracking process. The geographical distribution of the market reflects the established oil and gas production hubs, with North America and Asia Pacific representing major regions of growth. Leading industry players, including Baker Hughes, Clariant, FTS International, and Schlumberger, are actively engaged in research and development, driving innovation and competition within the market. Challenges remain, including stricter environmental regulations and fluctuating oil and gas prices, which can influence investment decisions and market dynamics.
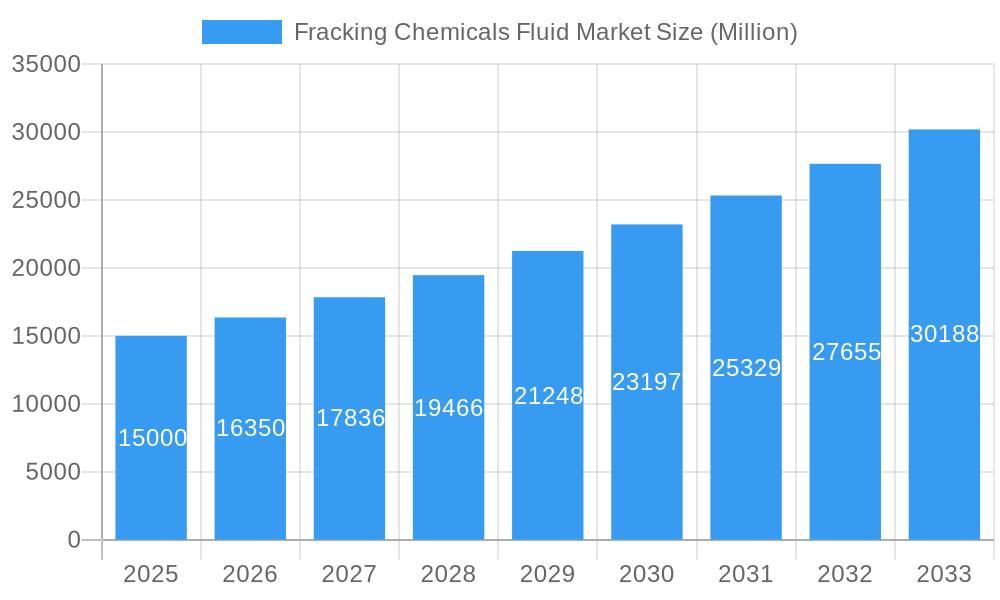
Fracking Chemicals Fluid Market Market Size (In Billion)
Despite these challenges, the long-term outlook for the fracking chemicals fluid market remains positive. The continuing exploration and development of unconventional resources, coupled with advancements in fluid technology, will likely drive further market expansion. The shift towards more sustainable and environmentally friendly fracking fluids is a significant trend, shaping future innovation and product development within the industry. Market players are investing heavily in research to develop environmentally responsible alternatives that minimize the environmental footprint of fracking operations. The increasing focus on improving operational efficiency and reducing costs will also continue to shape the market, encouraging the development of specialized fluids tailored to specific well conditions and geological formations. The expansion into emerging markets and the adoption of advanced fracturing techniques will also contribute to the sustained growth of this critical sector supporting global energy production.
Fracking Chemicals Fluid Market Company Market Share
Fracking Chemicals Fluid Market: A Comprehensive Report (2019-2033)
This dynamic report provides a detailed analysis of the global Fracking Chemicals Fluid market, offering invaluable insights for industry stakeholders, investors, and researchers. Covering the period from 2019 to 2033, with 2025 as the base year, this comprehensive study unravels market trends, competitive dynamics, and future growth prospects. The report leverages extensive data analysis and expert insights to deliver a clear and actionable understanding of this vital sector. The market is projected to reach xx Million by 2033, exhibiting a CAGR of xx% during the forecast period (2025-2033).
Fracking Chemicals Fluid Market Market Structure & Competitive Landscape
The global Fracking Chemicals Fluid market is characterized by a moderately concentrated landscape, with a handful of major players holding significant market share. The Herfindahl-Hirschman Index (HHI) is estimated at xx in 2025, indicating a moderately concentrated market. Key players such as Baker Hughes a GE Company LLC, Clariant, FTS International, Ashland, BASF SE, Weatherford, DuPont, Dow, SNP Inc, Halliburton, Schlumberger Limited, Chevron Phillips Chemical Company, Albemarle Corporation, and Calfrac Well Services Ltd. are constantly engaged in strategic initiatives, including mergers and acquisitions (M&A), to expand their market presence and product portfolios. The total value of M&A activities in the sector during 2019-2024 was approximately xx Million.
- Market Concentration: Moderate, with a few dominant players.
- Innovation Drivers: Technological advancements in fluid formulations, improved efficiency, and reduced environmental impact.
- Regulatory Impacts: Stringent environmental regulations influence product development and adoption.
- Product Substitutes: The emergence of eco-friendly alternatives is challenging the dominance of conventional fluids.
- End-User Segmentation: The market is segmented by oil and gas companies, mining companies, and others. The oil and gas sector accounts for the largest share, with xx Million in revenue in 2025.
- M&A Trends: Strategic acquisitions to expand product lines and geographical reach are prominent.
Fracking Chemicals Fluid Market Market Trends & Opportunities
The Fracking Chemicals Fluid market is experiencing significant growth driven by the increasing demand for shale gas and oil extraction globally. Technological advancements, such as the development of high-performance fluids, are further fueling market expansion. The shift towards environmentally friendly and sustainable fluid solutions is creating new opportunities. Competitive dynamics are intense, with companies focusing on innovation and cost optimization to maintain a competitive edge. The market size is estimated at xx Million in 2025 and is projected to reach xx Million by 2033. The market penetration rate for slick water-based fluids is approximately xx% in 2025, expected to increase to xx% by 2033.
The CAGR for the forecast period is estimated at xx%. The growth is predominantly driven by the increasing adoption of hydraulic fracturing techniques across various regions. Consumer preferences are shifting towards more environmentally friendly and efficient fluids.
Dominant Markets & Segments in Fracking Chemicals Fluid Market
North America currently holds the largest market share, driven by robust shale gas production. Within fluid types, slick water-based fluids dominate due to their cost-effectiveness and efficiency. In product types, conventional linear gels remain prevalent but are facing competition from newer alternatives. In terms of function, surfactant and gelling agents are the most widely used.
- Key Growth Drivers (North America):
- Extensive shale gas reserves.
- Supportive regulatory environment (although evolving).
- Well-established infrastructure for shale gas extraction.
- Dominant Segments: Slick water-based fluids (Fluid Type); Conventional linear gels (Product Type); Surfactants and gelling agents (Function); Oil and Gas (Application).
Fracking Chemicals Fluid Market Product Analysis
The market showcases a diverse range of products, categorized by fluid type (water-based, oil-based, synthetic-based, etc.), product type (linear gels, cross-linked fluids, etc.), and function (surfactants, biocides, etc.). Recent innovations focus on improving performance, reducing environmental impact, and enhancing operational efficiency. Products are tailored to specific geological conditions and well characteristics. The competitive advantage lies in the development of superior fluid formulations that optimize well productivity and minimize environmental risks.
Key Drivers, Barriers & Challenges in Fracking Chemicals Fluid Market
Key Drivers:
- Increased demand for shale gas and oil.
- Technological advancements leading to more efficient and environmentally friendly fluids.
- Government incentives and policies promoting domestic energy production.
Challenges & Restraints:
- Stringent environmental regulations and concerns about water contamination. This translates to approximately xx Million in compliance costs annually for the industry.
- Fluctuations in oil and gas prices impacting investment decisions.
- Supply chain disruptions and raw material price volatility.
Growth Drivers in the Fracking Chemicals Fluid Market Market
The primary growth drivers include rising global energy demand, technological advancements in hydraulic fracturing techniques, and increasing investments in oil and gas exploration and production. Government policies supporting domestic energy production and exploration also contribute to market growth. The development of eco-friendly and efficient fluid solutions further adds to the market's expansion.
Challenges Impacting Fracking Chemicals Fluid Market Growth
Challenges include stringent environmental regulations, supply chain disruptions leading to raw material scarcity, and intensifying competition among market players. Fluctuations in crude oil prices and the availability of suitable extraction sites further hinder market growth. The need for substantial investments in research and development to improve fluid efficiency and reduce environmental impacts also poses a challenge.
Key Players Shaping the Fracking Chemicals Fluid Market Market
- Baker Hughes a GE Company LLC
- Clariant
- FTS International
- Ashland
- BASF SE
- Weatherford
- DuPont
- Dow
- SNP Inc
- Halliburton
- Schlumberger Limited
- Chevron Phillips Chemical Company
- Albemarle Corporation
- Calfrac Well Services Ltd
Significant Fracking Chemicals Fluid Market Industry Milestones
- 2020: Introduction of a new generation of environmentally friendly fluids by several key players.
- 2022: Acquisition of a smaller fluid manufacturer by a major industry player, expanding its market share.
- 2023: Several new patents filed for innovative fluid formulations focused on enhanced performance and reduced environmental impact.
Future Outlook for Fracking Chemicals Fluid Market Market
The Fracking Chemicals Fluid market is poised for continued growth, driven by the increasing global demand for energy and technological advancements in shale gas extraction. Strategic partnerships, research and development investments, and a focus on sustainability will be key factors shaping the market's future trajectory. The market presents substantial opportunities for both established players and new entrants who can develop innovative and eco-friendly solutions to meet the ever-evolving needs of the industry.
Fracking Chemicals Fluid Market Segmentation
-
1. Fluid Type
- 1.1. Water Based
- 1.2. Foam Based
- 1.3. Gelled Oil-Based
- 1.4. Slick Water-Based
- 1.5. Synthetic Based
- 1.6. Others
-
2. Product Type
- 2.1. Conventional Linear Gels
- 2.2. Borate Cross-Linked Fluids
- 2.3. Organometallic Cross-Linked Fluids
- 2.4. Aluminium Phosphate Ester Oil Gels
-
3. Function
- 3.1. Surfactant
- 3.2. Scale Inhibitor
- 3.3. Friction Reducer
- 3.4. Corrosion Inhibitor
- 3.5. Biocide
- 3.6. Crosslinker
- 3.7. Gelling Agent
- 3.8. Others
-
4. Application
-
4.1. Oil and Gas
- 4.1.1. Oil Well
- 4.1.2. Shale Gas Well
- 4.1.3. Horizontal Well
- 4.2. Mining
- 4.3. Others
-
4.1. Oil and Gas
Fracking Chemicals Fluid Market Segmentation By Geography
-
1. Asia Pacific
- 1.1. China
- 1.2. India
- 1.3. Japan
- 1.4. South Korea
- 1.5. Rest of Asia Pacific
-
2. North America
- 2.1. United States
- 2.2. Canada
- 2.3. Mexico
-
3. Europe
- 3.1. Germany
- 3.2. United Kingdom
- 3.3. France
- 3.4. Italy
- 3.5. Rest of Europe
-
4. South America
- 4.1. Brazil
- 4.2. Argentina
- 4.3. Rest of South America
-
5. Middle East and Africa
- 5.1. Saudi Arabia
- 5.2. South Africa
- 5.3. Rest of Middle East and Africa
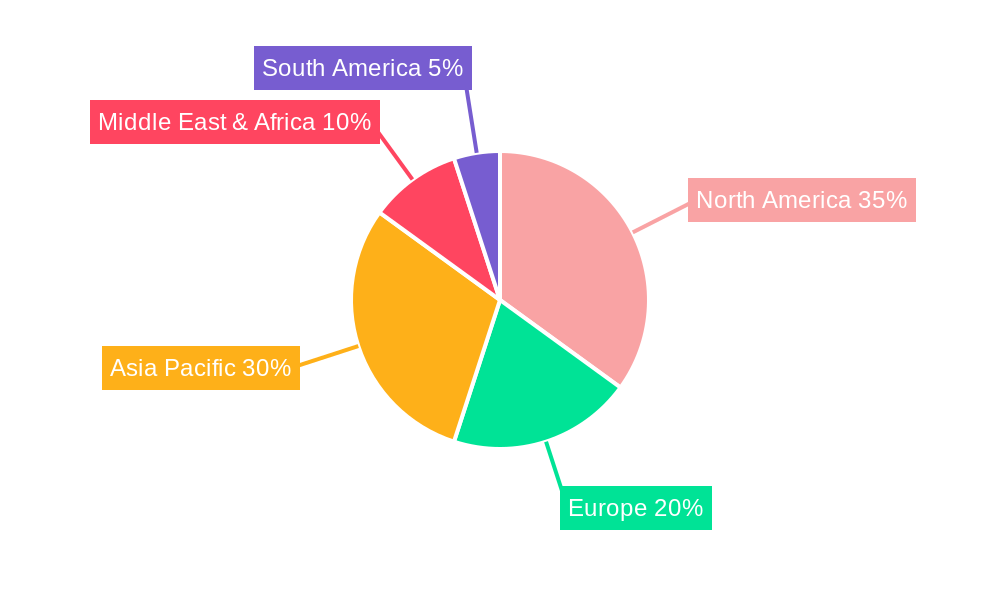
Fracking Chemicals Fluid Market Regional Market Share
Geographic Coverage of Fracking Chemicals Fluid Market
Fracking Chemicals Fluid Market REPORT HIGHLIGHTS
| Aspects | Details |
|---|---|
| Study Period | 2020-2034 |
| Base Year | 2025 |
| Estimated Year | 2026 |
| Forecast Period | 2026-2034 |
| Historical Period | 2020-2025 |
| Growth Rate | CAGR of 7.2% from 2020-2034 |
| Segmentation |
|
Table of Contents
- 1. Introduction
- 1.1. Research Scope
- 1.2. Market Segmentation
- 1.3. Research Objective
- 1.4. Definitions and Assumptions
- 2. Executive Summary
- 2.1. Market Snapshot
- 3. Market Dynamics
- 3.1. Market Drivers
- 3.2. Market Restrains
- 3.3. Market Trends
- 3.4. Market Opportunities
- 4. Market Factor Analysis
- 4.1. Porters Five Forces
- 4.1.1. Bargaining Power of Suppliers
- 4.1.2. Bargaining Power of Buyers
- 4.1.3. Threat of New Entrants
- 4.1.4. Threat of Substitutes
- 4.1.5. Competitive Rivalry
- 4.2. PESTEL analysis
- 4.3. BCG Analysis
- 4.3.1. Stars (High Growth, High Market Share)
- 4.3.2. Cash Cows (Low Growth, High Market Share)
- 4.3.3. Question Mark (High Growth, Low Market Share)
- 4.3.4. Dogs (Low Growth, Low Market Share)
- 4.4. Ansoff Matrix Analysis
- 4.5. Supply Chain Analysis
- 4.6. Regulatory Landscape
- 4.7. Current Market Potential and Opportunity Assessment (TAM–SAM–SOM Framework)
- 4.8. TIR Analyst Note
- 4.1. Porters Five Forces
- 5. Market Analysis, Insights and Forecast 2021-2033
- 5.1. Market Analysis, Insights and Forecast - by Fluid Type
- 5.1.1. Water Based
- 5.1.2. Foam Based
- 5.1.3. Gelled Oil-Based
- 5.1.4. Slick Water-Based
- 5.1.5. Synthetic Based
- 5.1.6. Others
- 5.2. Market Analysis, Insights and Forecast - by Product Type
- 5.2.1. Conventional Linear Gels
- 5.2.2. Borate Cross-Linked Fluids
- 5.2.3. Organometallic Cross-Linked Fluids
- 5.2.4. Aluminium Phosphate Ester Oil Gels
- 5.3. Market Analysis, Insights and Forecast - by Function
- 5.3.1. Surfactant
- 5.3.2. Scale Inhibitor
- 5.3.3. Friction Reducer
- 5.3.4. Corrosion Inhibitor
- 5.3.5. Biocide
- 5.3.6. Crosslinker
- 5.3.7. Gelling Agent
- 5.3.8. Others
- 5.4. Market Analysis, Insights and Forecast - by Application
- 5.4.1. Oil and Gas
- 5.4.1.1. Oil Well
- 5.4.1.2. Shale Gas Well
- 5.4.1.3. Horizontal Well
- 5.4.2. Mining
- 5.4.3. Others
- 5.4.1. Oil and Gas
- 5.5. Market Analysis, Insights and Forecast - by Region
- 5.5.1. Asia Pacific
- 5.5.2. North America
- 5.5.3. Europe
- 5.5.4. South America
- 5.5.5. Middle East and Africa
- 5.1. Market Analysis, Insights and Forecast - by Fluid Type
- 6. Global Fracking Chemicals Fluid Market Analysis, Insights and Forecast, 2021-2033
- 6.1. Market Analysis, Insights and Forecast - by Fluid Type
- 6.1.1. Water Based
- 6.1.2. Foam Based
- 6.1.3. Gelled Oil-Based
- 6.1.4. Slick Water-Based
- 6.1.5. Synthetic Based
- 6.1.6. Others
- 6.2. Market Analysis, Insights and Forecast - by Product Type
- 6.2.1. Conventional Linear Gels
- 6.2.2. Borate Cross-Linked Fluids
- 6.2.3. Organometallic Cross-Linked Fluids
- 6.2.4. Aluminium Phosphate Ester Oil Gels
- 6.3. Market Analysis, Insights and Forecast - by Function
- 6.3.1. Surfactant
- 6.3.2. Scale Inhibitor
- 6.3.3. Friction Reducer
- 6.3.4. Corrosion Inhibitor
- 6.3.5. Biocide
- 6.3.6. Crosslinker
- 6.3.7. Gelling Agent
- 6.3.8. Others
- 6.4. Market Analysis, Insights and Forecast - by Application
- 6.4.1. Oil and Gas
- 6.4.1.1. Oil Well
- 6.4.1.2. Shale Gas Well
- 6.4.1.3. Horizontal Well
- 6.4.2. Mining
- 6.4.3. Others
- 6.4.1. Oil and Gas
- 6.1. Market Analysis, Insights and Forecast - by Fluid Type
- 7. Asia Pacific Fracking Chemicals Fluid Market Analysis, Insights and Forecast, 2020-2032
- 7.1. Market Analysis, Insights and Forecast - by Fluid Type
- 7.1.1. Water Based
- 7.1.2. Foam Based
- 7.1.3. Gelled Oil-Based
- 7.1.4. Slick Water-Based
- 7.1.5. Synthetic Based
- 7.1.6. Others
- 7.2. Market Analysis, Insights and Forecast - by Product Type
- 7.2.1. Conventional Linear Gels
- 7.2.2. Borate Cross-Linked Fluids
- 7.2.3. Organometallic Cross-Linked Fluids
- 7.2.4. Aluminium Phosphate Ester Oil Gels
- 7.3. Market Analysis, Insights and Forecast - by Function
- 7.3.1. Surfactant
- 7.3.2. Scale Inhibitor
- 7.3.3. Friction Reducer
- 7.3.4. Corrosion Inhibitor
- 7.3.5. Biocide
- 7.3.6. Crosslinker
- 7.3.7. Gelling Agent
- 7.3.8. Others
- 7.4. Market Analysis, Insights and Forecast - by Application
- 7.4.1. Oil and Gas
- 7.4.1.1. Oil Well
- 7.4.1.2. Shale Gas Well
- 7.4.1.3. Horizontal Well
- 7.4.2. Mining
- 7.4.3. Others
- 7.4.1. Oil and Gas
- 7.1. Market Analysis, Insights and Forecast - by Fluid Type
- 8. North America Fracking Chemicals Fluid Market Analysis, Insights and Forecast, 2020-2032
- 8.1. Market Analysis, Insights and Forecast - by Fluid Type
- 8.1.1. Water Based
- 8.1.2. Foam Based
- 8.1.3. Gelled Oil-Based
- 8.1.4. Slick Water-Based
- 8.1.5. Synthetic Based
- 8.1.6. Others
- 8.2. Market Analysis, Insights and Forecast - by Product Type
- 8.2.1. Conventional Linear Gels
- 8.2.2. Borate Cross-Linked Fluids
- 8.2.3. Organometallic Cross-Linked Fluids
- 8.2.4. Aluminium Phosphate Ester Oil Gels
- 8.3. Market Analysis, Insights and Forecast - by Function
- 8.3.1. Surfactant
- 8.3.2. Scale Inhibitor
- 8.3.3. Friction Reducer
- 8.3.4. Corrosion Inhibitor
- 8.3.5. Biocide
- 8.3.6. Crosslinker
- 8.3.7. Gelling Agent
- 8.3.8. Others
- 8.4. Market Analysis, Insights and Forecast - by Application
- 8.4.1. Oil and Gas
- 8.4.1.1. Oil Well
- 8.4.1.2. Shale Gas Well
- 8.4.1.3. Horizontal Well
- 8.4.2. Mining
- 8.4.3. Others
- 8.4.1. Oil and Gas
- 8.1. Market Analysis, Insights and Forecast - by Fluid Type
- 9. Europe Fracking Chemicals Fluid Market Analysis, Insights and Forecast, 2020-2032
- 9.1. Market Analysis, Insights and Forecast - by Fluid Type
- 9.1.1. Water Based
- 9.1.2. Foam Based
- 9.1.3. Gelled Oil-Based
- 9.1.4. Slick Water-Based
- 9.1.5. Synthetic Based
- 9.1.6. Others
- 9.2. Market Analysis, Insights and Forecast - by Product Type
- 9.2.1. Conventional Linear Gels
- 9.2.2. Borate Cross-Linked Fluids
- 9.2.3. Organometallic Cross-Linked Fluids
- 9.2.4. Aluminium Phosphate Ester Oil Gels
- 9.3. Market Analysis, Insights and Forecast - by Function
- 9.3.1. Surfactant
- 9.3.2. Scale Inhibitor
- 9.3.3. Friction Reducer
- 9.3.4. Corrosion Inhibitor
- 9.3.5. Biocide
- 9.3.6. Crosslinker
- 9.3.7. Gelling Agent
- 9.3.8. Others
- 9.4. Market Analysis, Insights and Forecast - by Application
- 9.4.1. Oil and Gas
- 9.4.1.1. Oil Well
- 9.4.1.2. Shale Gas Well
- 9.4.1.3. Horizontal Well
- 9.4.2. Mining
- 9.4.3. Others
- 9.4.1. Oil and Gas
- 9.1. Market Analysis, Insights and Forecast - by Fluid Type
- 10. South America Fracking Chemicals Fluid Market Analysis, Insights and Forecast, 2020-2032
- 10.1. Market Analysis, Insights and Forecast - by Fluid Type
- 10.1.1. Water Based
- 10.1.2. Foam Based
- 10.1.3. Gelled Oil-Based
- 10.1.4. Slick Water-Based
- 10.1.5. Synthetic Based
- 10.1.6. Others
- 10.2. Market Analysis, Insights and Forecast - by Product Type
- 10.2.1. Conventional Linear Gels
- 10.2.2. Borate Cross-Linked Fluids
- 10.2.3. Organometallic Cross-Linked Fluids
- 10.2.4. Aluminium Phosphate Ester Oil Gels
- 10.3. Market Analysis, Insights and Forecast - by Function
- 10.3.1. Surfactant
- 10.3.2. Scale Inhibitor
- 10.3.3. Friction Reducer
- 10.3.4. Corrosion Inhibitor
- 10.3.5. Biocide
- 10.3.6. Crosslinker
- 10.3.7. Gelling Agent
- 10.3.8. Others
- 10.4. Market Analysis, Insights and Forecast - by Application
- 10.4.1. Oil and Gas
- 10.4.1.1. Oil Well
- 10.4.1.2. Shale Gas Well
- 10.4.1.3. Horizontal Well
- 10.4.2. Mining
- 10.4.3. Others
- 10.4.1. Oil and Gas
- 10.1. Market Analysis, Insights and Forecast - by Fluid Type
- 11. Middle East and Africa Fracking Chemicals Fluid Market Analysis, Insights and Forecast, 2020-2032
- 11.1. Market Analysis, Insights and Forecast - by Fluid Type
- 11.1.1. Water Based
- 11.1.2. Foam Based
- 11.1.3. Gelled Oil-Based
- 11.1.4. Slick Water-Based
- 11.1.5. Synthetic Based
- 11.1.6. Others
- 11.2. Market Analysis, Insights and Forecast - by Product Type
- 11.2.1. Conventional Linear Gels
- 11.2.2. Borate Cross-Linked Fluids
- 11.2.3. Organometallic Cross-Linked Fluids
- 11.2.4. Aluminium Phosphate Ester Oil Gels
- 11.3. Market Analysis, Insights and Forecast - by Function
- 11.3.1. Surfactant
- 11.3.2. Scale Inhibitor
- 11.3.3. Friction Reducer
- 11.3.4. Corrosion Inhibitor
- 11.3.5. Biocide
- 11.3.6. Crosslinker
- 11.3.7. Gelling Agent
- 11.3.8. Others
- 11.4. Market Analysis, Insights and Forecast - by Application
- 11.4.1. Oil and Gas
- 11.4.1.1. Oil Well
- 11.4.1.2. Shale Gas Well
- 11.4.1.3. Horizontal Well
- 11.4.2. Mining
- 11.4.3. Others
- 11.4.1. Oil and Gas
- 11.1. Market Analysis, Insights and Forecast - by Fluid Type
- 12. Competitive Analysis
- 12.1. Company Profiles
- 12.1.1 Baker Hughes a GE Company LLC
- 12.1.1.1. Company Overview
- 12.1.1.2. Products
- 12.1.1.3. Company Financials
- 12.1.1.4. SWOT Analysis
- 12.1.2 Clariant
- 12.1.2.1. Company Overview
- 12.1.2.2. Products
- 12.1.2.3. Company Financials
- 12.1.2.4. SWOT Analysis
- 12.1.3 FTS International
- 12.1.3.1. Company Overview
- 12.1.3.2. Products
- 12.1.3.3. Company Financials
- 12.1.3.4. SWOT Analysis
- 12.1.4 Ashland
- 12.1.4.1. Company Overview
- 12.1.4.2. Products
- 12.1.4.3. Company Financials
- 12.1.4.4. SWOT Analysis
- 12.1.5 BASF SE
- 12.1.5.1. Company Overview
- 12.1.5.2. Products
- 12.1.5.3. Company Financials
- 12.1.5.4. SWOT Analysis
- 12.1.6 Weatherford
- 12.1.6.1. Company Overview
- 12.1.6.2. Products
- 12.1.6.3. Company Financials
- 12.1.6.4. SWOT Analysis
- 12.1.7 DuPont
- 12.1.7.1. Company Overview
- 12.1.7.2. Products
- 12.1.7.3. Company Financials
- 12.1.7.4. SWOT Analysis
- 12.1.8 Dow
- 12.1.8.1. Company Overview
- 12.1.8.2. Products
- 12.1.8.3. Company Financials
- 12.1.8.4. SWOT Analysis
- 12.1.9 SNP Inc
- 12.1.9.1. Company Overview
- 12.1.9.2. Products
- 12.1.9.3. Company Financials
- 12.1.9.4. SWOT Analysis
- 12.1.10 Halliburton
- 12.1.10.1. Company Overview
- 12.1.10.2. Products
- 12.1.10.3. Company Financials
- 12.1.10.4. SWOT Analysis
- 12.1.11 Schlumberger Limited
- 12.1.11.1. Company Overview
- 12.1.11.2. Products
- 12.1.11.3. Company Financials
- 12.1.11.4. SWOT Analysis
- 12.1.12 Chevron PhillipsChemicalCompay*List Not Exhaustive
- 12.1.12.1. Company Overview
- 12.1.12.2. Products
- 12.1.12.3. Company Financials
- 12.1.12.4. SWOT Analysis
- 12.1.13 Albemarle Corporation
- 12.1.13.1. Company Overview
- 12.1.13.2. Products
- 12.1.13.3. Company Financials
- 12.1.13.4. SWOT Analysis
- 12.1.14 Calfrac Well Services Ltd
- 12.1.14.1. Company Overview
- 12.1.14.2. Products
- 12.1.14.3. Company Financials
- 12.1.14.4. SWOT Analysis
- 12.1.1 Baker Hughes a GE Company LLC
- 12.2. Market Entropy
- 12.2.1 Company's Key Areas Served
- 12.2.2 Recent Developments
- 12.3. Company Market Share Analysis 2025
- 12.3.1 Top 5 Companies Market Share Analysis
- 12.3.2 Top 3 Companies Market Share Analysis
- 12.4. List of Potential Customers
- 13. Research Methodology
List of Figures
- Figure 1: Global Fracking Chemicals Fluid Market Revenue Breakdown (billion, %) by Region 2025 & 2033
- Figure 2: Asia Pacific Fracking Chemicals Fluid Market Revenue (billion), by Fluid Type 2025 & 2033
- Figure 3: Asia Pacific Fracking Chemicals Fluid Market Revenue Share (%), by Fluid Type 2025 & 2033
- Figure 4: Asia Pacific Fracking Chemicals Fluid Market Revenue (billion), by Product Type 2025 & 2033
- Figure 5: Asia Pacific Fracking Chemicals Fluid Market Revenue Share (%), by Product Type 2025 & 2033
- Figure 6: Asia Pacific Fracking Chemicals Fluid Market Revenue (billion), by Function 2025 & 2033
- Figure 7: Asia Pacific Fracking Chemicals Fluid Market Revenue Share (%), by Function 2025 & 2033
- Figure 8: Asia Pacific Fracking Chemicals Fluid Market Revenue (billion), by Application 2025 & 2033
- Figure 9: Asia Pacific Fracking Chemicals Fluid Market Revenue Share (%), by Application 2025 & 2033
- Figure 10: Asia Pacific Fracking Chemicals Fluid Market Revenue (billion), by Country 2025 & 2033
- Figure 11: Asia Pacific Fracking Chemicals Fluid Market Revenue Share (%), by Country 2025 & 2033
- Figure 12: North America Fracking Chemicals Fluid Market Revenue (billion), by Fluid Type 2025 & 2033
- Figure 13: North America Fracking Chemicals Fluid Market Revenue Share (%), by Fluid Type 2025 & 2033
- Figure 14: North America Fracking Chemicals Fluid Market Revenue (billion), by Product Type 2025 & 2033
- Figure 15: North America Fracking Chemicals Fluid Market Revenue Share (%), by Product Type 2025 & 2033
- Figure 16: North America Fracking Chemicals Fluid Market Revenue (billion), by Function 2025 & 2033
- Figure 17: North America Fracking Chemicals Fluid Market Revenue Share (%), by Function 2025 & 2033
- Figure 18: North America Fracking Chemicals Fluid Market Revenue (billion), by Application 2025 & 2033
- Figure 19: North America Fracking Chemicals Fluid Market Revenue Share (%), by Application 2025 & 2033
- Figure 20: North America Fracking Chemicals Fluid Market Revenue (billion), by Country 2025 & 2033
- Figure 21: North America Fracking Chemicals Fluid Market Revenue Share (%), by Country 2025 & 2033
- Figure 22: Europe Fracking Chemicals Fluid Market Revenue (billion), by Fluid Type 2025 & 2033
- Figure 23: Europe Fracking Chemicals Fluid Market Revenue Share (%), by Fluid Type 2025 & 2033
- Figure 24: Europe Fracking Chemicals Fluid Market Revenue (billion), by Product Type 2025 & 2033
- Figure 25: Europe Fracking Chemicals Fluid Market Revenue Share (%), by Product Type 2025 & 2033
- Figure 26: Europe Fracking Chemicals Fluid Market Revenue (billion), by Function 2025 & 2033
- Figure 27: Europe Fracking Chemicals Fluid Market Revenue Share (%), by Function 2025 & 2033
- Figure 28: Europe Fracking Chemicals Fluid Market Revenue (billion), by Application 2025 & 2033
- Figure 29: Europe Fracking Chemicals Fluid Market Revenue Share (%), by Application 2025 & 2033
- Figure 30: Europe Fracking Chemicals Fluid Market Revenue (billion), by Country 2025 & 2033
- Figure 31: Europe Fracking Chemicals Fluid Market Revenue Share (%), by Country 2025 & 2033
- Figure 32: South America Fracking Chemicals Fluid Market Revenue (billion), by Fluid Type 2025 & 2033
- Figure 33: South America Fracking Chemicals Fluid Market Revenue Share (%), by Fluid Type 2025 & 2033
- Figure 34: South America Fracking Chemicals Fluid Market Revenue (billion), by Product Type 2025 & 2033
- Figure 35: South America Fracking Chemicals Fluid Market Revenue Share (%), by Product Type 2025 & 2033
- Figure 36: South America Fracking Chemicals Fluid Market Revenue (billion), by Function 2025 & 2033
- Figure 37: South America Fracking Chemicals Fluid Market Revenue Share (%), by Function 2025 & 2033
- Figure 38: South America Fracking Chemicals Fluid Market Revenue (billion), by Application 2025 & 2033
- Figure 39: South America Fracking Chemicals Fluid Market Revenue Share (%), by Application 2025 & 2033
- Figure 40: South America Fracking Chemicals Fluid Market Revenue (billion), by Country 2025 & 2033
- Figure 41: South America Fracking Chemicals Fluid Market Revenue Share (%), by Country 2025 & 2033
- Figure 42: Middle East and Africa Fracking Chemicals Fluid Market Revenue (billion), by Fluid Type 2025 & 2033
- Figure 43: Middle East and Africa Fracking Chemicals Fluid Market Revenue Share (%), by Fluid Type 2025 & 2033
- Figure 44: Middle East and Africa Fracking Chemicals Fluid Market Revenue (billion), by Product Type 2025 & 2033
- Figure 45: Middle East and Africa Fracking Chemicals Fluid Market Revenue Share (%), by Product Type 2025 & 2033
- Figure 46: Middle East and Africa Fracking Chemicals Fluid Market Revenue (billion), by Function 2025 & 2033
- Figure 47: Middle East and Africa Fracking Chemicals Fluid Market Revenue Share (%), by Function 2025 & 2033
- Figure 48: Middle East and Africa Fracking Chemicals Fluid Market Revenue (billion), by Application 2025 & 2033
- Figure 49: Middle East and Africa Fracking Chemicals Fluid Market Revenue Share (%), by Application 2025 & 2033
- Figure 50: Middle East and Africa Fracking Chemicals Fluid Market Revenue (billion), by Country 2025 & 2033
- Figure 51: Middle East and Africa Fracking Chemicals Fluid Market Revenue Share (%), by Country 2025 & 2033
List of Tables
- Table 1: Global Fracking Chemicals Fluid Market Revenue billion Forecast, by Fluid Type 2020 & 2033
- Table 2: Global Fracking Chemicals Fluid Market Revenue billion Forecast, by Product Type 2020 & 2033
- Table 3: Global Fracking Chemicals Fluid Market Revenue billion Forecast, by Function 2020 & 2033
- Table 4: Global Fracking Chemicals Fluid Market Revenue billion Forecast, by Application 2020 & 2033
- Table 5: Global Fracking Chemicals Fluid Market Revenue billion Forecast, by Region 2020 & 2033
- Table 6: Global Fracking Chemicals Fluid Market Revenue billion Forecast, by Fluid Type 2020 & 2033
- Table 7: Global Fracking Chemicals Fluid Market Revenue billion Forecast, by Product Type 2020 & 2033
- Table 8: Global Fracking Chemicals Fluid Market Revenue billion Forecast, by Function 2020 & 2033
- Table 9: Global Fracking Chemicals Fluid Market Revenue billion Forecast, by Application 2020 & 2033
- Table 10: Global Fracking Chemicals Fluid Market Revenue billion Forecast, by Country 2020 & 2033
- Table 11: China Fracking Chemicals Fluid Market Revenue (billion) Forecast, by Application 2020 & 2033
- Table 12: India Fracking Chemicals Fluid Market Revenue (billion) Forecast, by Application 2020 & 2033
- Table 13: Japan Fracking Chemicals Fluid Market Revenue (billion) Forecast, by Application 2020 & 2033
- Table 14: South Korea Fracking Chemicals Fluid Market Revenue (billion) Forecast, by Application 2020 & 2033
- Table 15: Rest of Asia Pacific Fracking Chemicals Fluid Market Revenue (billion) Forecast, by Application 2020 & 2033
- Table 16: Global Fracking Chemicals Fluid Market Revenue billion Forecast, by Fluid Type 2020 & 2033
- Table 17: Global Fracking Chemicals Fluid Market Revenue billion Forecast, by Product Type 2020 & 2033
- Table 18: Global Fracking Chemicals Fluid Market Revenue billion Forecast, by Function 2020 & 2033
- Table 19: Global Fracking Chemicals Fluid Market Revenue billion Forecast, by Application 2020 & 2033
- Table 20: Global Fracking Chemicals Fluid Market Revenue billion Forecast, by Country 2020 & 2033
- Table 21: United States Fracking Chemicals Fluid Market Revenue (billion) Forecast, by Application 2020 & 2033
- Table 22: Canada Fracking Chemicals Fluid Market Revenue (billion) Forecast, by Application 2020 & 2033
- Table 23: Mexico Fracking Chemicals Fluid Market Revenue (billion) Forecast, by Application 2020 & 2033
- Table 24: Global Fracking Chemicals Fluid Market Revenue billion Forecast, by Fluid Type 2020 & 2033
- Table 25: Global Fracking Chemicals Fluid Market Revenue billion Forecast, by Product Type 2020 & 2033
- Table 26: Global Fracking Chemicals Fluid Market Revenue billion Forecast, by Function 2020 & 2033
- Table 27: Global Fracking Chemicals Fluid Market Revenue billion Forecast, by Application 2020 & 2033
- Table 28: Global Fracking Chemicals Fluid Market Revenue billion Forecast, by Country 2020 & 2033
- Table 29: Germany Fracking Chemicals Fluid Market Revenue (billion) Forecast, by Application 2020 & 2033
- Table 30: United Kingdom Fracking Chemicals Fluid Market Revenue (billion) Forecast, by Application 2020 & 2033
- Table 31: France Fracking Chemicals Fluid Market Revenue (billion) Forecast, by Application 2020 & 2033
- Table 32: Italy Fracking Chemicals Fluid Market Revenue (billion) Forecast, by Application 2020 & 2033
- Table 33: Rest of Europe Fracking Chemicals Fluid Market Revenue (billion) Forecast, by Application 2020 & 2033
- Table 34: Global Fracking Chemicals Fluid Market Revenue billion Forecast, by Fluid Type 2020 & 2033
- Table 35: Global Fracking Chemicals Fluid Market Revenue billion Forecast, by Product Type 2020 & 2033
- Table 36: Global Fracking Chemicals Fluid Market Revenue billion Forecast, by Function 2020 & 2033
- Table 37: Global Fracking Chemicals Fluid Market Revenue billion Forecast, by Application 2020 & 2033
- Table 38: Global Fracking Chemicals Fluid Market Revenue billion Forecast, by Country 2020 & 2033
- Table 39: Brazil Fracking Chemicals Fluid Market Revenue (billion) Forecast, by Application 2020 & 2033
- Table 40: Argentina Fracking Chemicals Fluid Market Revenue (billion) Forecast, by Application 2020 & 2033
- Table 41: Rest of South America Fracking Chemicals Fluid Market Revenue (billion) Forecast, by Application 2020 & 2033
- Table 42: Global Fracking Chemicals Fluid Market Revenue billion Forecast, by Fluid Type 2020 & 2033
- Table 43: Global Fracking Chemicals Fluid Market Revenue billion Forecast, by Product Type 2020 & 2033
- Table 44: Global Fracking Chemicals Fluid Market Revenue billion Forecast, by Function 2020 & 2033
- Table 45: Global Fracking Chemicals Fluid Market Revenue billion Forecast, by Application 2020 & 2033
- Table 46: Global Fracking Chemicals Fluid Market Revenue billion Forecast, by Country 2020 & 2033
- Table 47: Saudi Arabia Fracking Chemicals Fluid Market Revenue (billion) Forecast, by Application 2020 & 2033
- Table 48: South Africa Fracking Chemicals Fluid Market Revenue (billion) Forecast, by Application 2020 & 2033
- Table 49: Rest of Middle East and Africa Fracking Chemicals Fluid Market Revenue (billion) Forecast, by Application 2020 & 2033
Frequently Asked Questions
1. What is the projected Compound Annual Growth Rate (CAGR) of the Fracking Chemicals Fluid Market?
The projected CAGR is approximately 7.2%.
2. Which companies are prominent players in the Fracking Chemicals Fluid Market?
Key companies in the market include Baker Hughes a GE Company LLC, Clariant, FTS International, Ashland, BASF SE, Weatherford, DuPont, Dow, SNP Inc, Halliburton, Schlumberger Limited, Chevron PhillipsChemicalCompay*List Not Exhaustive, Albemarle Corporation, Calfrac Well Services Ltd.
3. What are the main segments of the Fracking Chemicals Fluid Market?
The market segments include Fluid Type, Product Type, Function, Application.
4. Can you provide details about the market size?
The market size is estimated to be USD 46.9 billion as of 2022.
5. What are some drivers contributing to market growth?
; Growing Demand of Fracking Chemicals Fluid from Oil and Gas Industry; Other Drivers.
6. What are the notable trends driving market growth?
Growing Demand of Fracking Chemicals Fluid from Oil and Gas Industry.
7. Are there any restraints impacting market growth?
; Stringent Environmental and Governmental Regulations towards Fracking Fluids; Impact of COVID - 19.
8. Can you provide examples of recent developments in the market?
N/A
9. What pricing options are available for accessing the report?
Pricing options include single-user, multi-user, and enterprise licenses priced at USD 4750, USD 5250, and USD 8750 respectively.
10. Is the market size provided in terms of value or volume?
The market size is provided in terms of value, measured in billion.
11. Are there any specific market keywords associated with the report?
Yes, the market keyword associated with the report is "Fracking Chemicals Fluid Market," which aids in identifying and referencing the specific market segment covered.
12. How do I determine which pricing option suits my needs best?
The pricing options vary based on user requirements and access needs. Individual users may opt for single-user licenses, while businesses requiring broader access may choose multi-user or enterprise licenses for cost-effective access to the report.
13. Are there any additional resources or data provided in the Fracking Chemicals Fluid Market report?
While the report offers comprehensive insights, it's advisable to review the specific contents or supplementary materials provided to ascertain if additional resources or data are available.
14. How can I stay updated on further developments or reports in the Fracking Chemicals Fluid Market?
To stay informed about further developments, trends, and reports in the Fracking Chemicals Fluid Market, consider subscribing to industry newsletters, following relevant companies and organizations, or regularly checking reputable industry news sources and publications.
Methodology
Step 1 - Identification of Relevant Samples Size from Population Database


Step 2 - Approaches for Defining Global Market Size (Value, Volume* & Price*)

Note*: In applicable scenarios
Step 3 - Data Sources
Primary Research
- Web Analytics
- Survey Reports
- Research Institute
- Latest Research Reports
- Opinion Leaders
Secondary Research
- Annual Reports
- White Paper
- Latest Press Release
- Industry Association
- Paid Database
- Investor Presentations

Step 4 - Data Triangulation
Involves using different sources of information in order to increase the validity of a study
These sources are likely to be stakeholders in a program - participants, other researchers, program staff, other community members, and so on.
Then we put all data in single framework & apply various statistical tools to find out the dynamic on the market.
During the analysis stage, feedback from the stakeholder groups would be compared to determine areas of agreement as well as areas of divergence