

Key Insights
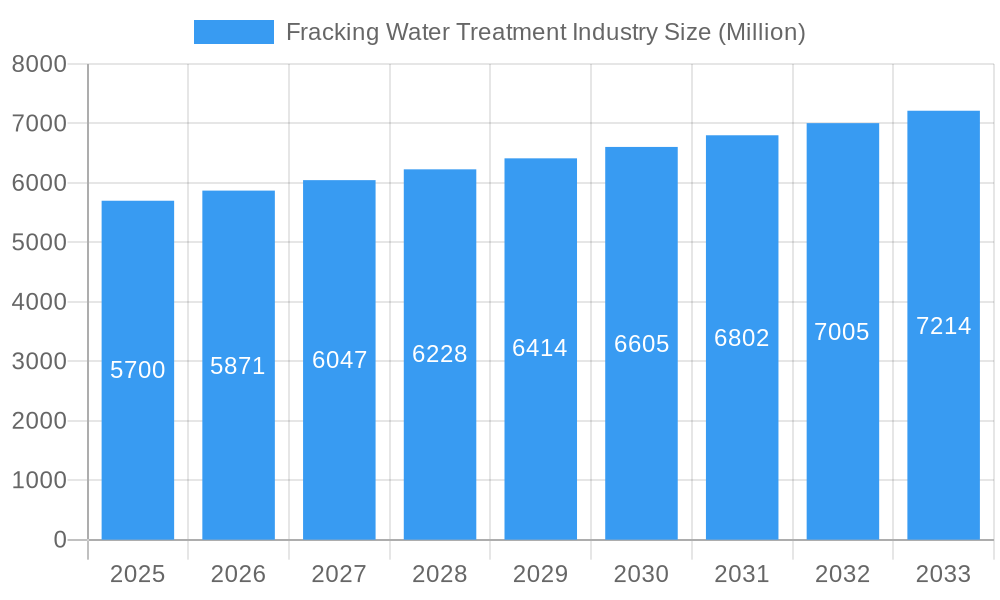
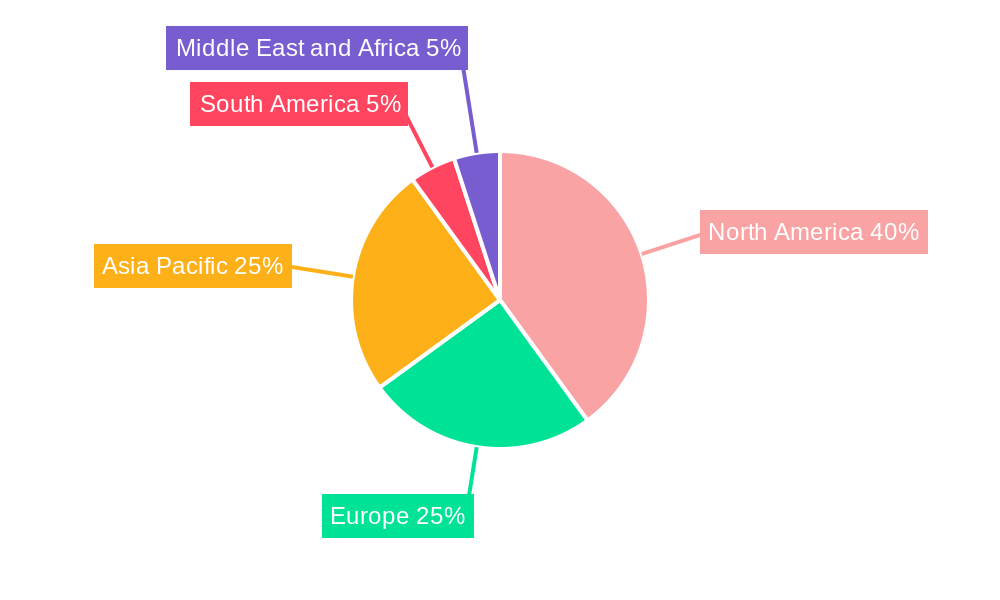
The fracking water treatment market, valued at $5.7 billion in 2025, is experiencing robust growth, projected to expand at a CAGR exceeding 3% from 2025 to 2033. This growth is driven by increasing shale gas and oil production globally, necessitating effective water treatment solutions to manage the large volumes of produced water generated during hydraulic fracturing. Stringent environmental regulations aimed at minimizing the environmental impact of fracking wastewater are also significantly contributing to market expansion. The industry is segmented by application, with treatment and recycle dominating due to rising awareness of water scarcity and the economic benefits of reusing treated water. Deep well injection, while a significant segment, faces increasing scrutiny and potential regulatory limitations, influencing market dynamics. Key players, including Filtra Systems, Aquatech International LLC, and Halliburton, are investing heavily in advanced technologies such as membrane filtration, reverse osmosis, and evaporation to meet evolving industry demands. The Asia-Pacific region, particularly China and India, exhibits significant growth potential driven by expanding shale gas exploration and production activities. North America maintains a substantial market share due to established fracking operations, while Europe and other regions are witnessing gradual growth, influenced by their respective regulatory landscapes and resource availability.
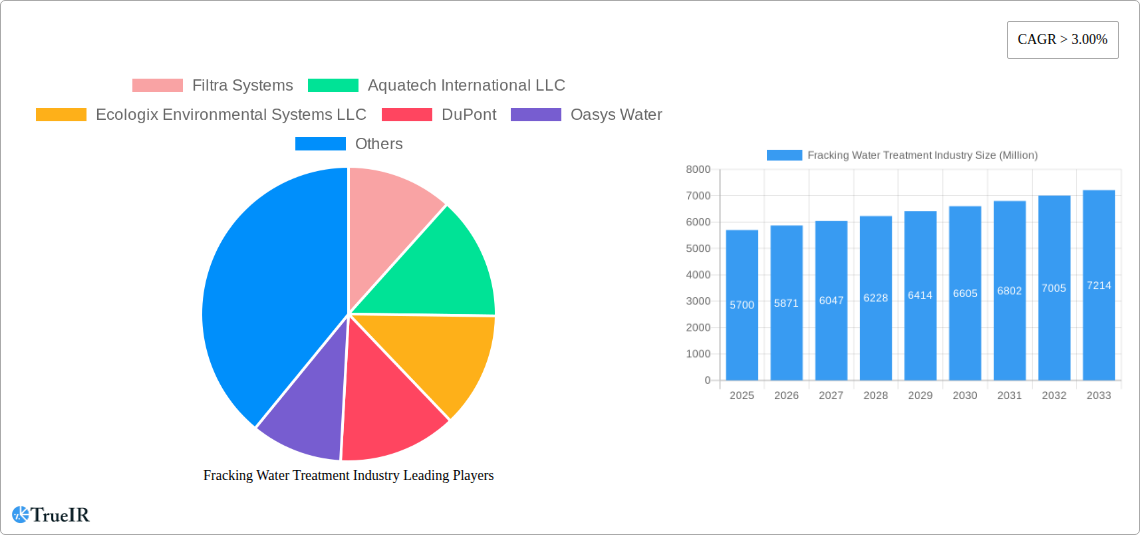
Fracking Water Treatment Industry Market Size (In Billion)
Technological advancements are shaping the market landscape. Companies are increasingly focusing on developing energy-efficient and cost-effective treatment technologies. The integration of advanced analytics and data-driven approaches for optimizing treatment processes and reducing operational costs is another key trend. However, the market faces challenges such as fluctuating oil and gas prices, which can impact investment decisions in fracking operations, and the potential for stricter regulations on wastewater disposal, creating uncertainty for market players. Despite these restraints, the long-term outlook for the fracking water treatment market remains positive, driven by the sustained demand for energy and the increasing importance of environmental stewardship. The industry’s ability to innovate and adapt to evolving regulations will be crucial in achieving continued growth and sustainability.
Fracking Water Treatment Industry Company Market Share
Fracking Water Treatment Industry Report: 2019-2033
This comprehensive report provides an in-depth analysis of the global fracking water treatment industry, offering crucial insights for stakeholders seeking to navigate this dynamic market. The study covers the period 2019-2033, with a focus on the estimated year 2025 and a forecast period of 2025-2033. The report leverages extensive market data, including key performance indicators such as CAGR and market penetration rates, and features in-depth profiles of major players, including Filtra Systems, Aquatech International LLC, Ecologix Environmental Systems LLC, DuPont, Oasys Water, Halliburton, Schlumberger Limited, Agua Dulce Technologies LLC, and Veolia Water Technologies. The xx Million market is experiencing significant transformation driven by technological advancements, regulatory shifts, and evolving environmental concerns. This report is essential for investors, industry professionals, and policymakers seeking a clear understanding of this crucial sector.
Fracking Water Treatment Industry Market Structure & Competitive Landscape
The fracking water treatment market exhibits a moderately consolidated structure, with a few large multinational corporations holding significant market share. The Herfindahl-Hirschman Index (HHI) for 2025 is estimated at xx, indicating a moderately concentrated market. Key players compete based on technological innovation, service offerings, and geographic reach. The market is characterized by both organic growth and inorganic expansion, with mergers and acquisitions (M&A) playing a significant role in shaping the competitive landscape. Between 2019 and 2024, an estimated xx million USD worth of M&A activity occurred, primarily driven by the desire to consolidate market share and access new technologies.
- Market Concentration: Moderate, with a Herfindahl-Hirschman Index (HHI) of xx in 2025.
- Innovation Drivers: Technological advancements in membrane filtration, advanced oxidation processes, and automation.
- Regulatory Impacts: Stringent environmental regulations drive demand for effective water treatment solutions.
- Product Substitutes: Limited viable substitutes exist, making the market relatively resilient to substitution.
- End-User Segmentation: Predominantly oil and gas companies, with increasing participation from independent water treatment service providers.
- M&A Trends: Significant M&A activity driven by market consolidation and technological acquisition.
Fracking Water Treatment Industry Market Trends & Opportunities
The global fracking water treatment market is projected to experience substantial growth, with a compound annual growth rate (CAGR) of xx% from 2025 to 2033, reaching an estimated market size of xx million USD by 2033. This growth is fueled by several factors, including the increasing adoption of hydraulic fracturing globally, stringent environmental regulations mandating efficient water treatment, and continuous technological advancements in water recycling and reuse technologies. The market penetration rate for advanced water treatment technologies is expected to increase from xx% in 2025 to xx% by 2033, reflecting a growing preference for sustainable and efficient solutions. Consumer preference is shifting towards environmentally friendly and cost-effective treatment options, further driving market growth. Competitive dynamics are characterized by a mix of established players and emerging innovators, leading to intense competition and continuous product development.
Dominant Markets & Segments in Fracking Water Treatment Industry
North America, particularly the United States, currently dominates the fracking water treatment market, holding approximately xx% of the global market share in 2025. This dominance is driven by the extensive shale gas production in the region and the stringent environmental regulations in place. The Treatment & Recycle segment represents the largest application area, accounting for xx% of the market in 2025.
Key Growth Drivers in North America:
- Abundant shale gas reserves.
- Stringent environmental regulations.
- Well-developed infrastructure.
- Significant government funding for research & development.
Key Growth Drivers in the Treatment & Recycle Segment:
- Growing awareness of water scarcity and the need for sustainable water management.
- Increasing cost-effectiveness of recycling and reuse technologies.
- Stricter regulations on wastewater discharge.
Detailed Analysis: The significant presence of major players in the US coupled with the considerable regulatory pressures creates a highly competitive yet growth-oriented market.
Fracking Water Treatment Industry Product Analysis
Technological advancements are driving product innovation within the fracking water treatment industry. Membrane filtration technologies, including reverse osmosis and ultrafiltration, are gaining popularity due to their effectiveness in removing contaminants. Advanced oxidation processes (AOPs) are also gaining traction for their ability to degrade recalcitrant organic pollutants. These technologies offer competitive advantages through improved water purification efficiency, reduced operational costs, and enhanced environmental compliance. The market is witnessing the introduction of integrated treatment systems combining several technologies for optimized performance.
Key Drivers, Barriers & Challenges in Fracking Water Treatment Industry
Key Drivers: Technological advancements (membrane filtration, AOPs, automation), increasing demand for environmentally friendly solutions, stringent government regulations, and rising energy prices pushing for water reuse and recycling. Government incentives, such as tax breaks and grants, for adopting sustainable technologies also fuel market growth.
Challenges: High initial investment costs for advanced treatment technologies can be a barrier to entry for smaller companies. Supply chain disruptions caused by geopolitical factors can impact the availability of key components. Regulatory complexities and inconsistent enforcement across different jurisdictions create uncertainty and add to operational costs.
Growth Drivers in the Fracking Water Treatment Industry Market
Technological advancements, such as the development of more efficient and cost-effective membrane filtration systems and advanced oxidation processes, significantly drive market growth. Stringent environmental regulations, coupled with increasing public awareness of water pollution, further propel the adoption of advanced water treatment technologies. Furthermore, economic incentives such as government subsidies and tax breaks for sustainable water management practices contribute to market expansion.
Challenges Impacting Fracking Water Treatment Industry Growth
High capital expenditures for advanced treatment plants pose a significant barrier to entry, especially for smaller companies. The fluctuating prices of raw materials and chemicals used in treatment processes create cost uncertainties. Furthermore, complexities in obtaining environmental permits and navigating regulatory requirements can delay project implementation and increase operational costs.
Key Players Shaping the Fracking Water Treatment Industry Market
- Filtra Systems
- Aquatech International LLC
- Ecologix Environmental Systems LLC
- DuPont
- Oasys Water
- Halliburton
- Schlumberger Limited
- Agua Dulce Technologies LLC
- Veolia Water Technologies
Significant Fracking Water Treatment Industry Industry Milestones
- 2020: Several major players announced partnerships to develop innovative membrane filtration technologies for enhanced water purification.
- 2021: The US government announced a xx million USD funding program for research and development of sustainable water treatment solutions for the oil and gas industry.
- 2022: Significant adoption of automation and digitalization in water treatment plants across North America, resulting in improved efficiency and cost reduction.
- 2023: Increased focus on membrane technologies, with several new product launches in the market.
Future Outlook for Fracking Water Treatment Industry Market
The fracking water treatment market is poised for continued growth, driven by a combination of technological advancements, stricter environmental regulations, and a growing emphasis on sustainable water management practices. The increasing demand for recycled water in fracking operations will create significant opportunities for innovative companies offering advanced treatment solutions. The market will likely witness further consolidation through mergers and acquisitions as larger players seek to expand their market share and gain access to new technologies.
Fracking Water Treatment Industry Segmentation
-
1. Application
- 1.1. Treatment & Recycle
- 1.2. Deep well Injection
Fracking Water Treatment Industry Segmentation By Geography
-
1. Asia Pacific
- 1.1. China
- 1.2. India
- 1.3. Japan
- 1.4. South Korea
- 1.5. Rest of Asia Pacific
-
2. North America
- 2.1. United States
- 2.2. Canada
- 2.3. Mexico
-
3. Europe
- 3.1. Germany
- 3.2. United Kingdom
- 3.3. France
- 3.4. Italy
- 3.5. Rest of Europe
-
4. South America
- 4.1. Brazil
- 4.2. Argentina
- 4.3. Rest of South America
-
5. Middle East and Africa
- 5.1. Saudi Arabia
- 5.2. South Africa
- 5.3. Rest of Middle East and Africa
Fracking Water Treatment Industry Regional Market Share
Geographic Coverage of Fracking Water Treatment Industry
Fracking Water Treatment Industry REPORT HIGHLIGHTS
| Aspects | Details |
|---|---|
| Study Period | 2020-2034 |
| Base Year | 2025 |
| Estimated Year | 2026 |
| Forecast Period | 2026-2034 |
| Historical Period | 2020-2025 |
| Growth Rate | CAGR of > 3.00% from 2020-2034 |
| Segmentation |
|
Table of Contents
- 1. Introduction
- 1.1. Research Scope
- 1.2. Market Segmentation
- 1.3. Research Objective
- 1.4. Definitions and Assumptions
- 2. Executive Summary
- 2.1. Market Snapshot
- 3. Market Dynamics
- 3.1. Market Drivers
- 3.2. Market Restrains
- 3.3. Market Trends
- 3.4. Market Opportunities
- 4. Market Factor Analysis
- 4.1. Porters Five Forces
- 4.1.1. Bargaining Power of Suppliers
- 4.1.2. Bargaining Power of Buyers
- 4.1.3. Threat of New Entrants
- 4.1.4. Threat of Substitutes
- 4.1.5. Competitive Rivalry
- 4.2. PESTEL analysis
- 4.3. BCG Analysis
- 4.3.1. Stars (High Growth, High Market Share)
- 4.3.2. Cash Cows (Low Growth, High Market Share)
- 4.3.3. Question Mark (High Growth, Low Market Share)
- 4.3.4. Dogs (Low Growth, Low Market Share)
- 4.4. Ansoff Matrix Analysis
- 4.5. Supply Chain Analysis
- 4.6. Regulatory Landscape
- 4.7. Current Market Potential and Opportunity Assessment (TAM–SAM–SOM Framework)
- 4.8. TIR Analyst Note
- 4.1. Porters Five Forces
- 5. Market Analysis, Insights and Forecast 2021-2033
- 5.1. Market Analysis, Insights and Forecast - by Application
- 5.1.1. Treatment & Recycle
- 5.1.2. Deep well Injection
- 5.2. Market Analysis, Insights and Forecast - by Region
- 5.2.1. Asia Pacific
- 5.2.2. North America
- 5.2.3. Europe
- 5.2.4. South America
- 5.2.5. Middle East and Africa
- 5.1. Market Analysis, Insights and Forecast - by Application
- 6. Global Fracking Water Treatment Industry Analysis, Insights and Forecast, 2021-2033
- 6.1. Market Analysis, Insights and Forecast - by Application
- 6.1.1. Treatment & Recycle
- 6.1.2. Deep well Injection
- 6.1. Market Analysis, Insights and Forecast - by Application
- 7. Asia Pacific Fracking Water Treatment Industry Analysis, Insights and Forecast, 2020-2032
- 7.1. Market Analysis, Insights and Forecast - by Application
- 7.1.1. Treatment & Recycle
- 7.1.2. Deep well Injection
- 7.1. Market Analysis, Insights and Forecast - by Application
- 8. North America Fracking Water Treatment Industry Analysis, Insights and Forecast, 2020-2032
- 8.1. Market Analysis, Insights and Forecast - by Application
- 8.1.1. Treatment & Recycle
- 8.1.2. Deep well Injection
- 8.1. Market Analysis, Insights and Forecast - by Application
- 9. Europe Fracking Water Treatment Industry Analysis, Insights and Forecast, 2020-2032
- 9.1. Market Analysis, Insights and Forecast - by Application
- 9.1.1. Treatment & Recycle
- 9.1.2. Deep well Injection
- 9.1. Market Analysis, Insights and Forecast - by Application
- 10. South America Fracking Water Treatment Industry Analysis, Insights and Forecast, 2020-2032
- 10.1. Market Analysis, Insights and Forecast - by Application
- 10.1.1. Treatment & Recycle
- 10.1.2. Deep well Injection
- 10.1. Market Analysis, Insights and Forecast - by Application
- 11. Middle East and Africa Fracking Water Treatment Industry Analysis, Insights and Forecast, 2020-2032
- 11.1. Market Analysis, Insights and Forecast - by Application
- 11.1.1. Treatment & Recycle
- 11.1.2. Deep well Injection
- 11.1. Market Analysis, Insights and Forecast - by Application
- 12. Competitive Analysis
- 12.1. Company Profiles
- 12.1.1 Filtra Systems
- 12.1.1.1. Company Overview
- 12.1.1.2. Products
- 12.1.1.3. Company Financials
- 12.1.1.4. SWOT Analysis
- 12.1.2 Aquatech International LLC
- 12.1.2.1. Company Overview
- 12.1.2.2. Products
- 12.1.2.3. Company Financials
- 12.1.2.4. SWOT Analysis
- 12.1.3 Ecologix Environmental Systems LLC
- 12.1.3.1. Company Overview
- 12.1.3.2. Products
- 12.1.3.3. Company Financials
- 12.1.3.4. SWOT Analysis
- 12.1.4 DuPont
- 12.1.4.1. Company Overview
- 12.1.4.2. Products
- 12.1.4.3. Company Financials
- 12.1.4.4. SWOT Analysis
- 12.1.5 Oasys Water
- 12.1.5.1. Company Overview
- 12.1.5.2. Products
- 12.1.5.3. Company Financials
- 12.1.5.4. SWOT Analysis
- 12.1.6 Halliburton
- 12.1.6.1. Company Overview
- 12.1.6.2. Products
- 12.1.6.3. Company Financials
- 12.1.6.4. SWOT Analysis
- 12.1.7 Schlumberger Limited
- 12.1.7.1. Company Overview
- 12.1.7.2. Products
- 12.1.7.3. Company Financials
- 12.1.7.4. SWOT Analysis
- 12.1.8 Agua Dulce Technologies LLC
- 12.1.8.1. Company Overview
- 12.1.8.2. Products
- 12.1.8.3. Company Financials
- 12.1.8.4. SWOT Analysis
- 12.1.9 Veolia Water Technologies*List Not Exhaustive
- 12.1.9.1. Company Overview
- 12.1.9.2. Products
- 12.1.9.3. Company Financials
- 12.1.9.4. SWOT Analysis
- 12.1.10 Filtra Systems
- 12.1.10.1. Company Overview
- 12.1.10.2. Products
- 12.1.10.3. Company Financials
- 12.1.10.4. SWOT Analysis
- 12.1.1 Filtra Systems
- 12.2. Market Entropy
- 12.2.1 Company's Key Areas Served
- 12.2.2 Recent Developments
- 12.3. Company Market Share Analysis 2025
- 12.3.1 Top 5 Companies Market Share Analysis
- 12.3.2 Top 3 Companies Market Share Analysis
- 12.4. List of Potential Customers
- 13. Research Methodology
List of Figures
- Figure 1: Global Fracking Water Treatment Industry Revenue Breakdown (Million, %) by Region 2025 & 2033
- Figure 2: Global Fracking Water Treatment Industry Volume Breakdown (liter , %) by Region 2025 & 2033
- Figure 3: Asia Pacific Fracking Water Treatment Industry Revenue (Million), by Application 2025 & 2033
- Figure 4: Asia Pacific Fracking Water Treatment Industry Volume (liter ), by Application 2025 & 2033
- Figure 5: Asia Pacific Fracking Water Treatment Industry Revenue Share (%), by Application 2025 & 2033
- Figure 6: Asia Pacific Fracking Water Treatment Industry Volume Share (%), by Application 2025 & 2033
- Figure 7: Asia Pacific Fracking Water Treatment Industry Revenue (Million), by Country 2025 & 2033
- Figure 8: Asia Pacific Fracking Water Treatment Industry Volume (liter ), by Country 2025 & 2033
- Figure 9: Asia Pacific Fracking Water Treatment Industry Revenue Share (%), by Country 2025 & 2033
- Figure 10: Asia Pacific Fracking Water Treatment Industry Volume Share (%), by Country 2025 & 2033
- Figure 11: North America Fracking Water Treatment Industry Revenue (Million), by Application 2025 & 2033
- Figure 12: North America Fracking Water Treatment Industry Volume (liter ), by Application 2025 & 2033
- Figure 13: North America Fracking Water Treatment Industry Revenue Share (%), by Application 2025 & 2033
- Figure 14: North America Fracking Water Treatment Industry Volume Share (%), by Application 2025 & 2033
- Figure 15: North America Fracking Water Treatment Industry Revenue (Million), by Country 2025 & 2033
- Figure 16: North America Fracking Water Treatment Industry Volume (liter ), by Country 2025 & 2033
- Figure 17: North America Fracking Water Treatment Industry Revenue Share (%), by Country 2025 & 2033
- Figure 18: North America Fracking Water Treatment Industry Volume Share (%), by Country 2025 & 2033
- Figure 19: Europe Fracking Water Treatment Industry Revenue (Million), by Application 2025 & 2033
- Figure 20: Europe Fracking Water Treatment Industry Volume (liter ), by Application 2025 & 2033
- Figure 21: Europe Fracking Water Treatment Industry Revenue Share (%), by Application 2025 & 2033
- Figure 22: Europe Fracking Water Treatment Industry Volume Share (%), by Application 2025 & 2033
- Figure 23: Europe Fracking Water Treatment Industry Revenue (Million), by Country 2025 & 2033
- Figure 24: Europe Fracking Water Treatment Industry Volume (liter ), by Country 2025 & 2033
- Figure 25: Europe Fracking Water Treatment Industry Revenue Share (%), by Country 2025 & 2033
- Figure 26: Europe Fracking Water Treatment Industry Volume Share (%), by Country 2025 & 2033
- Figure 27: South America Fracking Water Treatment Industry Revenue (Million), by Application 2025 & 2033
- Figure 28: South America Fracking Water Treatment Industry Volume (liter ), by Application 2025 & 2033
- Figure 29: South America Fracking Water Treatment Industry Revenue Share (%), by Application 2025 & 2033
- Figure 30: South America Fracking Water Treatment Industry Volume Share (%), by Application 2025 & 2033
- Figure 31: South America Fracking Water Treatment Industry Revenue (Million), by Country 2025 & 2033
- Figure 32: South America Fracking Water Treatment Industry Volume (liter ), by Country 2025 & 2033
- Figure 33: South America Fracking Water Treatment Industry Revenue Share (%), by Country 2025 & 2033
- Figure 34: South America Fracking Water Treatment Industry Volume Share (%), by Country 2025 & 2033
- Figure 35: Middle East and Africa Fracking Water Treatment Industry Revenue (Million), by Application 2025 & 2033
- Figure 36: Middle East and Africa Fracking Water Treatment Industry Volume (liter ), by Application 2025 & 2033
- Figure 37: Middle East and Africa Fracking Water Treatment Industry Revenue Share (%), by Application 2025 & 2033
- Figure 38: Middle East and Africa Fracking Water Treatment Industry Volume Share (%), by Application 2025 & 2033
- Figure 39: Middle East and Africa Fracking Water Treatment Industry Revenue (Million), by Country 2025 & 2033
- Figure 40: Middle East and Africa Fracking Water Treatment Industry Volume (liter ), by Country 2025 & 2033
- Figure 41: Middle East and Africa Fracking Water Treatment Industry Revenue Share (%), by Country 2025 & 2033
- Figure 42: Middle East and Africa Fracking Water Treatment Industry Volume Share (%), by Country 2025 & 2033
List of Tables
- Table 1: Global Fracking Water Treatment Industry Revenue Million Forecast, by Application 2020 & 2033
- Table 2: Global Fracking Water Treatment Industry Volume liter Forecast, by Application 2020 & 2033
- Table 3: Global Fracking Water Treatment Industry Revenue Million Forecast, by Region 2020 & 2033
- Table 4: Global Fracking Water Treatment Industry Volume liter Forecast, by Region 2020 & 2033
- Table 5: Global Fracking Water Treatment Industry Revenue Million Forecast, by Application 2020 & 2033
- Table 6: Global Fracking Water Treatment Industry Volume liter Forecast, by Application 2020 & 2033
- Table 7: Global Fracking Water Treatment Industry Revenue Million Forecast, by Country 2020 & 2033
- Table 8: Global Fracking Water Treatment Industry Volume liter Forecast, by Country 2020 & 2033
- Table 9: China Fracking Water Treatment Industry Revenue (Million) Forecast, by Application 2020 & 2033
- Table 10: China Fracking Water Treatment Industry Volume (liter ) Forecast, by Application 2020 & 2033
- Table 11: India Fracking Water Treatment Industry Revenue (Million) Forecast, by Application 2020 & 2033
- Table 12: India Fracking Water Treatment Industry Volume (liter ) Forecast, by Application 2020 & 2033
- Table 13: Japan Fracking Water Treatment Industry Revenue (Million) Forecast, by Application 2020 & 2033
- Table 14: Japan Fracking Water Treatment Industry Volume (liter ) Forecast, by Application 2020 & 2033
- Table 15: South Korea Fracking Water Treatment Industry Revenue (Million) Forecast, by Application 2020 & 2033
- Table 16: South Korea Fracking Water Treatment Industry Volume (liter ) Forecast, by Application 2020 & 2033
- Table 17: Rest of Asia Pacific Fracking Water Treatment Industry Revenue (Million) Forecast, by Application 2020 & 2033
- Table 18: Rest of Asia Pacific Fracking Water Treatment Industry Volume (liter ) Forecast, by Application 2020 & 2033
- Table 19: Global Fracking Water Treatment Industry Revenue Million Forecast, by Application 2020 & 2033
- Table 20: Global Fracking Water Treatment Industry Volume liter Forecast, by Application 2020 & 2033
- Table 21: Global Fracking Water Treatment Industry Revenue Million Forecast, by Country 2020 & 2033
- Table 22: Global Fracking Water Treatment Industry Volume liter Forecast, by Country 2020 & 2033
- Table 23: United States Fracking Water Treatment Industry Revenue (Million) Forecast, by Application 2020 & 2033
- Table 24: United States Fracking Water Treatment Industry Volume (liter ) Forecast, by Application 2020 & 2033
- Table 25: Canada Fracking Water Treatment Industry Revenue (Million) Forecast, by Application 2020 & 2033
- Table 26: Canada Fracking Water Treatment Industry Volume (liter ) Forecast, by Application 2020 & 2033
- Table 27: Mexico Fracking Water Treatment Industry Revenue (Million) Forecast, by Application 2020 & 2033
- Table 28: Mexico Fracking Water Treatment Industry Volume (liter ) Forecast, by Application 2020 & 2033
- Table 29: Global Fracking Water Treatment Industry Revenue Million Forecast, by Application 2020 & 2033
- Table 30: Global Fracking Water Treatment Industry Volume liter Forecast, by Application 2020 & 2033
- Table 31: Global Fracking Water Treatment Industry Revenue Million Forecast, by Country 2020 & 2033
- Table 32: Global Fracking Water Treatment Industry Volume liter Forecast, by Country 2020 & 2033
- Table 33: Germany Fracking Water Treatment Industry Revenue (Million) Forecast, by Application 2020 & 2033
- Table 34: Germany Fracking Water Treatment Industry Volume (liter ) Forecast, by Application 2020 & 2033
- Table 35: United Kingdom Fracking Water Treatment Industry Revenue (Million) Forecast, by Application 2020 & 2033
- Table 36: United Kingdom Fracking Water Treatment Industry Volume (liter ) Forecast, by Application 2020 & 2033
- Table 37: France Fracking Water Treatment Industry Revenue (Million) Forecast, by Application 2020 & 2033
- Table 38: France Fracking Water Treatment Industry Volume (liter ) Forecast, by Application 2020 & 2033
- Table 39: Italy Fracking Water Treatment Industry Revenue (Million) Forecast, by Application 2020 & 2033
- Table 40: Italy Fracking Water Treatment Industry Volume (liter ) Forecast, by Application 2020 & 2033
- Table 41: Rest of Europe Fracking Water Treatment Industry Revenue (Million) Forecast, by Application 2020 & 2033
- Table 42: Rest of Europe Fracking Water Treatment Industry Volume (liter ) Forecast, by Application 2020 & 2033
- Table 43: Global Fracking Water Treatment Industry Revenue Million Forecast, by Application 2020 & 2033
- Table 44: Global Fracking Water Treatment Industry Volume liter Forecast, by Application 2020 & 2033
- Table 45: Global Fracking Water Treatment Industry Revenue Million Forecast, by Country 2020 & 2033
- Table 46: Global Fracking Water Treatment Industry Volume liter Forecast, by Country 2020 & 2033
- Table 47: Brazil Fracking Water Treatment Industry Revenue (Million) Forecast, by Application 2020 & 2033
- Table 48: Brazil Fracking Water Treatment Industry Volume (liter ) Forecast, by Application 2020 & 2033
- Table 49: Argentina Fracking Water Treatment Industry Revenue (Million) Forecast, by Application 2020 & 2033
- Table 50: Argentina Fracking Water Treatment Industry Volume (liter ) Forecast, by Application 2020 & 2033
- Table 51: Rest of South America Fracking Water Treatment Industry Revenue (Million) Forecast, by Application 2020 & 2033
- Table 52: Rest of South America Fracking Water Treatment Industry Volume (liter ) Forecast, by Application 2020 & 2033
- Table 53: Global Fracking Water Treatment Industry Revenue Million Forecast, by Application 2020 & 2033
- Table 54: Global Fracking Water Treatment Industry Volume liter Forecast, by Application 2020 & 2033
- Table 55: Global Fracking Water Treatment Industry Revenue Million Forecast, by Country 2020 & 2033
- Table 56: Global Fracking Water Treatment Industry Volume liter Forecast, by Country 2020 & 2033
- Table 57: Saudi Arabia Fracking Water Treatment Industry Revenue (Million) Forecast, by Application 2020 & 2033
- Table 58: Saudi Arabia Fracking Water Treatment Industry Volume (liter ) Forecast, by Application 2020 & 2033
- Table 59: South Africa Fracking Water Treatment Industry Revenue (Million) Forecast, by Application 2020 & 2033
- Table 60: South Africa Fracking Water Treatment Industry Volume (liter ) Forecast, by Application 2020 & 2033
- Table 61: Rest of Middle East and Africa Fracking Water Treatment Industry Revenue (Million) Forecast, by Application 2020 & 2033
- Table 62: Rest of Middle East and Africa Fracking Water Treatment Industry Volume (liter ) Forecast, by Application 2020 & 2033
Frequently Asked Questions
1. What is the projected Compound Annual Growth Rate (CAGR) of the Fracking Water Treatment Industry?
The projected CAGR is approximately > 3.00%.
2. Which companies are prominent players in the Fracking Water Treatment Industry?
Key companies in the market include Filtra Systems, Aquatech International LLC, Ecologix Environmental Systems LLC, DuPont, Oasys Water, Halliburton, Schlumberger Limited, Agua Dulce Technologies LLC, Veolia Water Technologies*List Not Exhaustive, Filtra Systems.
3. What are the main segments of the Fracking Water Treatment Industry?
The market segments include Application.
4. Can you provide details about the market size?
The market size is estimated to be USD 5700 Million as of 2022.
5. What are some drivers contributing to market growth?
; High Demand from Treatment & Recycle Segment; Stringent Government Regulations.
6. What are the notable trends driving market growth?
High Demand from Treatment & Recycle Segment.
7. Are there any restraints impacting market growth?
; Outbreak of COVID-19; Other Restraints.
8. Can you provide examples of recent developments in the market?
Partnerships between industry players to develop innovative technologies
9. What pricing options are available for accessing the report?
Pricing options include single-user, multi-user, and enterprise licenses priced at USD 4750, USD 5250, and USD 8750 respectively.
10. Is the market size provided in terms of value or volume?
The market size is provided in terms of value, measured in Million and volume, measured in liter .
11. Are there any specific market keywords associated with the report?
Yes, the market keyword associated with the report is "Fracking Water Treatment Industry," which aids in identifying and referencing the specific market segment covered.
12. How do I determine which pricing option suits my needs best?
The pricing options vary based on user requirements and access needs. Individual users may opt for single-user licenses, while businesses requiring broader access may choose multi-user or enterprise licenses for cost-effective access to the report.
13. Are there any additional resources or data provided in the Fracking Water Treatment Industry report?
While the report offers comprehensive insights, it's advisable to review the specific contents or supplementary materials provided to ascertain if additional resources or data are available.
14. How can I stay updated on further developments or reports in the Fracking Water Treatment Industry?
To stay informed about further developments, trends, and reports in the Fracking Water Treatment Industry, consider subscribing to industry newsletters, following relevant companies and organizations, or regularly checking reputable industry news sources and publications.
Methodology
Step 1 - Identification of Relevant Samples Size from Population Database


Step 2 - Approaches for Defining Global Market Size (Value, Volume* & Price*)

Note*: In applicable scenarios
Step 3 - Data Sources
Primary Research
- Web Analytics
- Survey Reports
- Research Institute
- Latest Research Reports
- Opinion Leaders
Secondary Research
- Annual Reports
- White Paper
- Latest Press Release
- Industry Association
- Paid Database
- Investor Presentations

Step 4 - Data Triangulation
Involves using different sources of information in order to increase the validity of a study
These sources are likely to be stakeholders in a program - participants, other researchers, program staff, other community members, and so on.
Then we put all data in single framework & apply various statistical tools to find out the dynamic on the market.
During the analysis stage, feedback from the stakeholder groups would be compared to determine areas of agreement as well as areas of divergence