

Key Insights
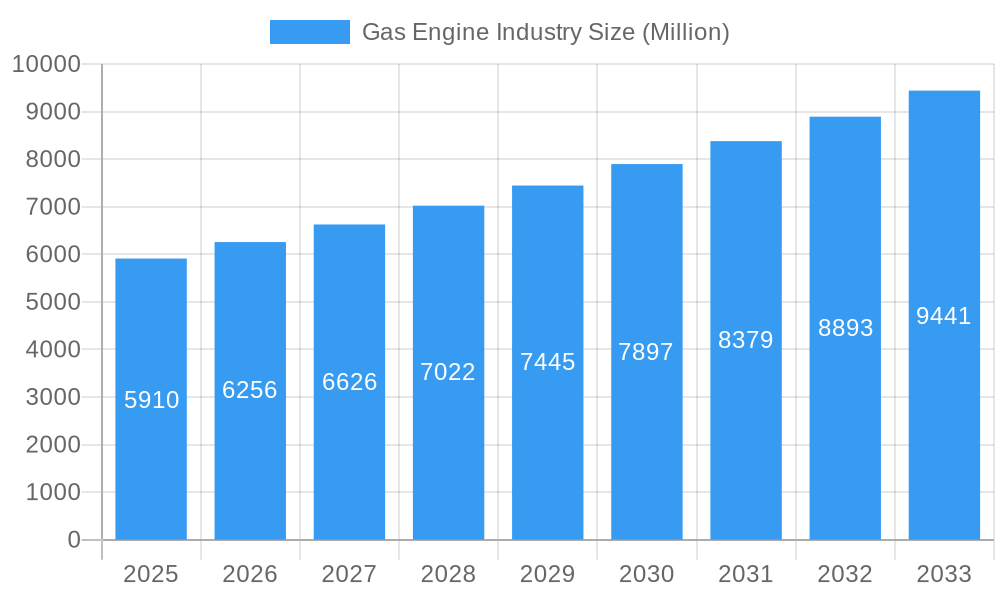
The global gas engine market, valued at $5.91 billion in 2025, is projected to experience robust growth, driven by increasing energy demands across various sectors and the ongoing transition towards cleaner energy sources. A Compound Annual Growth Rate (CAGR) of 5.74% from 2025 to 2033 indicates a significant market expansion. Key drivers include the rising adoption of gas engines in power generation, particularly in regions with abundant natural gas resources. The automotive industry's exploration of alternative fuels, including natural gas and hydrogen, further fuels market growth. Industrial applications, such as compressed air generation and pumping, also contribute significantly. Furthermore, the development of more efficient and environmentally friendly gas engine technologies, including advancements in emission control systems, is expected to propel market expansion. However, fluctuating natural gas prices and stringent emission regulations pose challenges. The market is segmented by end-user (power utilities, automotive, marine, industrial, others) and fuel type (natural gas, hydrogen, other fuel types), with natural gas currently dominating. Leading players like Rolls-Royce, Siemens, and Caterpillar are actively investing in research and development to enhance engine efficiency and sustainability, driving competition and innovation within the sector. Growth is anticipated to be particularly strong in the Asia-Pacific region, fueled by rapid industrialization and infrastructure development. The market's trajectory reflects a complex interplay of technological advancement, regulatory pressures, and evolving energy landscapes.
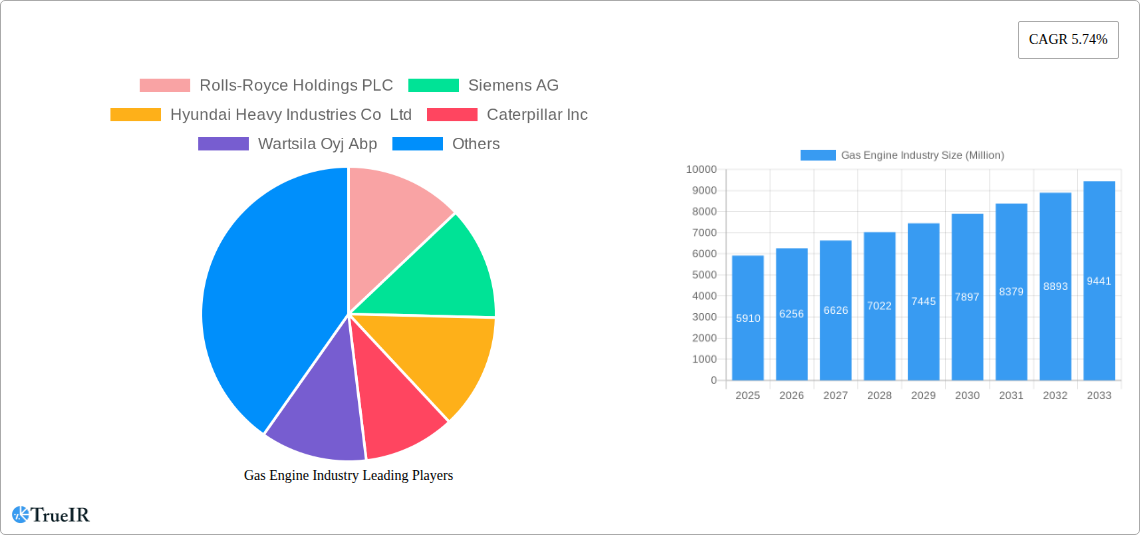
Gas Engine Industry Market Size (In Billion)
Growth within specific segments is expected to vary. The power utilities segment will likely maintain a substantial share due to its reliance on reliable and relatively cost-effective power generation. However, the automotive and marine segments are expected to witness faster growth rates, driven by advancements in natural gas and hydrogen fuel cell technology. The industrial segment will also experience steady growth, although at a potentially slower pace compared to the automotive and marine sectors. The continued development of cleaner-burning fuels and stricter emissions regulations are expected to influence the fuel type segment, pushing the market towards hydrogen and other advanced fuel types alongside natural gas, while potentially reducing the reliance on less sustainable options. This diversification within the fuel type segment is a key characteristic of the market's evolution towards a more environmentally sustainable future. Geographical growth will be influenced by regional economic conditions and government policies supporting the adoption of cleaner energy solutions.
Gas Engine Industry Company Market Share
Gas Engine Industry Market Report: 2019-2033
This comprehensive report provides an in-depth analysis of the global gas engine industry, projecting a market valuation exceeding $XX Million by 2033. The report covers the period 2019-2033, with a base year of 2025 and a forecast period of 2025-2033. It analyzes market trends, competitive dynamics, technological advancements, and regulatory influences impacting growth across various segments and geographies. This report is essential for industry stakeholders, investors, and strategists seeking a clear understanding of this dynamic market.
Gas Engine Industry Market Structure & Competitive Landscape
The global gas engine market exhibits a moderately concentrated structure, with several major players controlling a significant market share. Key companies include Rolls-Royce Holdings PLC, Siemens AG, Hyundai Heavy Industries Co Ltd, Caterpillar Inc, Wärtsilä Oyj Abp, Liebherr Group, Cummins Inc, General Electric Company, Kawasaki Heavy Industries Ltd, JFE Engineering Corporation, MAN SE, and Mitsubishi Heavy Industries Ltd. However, the market also includes numerous smaller players, especially in niche segments. The Herfindahl-Hirschman Index (HHI) for the market is estimated at xx, indicating a moderately concentrated market.
- Market Concentration: The top 10 companies account for approximately xx% of the global market share.
- Innovation Drivers: Stringent emission regulations and the increasing demand for energy-efficient engines drive innovation in fuel types (hydrogen, natural gas) and engine design.
- Regulatory Impacts: Government policies promoting renewable energy sources and emission reduction standards significantly influence market growth and technological advancement.
- Product Substitutes: Competition from alternative power generation technologies, such as fuel cells and solar power, poses a challenge to gas engine market growth.
- End-User Segmentation: The market is segmented into Power Utilities, Automotive, Marine, Industrial, and Others, each with varying growth rates and market dynamics.
- M&A Trends: The industry witnesses occasional mergers and acquisitions, primarily aimed at expanding product portfolios and geographic reach. The total value of M&A deals within the last 5 years is estimated to be $xx Million.
Gas Engine Industry Market Trends & Opportunities
The global gas engine market is experiencing robust growth, driven by increasing energy demand, industrialization, and the growing adoption of natural gas as a cleaner fuel source. The market is expected to register a Compound Annual Growth Rate (CAGR) of xx% during the forecast period (2025-2033), reaching a value exceeding $XX Million by 2033. Technological advancements, such as the incorporation of high-pressure direct injection (HPDI) technology and the development of hydrogen-fueled engines, are creating new opportunities for market expansion. Shifting consumer preferences towards sustainable energy solutions further bolster market growth. The increasing penetration of natural gas engines in the power generation sector is a significant growth driver. Competitive dynamics are characterized by technological innovation, strategic partnerships, and regional expansion strategies among key players.
Dominant Markets & Segments in Gas Engine Industry
- Leading Region/Country: Asia-Pacific is expected to be the dominant market due to rapid industrialization and growing infrastructure development.
- Leading End-User Segment: Power Utilities represent the largest end-user segment, driven by the increasing demand for electricity and the transition toward cleaner energy sources.
- Leading Fuel Type: Natural gas is currently the dominant fuel type; however, hydrogen fuel is anticipated to gain significant traction in the coming years, particularly with government support for hydrogen fuel cell technology.
Key Growth Drivers:
- Power Utilities: Stringent emission norms and the need for reliable and efficient power generation are stimulating demand.
- Marine: Growing maritime trade and stricter emission regulations are promoting the adoption of gas engines in the shipbuilding industry.
- Industrial: Rising industrial activity and the need for efficient power solutions in various industrial processes drive gas engine demand.
- Government Policies: Government incentives and regulations aimed at promoting renewable energy and reducing carbon emissions are key market drivers.
Gas Engine Industry Product Analysis
Significant product innovation focuses on enhancing fuel efficiency, reducing emissions, and improving durability. Advancements in combustion technologies, turbocharging, and engine control systems are enhancing performance and reliability. The market offers a range of gas engines tailored to specific applications, from small-scale industrial engines to large-scale power generation units. Competition is fierce, with companies focusing on differentiated product features, such as superior fuel efficiency, lower emissions, and advanced control systems, to gain a competitive edge.
Key Drivers, Barriers & Challenges in Gas Engine Industry
Key Drivers:
- Increasing demand for reliable and efficient power generation.
- Growing adoption of natural gas as a cleaner fuel alternative.
- Stringent emission regulations driving technological advancements.
- Government support for renewable energy technologies.
Challenges and Restraints:
- Fluctuating natural gas prices impact the cost-effectiveness of gas engines.
- Supply chain disruptions can affect production and delivery timelines.
- Intense competition from alternative energy technologies presents a significant challenge.
- Regulatory complexities and evolving emission standards require continuous adaptation and innovation. The cost of compliance with increasingly stringent emission standards can impact profitability.
Growth Drivers in the Gas Engine Industry Market
Technological advancements, including the development of higher-efficiency engines and the use of alternative fuels like hydrogen, are major growth drivers. Stringent environmental regulations are pushing the adoption of cleaner energy sources, favoring gas engines over traditional diesel engines. Government incentives and supportive policies further stimulate market growth.
Challenges Impacting Gas Engine Industry Growth
The volatility of natural gas prices, supply chain disruptions, and the competitiveness of alternative power generation technologies pose significant challenges. Stricter emission standards and regulatory hurdles necessitate continuous investment in research and development to maintain market relevance.
Key Players Shaping the Gas Engine Industry Market
- Rolls-Royce Holdings PLC
- Siemens AG
- Hyundai Heavy Industries Co Ltd
- Caterpillar Inc
- Wärtsilä Oyj Abp
- Liebherr Group
- Cummins Inc
- General Electric Company
- Kawasaki Heavy Industries Ltd
- JFE Engineering Corporation
- MAN SE
- Mitsubishi Heavy Industries Ltd
Significant Gas Engine Industry Milestones
- November 2022: Weichai Group launched a commercial natural gas engine with a record-breaking 54.16% base engine thermal efficiency, utilizing Westport HPDI technology and a dual-step combustion chamber system.
- March 2023: ITP Aero led a consortium to develop the first locally-produced hydrogen-fueled commercial aircraft engine, receiving USD 13 Million in funding from the European Union's NextGen initiative.
Future Outlook for Gas Engine Industry Market
The gas engine industry is poised for continued growth, driven by technological advancements in fuel efficiency and emission reduction. The increasing adoption of natural gas and the emerging potential of hydrogen fuel cells will shape the future market landscape. Strategic partnerships, mergers and acquisitions, and expansion into new geographical markets are key strategic opportunities for market players. The market is expected to witness significant expansion in emerging economies, fueled by infrastructure development and industrialization.
Gas Engine Industry Segmentation
-
1. End-User
- 1.1. Power Utilities
- 1.2. Automotive
- 1.3. Marine
- 1.4. Industrial
- 1.5. Others
-
2. Fuel Type
- 2.1. Natural Gas
- 2.2. Hydrogen
- 2.3. Other Fuel Types
Gas Engine Industry Segmentation By Geography
-
1. North America
- 1.1. United States
- 1.2. Canada
- 1.3. Rest of North America
-
2. Europe
- 2.1. Germany
- 2.2. France
- 2.3. United Kingdom
- 2.4. Rest of Europe
-
3. Asia Pacific
- 3.1. China
- 3.2. India
- 3.3. Japan
- 3.4. South Korea
- 3.5. Rest of Asia Pacific
-
4. South America
- 4.1. Brazil
- 4.2. Argentina
- 4.3. Rest of South America
-
5. Middle East and Africa
- 5.1. Saudi Arabia
- 5.2. United Arab Emirates
- 5.3. South Africa
- 5.4. Rest of Middle East and Africa
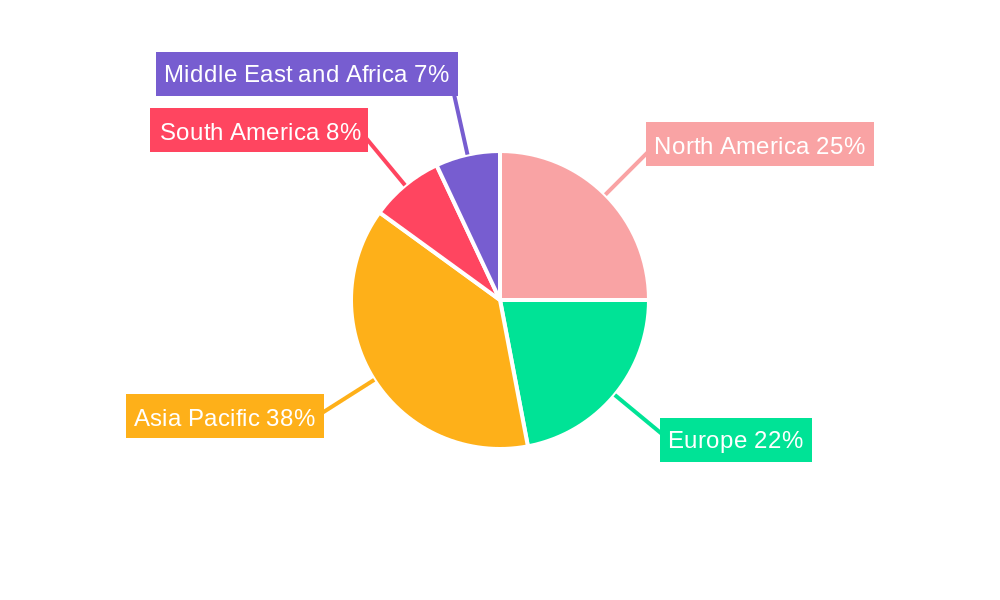
Gas Engine Industry Regional Market Share
Geographic Coverage of Gas Engine Industry
Gas Engine Industry REPORT HIGHLIGHTS
| Aspects | Details |
|---|---|
| Study Period | 2020-2034 |
| Base Year | 2025 |
| Estimated Year | 2026 |
| Forecast Period | 2026-2034 |
| Historical Period | 2020-2025 |
| Growth Rate | CAGR of 5.74% from 2020-2034 |
| Segmentation |
|
Table of Contents
- 1. Introduction
- 1.1. Research Scope
- 1.2. Market Segmentation
- 1.3. Research Objective
- 1.4. Definitions and Assumptions
- 2. Executive Summary
- 2.1. Market Snapshot
- 3. Market Dynamics
- 3.1. Market Drivers
- 3.2. Market Restrains
- 3.3. Market Trends
- 3.4. Market Opportunities
- 4. Market Factor Analysis
- 4.1. Porters Five Forces
- 4.1.1. Bargaining Power of Suppliers
- 4.1.2. Bargaining Power of Buyers
- 4.1.3. Threat of New Entrants
- 4.1.4. Threat of Substitutes
- 4.1.5. Competitive Rivalry
- 4.2. PESTEL analysis
- 4.3. BCG Analysis
- 4.3.1. Stars (High Growth, High Market Share)
- 4.3.2. Cash Cows (Low Growth, High Market Share)
- 4.3.3. Question Mark (High Growth, Low Market Share)
- 4.3.4. Dogs (Low Growth, Low Market Share)
- 4.4. Ansoff Matrix Analysis
- 4.5. Supply Chain Analysis
- 4.6. Regulatory Landscape
- 4.7. Current Market Potential and Opportunity Assessment (TAM–SAM–SOM Framework)
- 4.8. TIR Analyst Note
- 4.1. Porters Five Forces
- 5. Market Analysis, Insights and Forecast 2021-2033
- 5.1. Market Analysis, Insights and Forecast - by End-User
- 5.1.1. Power Utilities
- 5.1.2. Automotive
- 5.1.3. Marine
- 5.1.4. Industrial
- 5.1.5. Others
- 5.2. Market Analysis, Insights and Forecast - by Fuel Type
- 5.2.1. Natural Gas
- 5.2.2. Hydrogen
- 5.2.3. Other Fuel Types
- 5.3. Market Analysis, Insights and Forecast - by Region
- 5.3.1. North America
- 5.3.2. Europe
- 5.3.3. Asia Pacific
- 5.3.4. South America
- 5.3.5. Middle East and Africa
- 5.1. Market Analysis, Insights and Forecast - by End-User
- 6. Global Gas Engine Industry Analysis, Insights and Forecast, 2021-2033
- 6.1. Market Analysis, Insights and Forecast - by End-User
- 6.1.1. Power Utilities
- 6.1.2. Automotive
- 6.1.3. Marine
- 6.1.4. Industrial
- 6.1.5. Others
- 6.2. Market Analysis, Insights and Forecast - by Fuel Type
- 6.2.1. Natural Gas
- 6.2.2. Hydrogen
- 6.2.3. Other Fuel Types
- 6.1. Market Analysis, Insights and Forecast - by End-User
- 7. North America Gas Engine Industry Analysis, Insights and Forecast, 2020-2032
- 7.1. Market Analysis, Insights and Forecast - by End-User
- 7.1.1. Power Utilities
- 7.1.2. Automotive
- 7.1.3. Marine
- 7.1.4. Industrial
- 7.1.5. Others
- 7.2. Market Analysis, Insights and Forecast - by Fuel Type
- 7.2.1. Natural Gas
- 7.2.2. Hydrogen
- 7.2.3. Other Fuel Types
- 7.1. Market Analysis, Insights and Forecast - by End-User
- 8. Europe Gas Engine Industry Analysis, Insights and Forecast, 2020-2032
- 8.1. Market Analysis, Insights and Forecast - by End-User
- 8.1.1. Power Utilities
- 8.1.2. Automotive
- 8.1.3. Marine
- 8.1.4. Industrial
- 8.1.5. Others
- 8.2. Market Analysis, Insights and Forecast - by Fuel Type
- 8.2.1. Natural Gas
- 8.2.2. Hydrogen
- 8.2.3. Other Fuel Types
- 8.1. Market Analysis, Insights and Forecast - by End-User
- 9. Asia Pacific Gas Engine Industry Analysis, Insights and Forecast, 2020-2032
- 9.1. Market Analysis, Insights and Forecast - by End-User
- 9.1.1. Power Utilities
- 9.1.2. Automotive
- 9.1.3. Marine
- 9.1.4. Industrial
- 9.1.5. Others
- 9.2. Market Analysis, Insights and Forecast - by Fuel Type
- 9.2.1. Natural Gas
- 9.2.2. Hydrogen
- 9.2.3. Other Fuel Types
- 9.1. Market Analysis, Insights and Forecast - by End-User
- 10. South America Gas Engine Industry Analysis, Insights and Forecast, 2020-2032
- 10.1. Market Analysis, Insights and Forecast - by End-User
- 10.1.1. Power Utilities
- 10.1.2. Automotive
- 10.1.3. Marine
- 10.1.4. Industrial
- 10.1.5. Others
- 10.2. Market Analysis, Insights and Forecast - by Fuel Type
- 10.2.1. Natural Gas
- 10.2.2. Hydrogen
- 10.2.3. Other Fuel Types
- 10.1. Market Analysis, Insights and Forecast - by End-User
- 11. Middle East and Africa Gas Engine Industry Analysis, Insights and Forecast, 2020-2032
- 11.1. Market Analysis, Insights and Forecast - by End-User
- 11.1.1. Power Utilities
- 11.1.2. Automotive
- 11.1.3. Marine
- 11.1.4. Industrial
- 11.1.5. Others
- 11.2. Market Analysis, Insights and Forecast - by Fuel Type
- 11.2.1. Natural Gas
- 11.2.2. Hydrogen
- 11.2.3. Other Fuel Types
- 11.1. Market Analysis, Insights and Forecast - by End-User
- 12. Competitive Analysis
- 12.1. Company Profiles
- 12.1.1 Rolls-Royce Holdings PLC
- 12.1.1.1. Company Overview
- 12.1.1.2. Products
- 12.1.1.3. Company Financials
- 12.1.1.4. SWOT Analysis
- 12.1.2 Siemens AG
- 12.1.2.1. Company Overview
- 12.1.2.2. Products
- 12.1.2.3. Company Financials
- 12.1.2.4. SWOT Analysis
- 12.1.3 Hyundai Heavy Industries Co Ltd
- 12.1.3.1. Company Overview
- 12.1.3.2. Products
- 12.1.3.3. Company Financials
- 12.1.3.4. SWOT Analysis
- 12.1.4 Caterpillar Inc
- 12.1.4.1. Company Overview
- 12.1.4.2. Products
- 12.1.4.3. Company Financials
- 12.1.4.4. SWOT Analysis
- 12.1.5 Wartsila Oyj Abp
- 12.1.5.1. Company Overview
- 12.1.5.2. Products
- 12.1.5.3. Company Financials
- 12.1.5.4. SWOT Analysis
- 12.1.6 Liebherr Group*List Not Exhaustive
- 12.1.6.1. Company Overview
- 12.1.6.2. Products
- 12.1.6.3. Company Financials
- 12.1.6.4. SWOT Analysis
- 12.1.7 Cummins Inc
- 12.1.7.1. Company Overview
- 12.1.7.2. Products
- 12.1.7.3. Company Financials
- 12.1.7.4. SWOT Analysis
- 12.1.8 General Electric Company
- 12.1.8.1. Company Overview
- 12.1.8.2. Products
- 12.1.8.3. Company Financials
- 12.1.8.4. SWOT Analysis
- 12.1.9 Kawasaki Heavy Industries Ltd
- 12.1.9.1. Company Overview
- 12.1.9.2. Products
- 12.1.9.3. Company Financials
- 12.1.9.4. SWOT Analysis
- 12.1.10 JFE Engineering Corporation
- 12.1.10.1. Company Overview
- 12.1.10.2. Products
- 12.1.10.3. Company Financials
- 12.1.10.4. SWOT Analysis
- 12.1.11 Man SE
- 12.1.11.1. Company Overview
- 12.1.11.2. Products
- 12.1.11.3. Company Financials
- 12.1.11.4. SWOT Analysis
- 12.1.12 Mitsubishi Heavy Industries Ltd
- 12.1.12.1. Company Overview
- 12.1.12.2. Products
- 12.1.12.3. Company Financials
- 12.1.12.4. SWOT Analysis
- 12.1.1 Rolls-Royce Holdings PLC
- 12.2. Market Entropy
- 12.2.1 Company's Key Areas Served
- 12.2.2 Recent Developments
- 12.3. Company Market Share Analysis 2025
- 12.3.1 Top 5 Companies Market Share Analysis
- 12.3.2 Top 3 Companies Market Share Analysis
- 12.4. List of Potential Customers
- 13. Research Methodology
List of Figures
- Figure 1: Global Gas Engine Industry Revenue Breakdown (Million, %) by Region 2025 & 2033
- Figure 2: Global Gas Engine Industry Volume Breakdown (K Unit, %) by Region 2025 & 2033
- Figure 3: North America Gas Engine Industry Revenue (Million), by End-User 2025 & 2033
- Figure 4: North America Gas Engine Industry Volume (K Unit), by End-User 2025 & 2033
- Figure 5: North America Gas Engine Industry Revenue Share (%), by End-User 2025 & 2033
- Figure 6: North America Gas Engine Industry Volume Share (%), by End-User 2025 & 2033
- Figure 7: North America Gas Engine Industry Revenue (Million), by Fuel Type 2025 & 2033
- Figure 8: North America Gas Engine Industry Volume (K Unit), by Fuel Type 2025 & 2033
- Figure 9: North America Gas Engine Industry Revenue Share (%), by Fuel Type 2025 & 2033
- Figure 10: North America Gas Engine Industry Volume Share (%), by Fuel Type 2025 & 2033
- Figure 11: North America Gas Engine Industry Revenue (Million), by Country 2025 & 2033
- Figure 12: North America Gas Engine Industry Volume (K Unit), by Country 2025 & 2033
- Figure 13: North America Gas Engine Industry Revenue Share (%), by Country 2025 & 2033
- Figure 14: North America Gas Engine Industry Volume Share (%), by Country 2025 & 2033
- Figure 15: Europe Gas Engine Industry Revenue (Million), by End-User 2025 & 2033
- Figure 16: Europe Gas Engine Industry Volume (K Unit), by End-User 2025 & 2033
- Figure 17: Europe Gas Engine Industry Revenue Share (%), by End-User 2025 & 2033
- Figure 18: Europe Gas Engine Industry Volume Share (%), by End-User 2025 & 2033
- Figure 19: Europe Gas Engine Industry Revenue (Million), by Fuel Type 2025 & 2033
- Figure 20: Europe Gas Engine Industry Volume (K Unit), by Fuel Type 2025 & 2033
- Figure 21: Europe Gas Engine Industry Revenue Share (%), by Fuel Type 2025 & 2033
- Figure 22: Europe Gas Engine Industry Volume Share (%), by Fuel Type 2025 & 2033
- Figure 23: Europe Gas Engine Industry Revenue (Million), by Country 2025 & 2033
- Figure 24: Europe Gas Engine Industry Volume (K Unit), by Country 2025 & 2033
- Figure 25: Europe Gas Engine Industry Revenue Share (%), by Country 2025 & 2033
- Figure 26: Europe Gas Engine Industry Volume Share (%), by Country 2025 & 2033
- Figure 27: Asia Pacific Gas Engine Industry Revenue (Million), by End-User 2025 & 2033
- Figure 28: Asia Pacific Gas Engine Industry Volume (K Unit), by End-User 2025 & 2033
- Figure 29: Asia Pacific Gas Engine Industry Revenue Share (%), by End-User 2025 & 2033
- Figure 30: Asia Pacific Gas Engine Industry Volume Share (%), by End-User 2025 & 2033
- Figure 31: Asia Pacific Gas Engine Industry Revenue (Million), by Fuel Type 2025 & 2033
- Figure 32: Asia Pacific Gas Engine Industry Volume (K Unit), by Fuel Type 2025 & 2033
- Figure 33: Asia Pacific Gas Engine Industry Revenue Share (%), by Fuel Type 2025 & 2033
- Figure 34: Asia Pacific Gas Engine Industry Volume Share (%), by Fuel Type 2025 & 2033
- Figure 35: Asia Pacific Gas Engine Industry Revenue (Million), by Country 2025 & 2033
- Figure 36: Asia Pacific Gas Engine Industry Volume (K Unit), by Country 2025 & 2033
- Figure 37: Asia Pacific Gas Engine Industry Revenue Share (%), by Country 2025 & 2033
- Figure 38: Asia Pacific Gas Engine Industry Volume Share (%), by Country 2025 & 2033
- Figure 39: South America Gas Engine Industry Revenue (Million), by End-User 2025 & 2033
- Figure 40: South America Gas Engine Industry Volume (K Unit), by End-User 2025 & 2033
- Figure 41: South America Gas Engine Industry Revenue Share (%), by End-User 2025 & 2033
- Figure 42: South America Gas Engine Industry Volume Share (%), by End-User 2025 & 2033
- Figure 43: South America Gas Engine Industry Revenue (Million), by Fuel Type 2025 & 2033
- Figure 44: South America Gas Engine Industry Volume (K Unit), by Fuel Type 2025 & 2033
- Figure 45: South America Gas Engine Industry Revenue Share (%), by Fuel Type 2025 & 2033
- Figure 46: South America Gas Engine Industry Volume Share (%), by Fuel Type 2025 & 2033
- Figure 47: South America Gas Engine Industry Revenue (Million), by Country 2025 & 2033
- Figure 48: South America Gas Engine Industry Volume (K Unit), by Country 2025 & 2033
- Figure 49: South America Gas Engine Industry Revenue Share (%), by Country 2025 & 2033
- Figure 50: South America Gas Engine Industry Volume Share (%), by Country 2025 & 2033
- Figure 51: Middle East and Africa Gas Engine Industry Revenue (Million), by End-User 2025 & 2033
- Figure 52: Middle East and Africa Gas Engine Industry Volume (K Unit), by End-User 2025 & 2033
- Figure 53: Middle East and Africa Gas Engine Industry Revenue Share (%), by End-User 2025 & 2033
- Figure 54: Middle East and Africa Gas Engine Industry Volume Share (%), by End-User 2025 & 2033
- Figure 55: Middle East and Africa Gas Engine Industry Revenue (Million), by Fuel Type 2025 & 2033
- Figure 56: Middle East and Africa Gas Engine Industry Volume (K Unit), by Fuel Type 2025 & 2033
- Figure 57: Middle East and Africa Gas Engine Industry Revenue Share (%), by Fuel Type 2025 & 2033
- Figure 58: Middle East and Africa Gas Engine Industry Volume Share (%), by Fuel Type 2025 & 2033
- Figure 59: Middle East and Africa Gas Engine Industry Revenue (Million), by Country 2025 & 2033
- Figure 60: Middle East and Africa Gas Engine Industry Volume (K Unit), by Country 2025 & 2033
- Figure 61: Middle East and Africa Gas Engine Industry Revenue Share (%), by Country 2025 & 2033
- Figure 62: Middle East and Africa Gas Engine Industry Volume Share (%), by Country 2025 & 2033
List of Tables
- Table 1: Global Gas Engine Industry Revenue Million Forecast, by End-User 2020 & 2033
- Table 2: Global Gas Engine Industry Volume K Unit Forecast, by End-User 2020 & 2033
- Table 3: Global Gas Engine Industry Revenue Million Forecast, by Fuel Type 2020 & 2033
- Table 4: Global Gas Engine Industry Volume K Unit Forecast, by Fuel Type 2020 & 2033
- Table 5: Global Gas Engine Industry Revenue Million Forecast, by Region 2020 & 2033
- Table 6: Global Gas Engine Industry Volume K Unit Forecast, by Region 2020 & 2033
- Table 7: Global Gas Engine Industry Revenue Million Forecast, by End-User 2020 & 2033
- Table 8: Global Gas Engine Industry Volume K Unit Forecast, by End-User 2020 & 2033
- Table 9: Global Gas Engine Industry Revenue Million Forecast, by Fuel Type 2020 & 2033
- Table 10: Global Gas Engine Industry Volume K Unit Forecast, by Fuel Type 2020 & 2033
- Table 11: Global Gas Engine Industry Revenue Million Forecast, by Country 2020 & 2033
- Table 12: Global Gas Engine Industry Volume K Unit Forecast, by Country 2020 & 2033
- Table 13: United States Gas Engine Industry Revenue (Million) Forecast, by Application 2020 & 2033
- Table 14: United States Gas Engine Industry Volume (K Unit) Forecast, by Application 2020 & 2033
- Table 15: Canada Gas Engine Industry Revenue (Million) Forecast, by Application 2020 & 2033
- Table 16: Canada Gas Engine Industry Volume (K Unit) Forecast, by Application 2020 & 2033
- Table 17: Rest of North America Gas Engine Industry Revenue (Million) Forecast, by Application 2020 & 2033
- Table 18: Rest of North America Gas Engine Industry Volume (K Unit) Forecast, by Application 2020 & 2033
- Table 19: Global Gas Engine Industry Revenue Million Forecast, by End-User 2020 & 2033
- Table 20: Global Gas Engine Industry Volume K Unit Forecast, by End-User 2020 & 2033
- Table 21: Global Gas Engine Industry Revenue Million Forecast, by Fuel Type 2020 & 2033
- Table 22: Global Gas Engine Industry Volume K Unit Forecast, by Fuel Type 2020 & 2033
- Table 23: Global Gas Engine Industry Revenue Million Forecast, by Country 2020 & 2033
- Table 24: Global Gas Engine Industry Volume K Unit Forecast, by Country 2020 & 2033
- Table 25: Germany Gas Engine Industry Revenue (Million) Forecast, by Application 2020 & 2033
- Table 26: Germany Gas Engine Industry Volume (K Unit) Forecast, by Application 2020 & 2033
- Table 27: France Gas Engine Industry Revenue (Million) Forecast, by Application 2020 & 2033
- Table 28: France Gas Engine Industry Volume (K Unit) Forecast, by Application 2020 & 2033
- Table 29: United Kingdom Gas Engine Industry Revenue (Million) Forecast, by Application 2020 & 2033
- Table 30: United Kingdom Gas Engine Industry Volume (K Unit) Forecast, by Application 2020 & 2033
- Table 31: Rest of Europe Gas Engine Industry Revenue (Million) Forecast, by Application 2020 & 2033
- Table 32: Rest of Europe Gas Engine Industry Volume (K Unit) Forecast, by Application 2020 & 2033
- Table 33: Global Gas Engine Industry Revenue Million Forecast, by End-User 2020 & 2033
- Table 34: Global Gas Engine Industry Volume K Unit Forecast, by End-User 2020 & 2033
- Table 35: Global Gas Engine Industry Revenue Million Forecast, by Fuel Type 2020 & 2033
- Table 36: Global Gas Engine Industry Volume K Unit Forecast, by Fuel Type 2020 & 2033
- Table 37: Global Gas Engine Industry Revenue Million Forecast, by Country 2020 & 2033
- Table 38: Global Gas Engine Industry Volume K Unit Forecast, by Country 2020 & 2033
- Table 39: China Gas Engine Industry Revenue (Million) Forecast, by Application 2020 & 2033
- Table 40: China Gas Engine Industry Volume (K Unit) Forecast, by Application 2020 & 2033
- Table 41: India Gas Engine Industry Revenue (Million) Forecast, by Application 2020 & 2033
- Table 42: India Gas Engine Industry Volume (K Unit) Forecast, by Application 2020 & 2033
- Table 43: Japan Gas Engine Industry Revenue (Million) Forecast, by Application 2020 & 2033
- Table 44: Japan Gas Engine Industry Volume (K Unit) Forecast, by Application 2020 & 2033
- Table 45: South Korea Gas Engine Industry Revenue (Million) Forecast, by Application 2020 & 2033
- Table 46: South Korea Gas Engine Industry Volume (K Unit) Forecast, by Application 2020 & 2033
- Table 47: Rest of Asia Pacific Gas Engine Industry Revenue (Million) Forecast, by Application 2020 & 2033
- Table 48: Rest of Asia Pacific Gas Engine Industry Volume (K Unit) Forecast, by Application 2020 & 2033
- Table 49: Global Gas Engine Industry Revenue Million Forecast, by End-User 2020 & 2033
- Table 50: Global Gas Engine Industry Volume K Unit Forecast, by End-User 2020 & 2033
- Table 51: Global Gas Engine Industry Revenue Million Forecast, by Fuel Type 2020 & 2033
- Table 52: Global Gas Engine Industry Volume K Unit Forecast, by Fuel Type 2020 & 2033
- Table 53: Global Gas Engine Industry Revenue Million Forecast, by Country 2020 & 2033
- Table 54: Global Gas Engine Industry Volume K Unit Forecast, by Country 2020 & 2033
- Table 55: Brazil Gas Engine Industry Revenue (Million) Forecast, by Application 2020 & 2033
- Table 56: Brazil Gas Engine Industry Volume (K Unit) Forecast, by Application 2020 & 2033
- Table 57: Argentina Gas Engine Industry Revenue (Million) Forecast, by Application 2020 & 2033
- Table 58: Argentina Gas Engine Industry Volume (K Unit) Forecast, by Application 2020 & 2033
- Table 59: Rest of South America Gas Engine Industry Revenue (Million) Forecast, by Application 2020 & 2033
- Table 60: Rest of South America Gas Engine Industry Volume (K Unit) Forecast, by Application 2020 & 2033
- Table 61: Global Gas Engine Industry Revenue Million Forecast, by End-User 2020 & 2033
- Table 62: Global Gas Engine Industry Volume K Unit Forecast, by End-User 2020 & 2033
- Table 63: Global Gas Engine Industry Revenue Million Forecast, by Fuel Type 2020 & 2033
- Table 64: Global Gas Engine Industry Volume K Unit Forecast, by Fuel Type 2020 & 2033
- Table 65: Global Gas Engine Industry Revenue Million Forecast, by Country 2020 & 2033
- Table 66: Global Gas Engine Industry Volume K Unit Forecast, by Country 2020 & 2033
- Table 67: Saudi Arabia Gas Engine Industry Revenue (Million) Forecast, by Application 2020 & 2033
- Table 68: Saudi Arabia Gas Engine Industry Volume (K Unit) Forecast, by Application 2020 & 2033
- Table 69: United Arab Emirates Gas Engine Industry Revenue (Million) Forecast, by Application 2020 & 2033
- Table 70: United Arab Emirates Gas Engine Industry Volume (K Unit) Forecast, by Application 2020 & 2033
- Table 71: South Africa Gas Engine Industry Revenue (Million) Forecast, by Application 2020 & 2033
- Table 72: South Africa Gas Engine Industry Volume (K Unit) Forecast, by Application 2020 & 2033
- Table 73: Rest of Middle East and Africa Gas Engine Industry Revenue (Million) Forecast, by Application 2020 & 2033
- Table 74: Rest of Middle East and Africa Gas Engine Industry Volume (K Unit) Forecast, by Application 2020 & 2033
Frequently Asked Questions
1. What is the projected Compound Annual Growth Rate (CAGR) of the Gas Engine Industry?
The projected CAGR is approximately 5.74%.
2. Which companies are prominent players in the Gas Engine Industry?
Key companies in the market include Rolls-Royce Holdings PLC, Siemens AG, Hyundai Heavy Industries Co Ltd, Caterpillar Inc, Wartsila Oyj Abp, Liebherr Group*List Not Exhaustive, Cummins Inc, General Electric Company, Kawasaki Heavy Industries Ltd, JFE Engineering Corporation, Man SE, Mitsubishi Heavy Industries Ltd.
3. What are the main segments of the Gas Engine Industry?
The market segments include End-User, Fuel Type.
4. Can you provide details about the market size?
The market size is estimated to be USD 5.91 Million as of 2022.
5. What are some drivers contributing to market growth?
4.; Increasing Supply and Consumption of Gas-based Systems in Various End-user Industry4.; Implementation of stricter emission regulations worldwide.
6. What are the notable trends driving market growth?
Power Utilities Expected to Witness Significant Growth.
7. Are there any restraints impacting market growth?
4.; Growing Inclination towards Renewable Sources.
8. Can you provide examples of recent developments in the market?
In March 2023, ITP Aero, a Spanish aircraft engine company, has announced that it is leading a national consortium to test and develop the first hydrogen-fueled commercial aircraft engine developed locally. As part of the Spanish Ministry of Science agency's Aeronautical Technology Plan, managed by CDTI, the Spanish Center for Technological Development and Innovation, the USD 13 million Cryogenics, Fuel Cells and Hydrogen Combustion in Air Transport project is co-funded by European Union Next Gen strategic investment funding.
9. What pricing options are available for accessing the report?
Pricing options include single-user, multi-user, and enterprise licenses priced at USD 4750, USD 5250, and USD 8750 respectively.
10. Is the market size provided in terms of value or volume?
The market size is provided in terms of value, measured in Million and volume, measured in K Unit.
11. Are there any specific market keywords associated with the report?
Yes, the market keyword associated with the report is "Gas Engine Industry," which aids in identifying and referencing the specific market segment covered.
12. How do I determine which pricing option suits my needs best?
The pricing options vary based on user requirements and access needs. Individual users may opt for single-user licenses, while businesses requiring broader access may choose multi-user or enterprise licenses for cost-effective access to the report.
13. Are there any additional resources or data provided in the Gas Engine Industry report?
While the report offers comprehensive insights, it's advisable to review the specific contents or supplementary materials provided to ascertain if additional resources or data are available.
14. How can I stay updated on further developments or reports in the Gas Engine Industry?
To stay informed about further developments, trends, and reports in the Gas Engine Industry, consider subscribing to industry newsletters, following relevant companies and organizations, or regularly checking reputable industry news sources and publications.
Methodology
Step 1 - Identification of Relevant Samples Size from Population Database


Step 2 - Approaches for Defining Global Market Size (Value, Volume* & Price*)

Note*: In applicable scenarios
Step 3 - Data Sources
Primary Research
- Web Analytics
- Survey Reports
- Research Institute
- Latest Research Reports
- Opinion Leaders
Secondary Research
- Annual Reports
- White Paper
- Latest Press Release
- Industry Association
- Paid Database
- Investor Presentations

Step 4 - Data Triangulation
Involves using different sources of information in order to increase the validity of a study
These sources are likely to be stakeholders in a program - participants, other researchers, program staff, other community members, and so on.
Then we put all data in single framework & apply various statistical tools to find out the dynamic on the market.
During the analysis stage, feedback from the stakeholder groups would be compared to determine areas of agreement as well as areas of divergence