

Key Insights
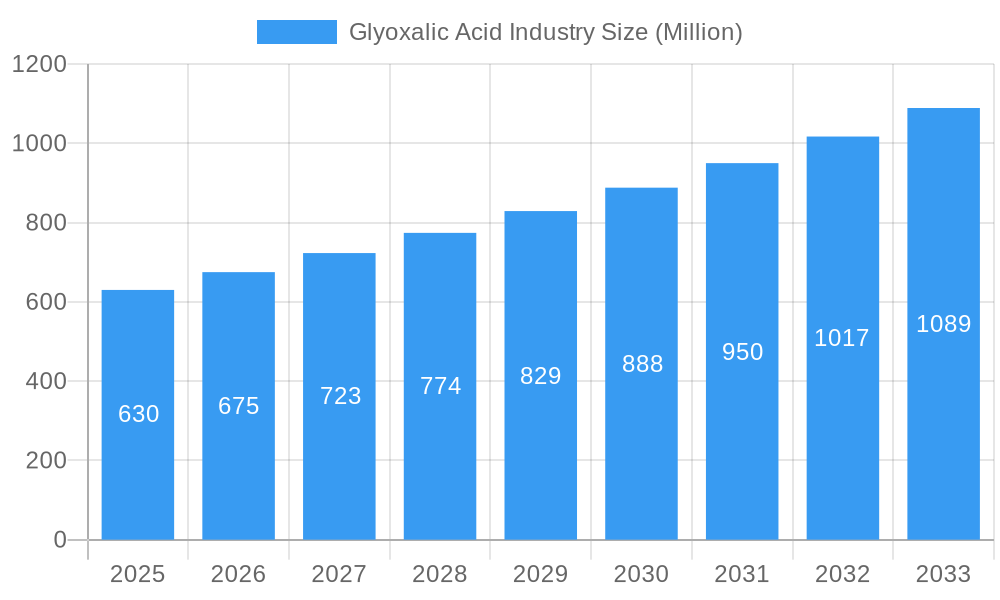
The global Glyoxalic Acid market is poised for robust expansion, projected to reach an estimated $630 million by 2025. This growth is underpinned by a compelling Compound Annual Growth Rate (CAGR) exceeding 6.00%, indicating sustained demand and increasing adoption across various industrial sectors. The market's vitality is driven by its indispensable role as a key intermediate in the synthesis of a wide array of high-value products. In the Personal Care and Cosmetics segment, glyoxalic acid is crucial for manufacturing ingredients that enhance product efficacy and formulation stability. Its application in the Pharmaceuticals sector is equally significant, serving as a building block for active pharmaceutical ingredients (APIs) and essential drug intermediates. Furthermore, the Agrochemicals industry relies on glyoxalic acid for the production of herbicides and pesticides, contributing to enhanced crop yields and protection. The Flavour Industry also utilizes glyoxalic acid for synthesizing flavor compounds, adding to the sensory appeal of consumer goods. Emerging applications in the Food and Beverage industry, along with other niche industrial uses, further underscore the versatility and growing importance of glyoxalic acid. This diversified demand base provides a strong foundation for the market's continued upward trajectory.
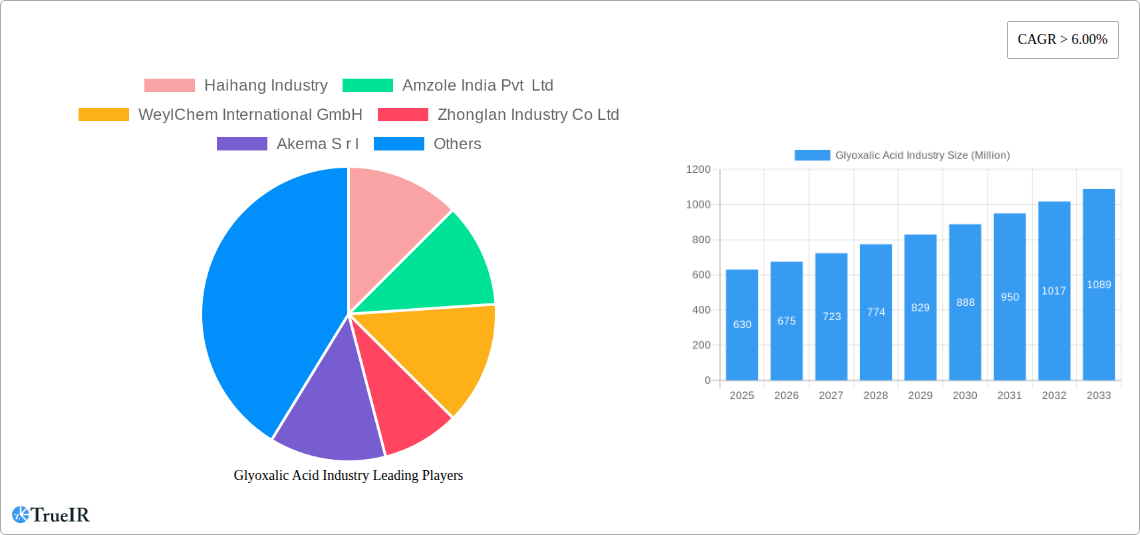
Glyoxalic Acid Industry Market Size (In Million)
The market's dynamic is shaped by several key trends and evolving dynamics. Innovations in production processes that enhance efficiency and reduce environmental impact are gaining traction, driven by increasing regulatory scrutiny and a global push towards sustainable chemical manufacturing. Companies are focusing on developing cost-effective and high-purity glyoxalic acid to meet the stringent quality requirements of end-user industries, particularly pharmaceuticals and cosmetics. The Asia Pacific region, led by China and India, is emerging as a dominant force in both production and consumption, owing to its rapidly expanding manufacturing base and growing domestic demand. North America and Europe, with their established pharmaceutical and cosmetic industries, continue to be significant markets, driven by high research and development investments and consumer preference for premium products. While the market benefits from strong drivers, certain restraints, such as fluctuations in raw material prices and intense competition among manufacturers, necessitate strategic agility and continuous innovation to maintain market share and profitability. Addressing these challenges while capitalizing on growth opportunities will be crucial for sustained success in the global glyoxalic acid market.
Glyoxalic Acid Industry Company Market Share
This in-depth report provides a dynamic, SEO-optimized analysis of the global Glyoxalic Acid market, leveraging high-volume keywords for unparalleled industry insight. Explore market dynamics, emerging trends, dominant segments, and key players shaping this vital chemical sector. This comprehensive report, covering the study period of 2019–2033 with a base year of 2025, is your essential guide to understanding the Glyoxalic Acid industry's growth trajectory and future potential.
Glyoxalic Acid Industry Market Structure & Competitive Landscape
The Glyoxalic Acid market exhibits a moderately concentrated structure, with a few key players dominating global production capacity. Innovation in synthesis processes and downstream applications remains a primary driver of competitive advantage. Regulatory landscapes, particularly concerning environmental impact and product safety, significantly influence market entry and operational strategies for glyoxalic acid manufacturers. The threat of product substitutes is moderate, primarily stemming from alternative aldehydes in specific applications, though glyoxalic acid's unique reactivity often secures its position. End-user segmentation reveals significant reliance on pharmaceuticals, personal care and cosmetics, and agrochemicals, with the flavor industry and other sectors like food and beverage contributing to demand. Merger and acquisition (M&A) activity, while not at peak levels, is a strategic tool for market expansion and portfolio enhancement. For instance, the August 2023 acquisition of Chemours' glycolic acid business highlights consolidation trends and the pursuit of specialized chemical portfolios.
Glyoxalic Acid Industry Market Trends & Opportunities
The Glyoxalic Acid market is poised for substantial growth, driven by escalating demand across its diverse end-user industries and continuous innovation in its applications. Projections indicate a robust Compound Annual Growth Rate (CAGR) of approximately 6.5% to 7.5% from 2025 to 2033, propelling the global market size from an estimated USD 1.5 Billion in the base year 2025 to over USD 2.5 Billion by 2033. Technological advancements in production methods, focusing on efficiency and reduced environmental impact, are a significant trend. Companies are investing in greener synthesis routes and exploring novel catalysts to optimize glyoxalic acid production. Consumer preferences are increasingly leaning towards naturally derived and sustainable ingredients, creating opportunities for glyoxalic acid producers to highlight its role in creating biodegradable and eco-friendly end products, particularly in the personal care and cosmetics sector. The pharmaceutical industry's continued expansion, with a focus on new drug development and generic manufacturing, serves as a consistent demand driver. Agrochemical applications, including the synthesis of herbicides and insecticides, also present a stable growth avenue. Emerging markets in Asia-Pacific and Latin America are witnessing increased industrialization and rising disposable incomes, further boosting glyoxalic acid consumption. Competitive dynamics are characterized by a balance between established global players and emerging regional manufacturers, with a growing emphasis on product quality, supply chain reliability, and customer-specific solutions. The market is ripe for strategic partnerships and collaborations to address evolving industry needs and tap into new geographic territories. For example, Guolin New Materials' expansion into the European market signifies a broader trend of geographical diversification and increased market penetration. The unique chemical properties of glyoxalic acid, including its reactivity and versatility as a building block, ensure its continued relevance and growth potential across various industrial applications.
Dominant Markets & Segments in Glyoxalic Acid Industry
The Pharmaceuticals segment stands as a dominant force within the Glyoxalic Acid industry, exhibiting consistent and robust growth. Its critical role as an intermediate in the synthesis of a wide array of active pharmaceutical ingredients (APIs), including antibiotics, antivirals, and cardiovascular drugs, underpins this dominance. The increasing global healthcare expenditure, coupled with the continuous research and development of new therapeutic agents, directly translates into heightened demand for high-purity glyoxalic acid. Stringent regulatory requirements in the pharmaceutical sector necessitate the use of high-quality, precisely manufactured glyoxalic acid, further solidifying its position.
The Personal Care and Cosmetics segment is another significant growth engine. Glyoxalic acid is increasingly utilized in the formulation of hair straightening products, skin care treatments, and advanced cosmetic ingredients due to its ability to form stable cross-links and its mild exfoliating properties. Growing consumer awareness regarding personal grooming, coupled with the trend towards sophisticated and effective beauty products, fuels demand. The "clean beauty" movement also presents opportunities, as glyoxalic acid can be a component in formulations aiming for enhanced efficacy with a perceived better safety profile when compared to harsher alternatives.
The Agrochemicals segment also represents a substantial market for glyoxalic acid, primarily as a precursor for herbicides, insecticides, and fungicides. The global need for enhanced crop yields and food security continues to drive demand for effective agrochemical solutions. Advancements in agricultural practices and the development of more targeted and environmentally conscious crop protection agents ensure a steady market for glyoxalic acid derivatives.
Key growth drivers in these dominant segments include:
Pharmaceuticals:
- Rising global healthcare expenditure and an aging population.
- Continuous pipeline of new drug discoveries and generic drug manufacturing.
- Increasing prevalence of chronic diseases.
- Stringent quality and purity standards for API synthesis.
Personal Care and Cosmetics:
- Growing disposable incomes and consumer focus on beauty and wellness.
- Innovation in advanced cosmetic formulations and hair care products.
- Trend towards effective and milder chemical ingredients.
- Expansion of the e-commerce channel for beauty products.
Agrochemicals:
- Global demand for increased food production and agricultural efficiency.
- Development of novel and specialized pesticides and herbicides.
- Government initiatives promoting modern farming techniques.
- Need for effective crop protection against evolving pests and diseases.
Geographically, Asia-Pacific is projected to emerge as the largest and fastest-growing market for glyoxalic acid. This growth is fueled by the region's rapidly expanding pharmaceutical, cosmetic, and agrochemical industries, particularly in China and India, which are major manufacturing hubs and consumer markets. Favorable government policies promoting industrial growth and a large, cost-conscious manufacturing base further contribute to this dominance.
Glyoxalic Acid Industry Product Analysis
Glyoxalic acid is a versatile organic compound with significant chemical reactivity, finding widespread applications as a key intermediate. Product innovations focus on enhancing its purity for sensitive applications like pharmaceuticals and personal care, while also exploring novel derivatives with improved efficacy in agrochemicals and specialty chemicals. Its ability to undergo various reactions, including condensation, oxidation, and reduction, makes it an indispensable building block for synthesizing complex molecules. Competitive advantages lie in producers' ability to offer consistent quality, customized grades, and reliable supply chains, catering to the stringent demands of end-user industries.
Key Drivers, Barriers & Challenges in Glyoxalic Acid Industry
Key Drivers: The Glyoxalic Acid industry is propelled by the escalating demand from its diverse end-user segments, particularly pharmaceuticals and personal care. Technological advancements in synthesis processes, leading to improved yields and reduced environmental impact, are critical growth catalysts. The increasing global focus on sustainable chemistry and the development of eco-friendly products further boost demand for glyoxalic acid as a versatile intermediate.
Key Barriers & Challenges: Volatility in raw material prices, such as glyoxal and oxalic acid, poses a significant challenge. Stringent environmental regulations regarding chemical manufacturing and waste disposal can increase operational costs and necessitate substantial investment in compliance. Intense competition among manufacturers, leading to price pressures, and potential supply chain disruptions are also critical concerns impacting market growth and profitability.
Growth Drivers in the Glyoxalic Acid Industry Market
The Glyoxalic Acid industry's growth is fundamentally driven by the robust expansion of its key end-user markets. The pharmaceutical sector, with its continuous demand for intermediates in API synthesis, remains a primary growth catalyst. Similarly, the burgeoning personal care and cosmetics industry, seeking effective and versatile ingredients for advanced formulations, contributes significantly. Technological advancements in glyoxalic acid production, focusing on efficiency, cost-effectiveness, and reduced environmental impact, are crucial for maintaining competitive advantage and unlocking new market opportunities. Furthermore, the growing global emphasis on green chemistry and sustainable solutions presents a favorable landscape for glyoxalic acid's application in eco-friendly end products.
Challenges Impacting Glyoxalic Acid Industry Growth
Challenges impacting Glyoxalic Acid industry growth are multifaceted. Fluctuations in the cost and availability of key raw materials, such as glyoxal, can significantly affect production economics. Increasingly stringent environmental regulations worldwide necessitate substantial investments in pollution control and sustainable manufacturing practices, potentially increasing operational expenses. Competitive pressures from established and emerging players can lead to price erosion, impacting profit margins. Additionally, the complexity of global supply chains and the potential for disruptions due to geopolitical events or logistical issues can hinder timely delivery and affect market stability.
Key Players Shaping the Glyoxalic Acid Industry Market
- Haihang Industry
- Amzole India Pvt Ltd
- WeylChem International GmbH
- Zhonglan Industry Co Ltd
- Akema S r l
- JIAXING ZHONGHUA CHEMICAL Co Ltd
- Hubei Hongyuan Pharmaceutical Technology Co Ltd
- Xinjiang Guolin New Materials Co Ltd
- STAN Chemical Co Ltd
- Ensince Industry Co Ltd
Significant Glyoxalic Acid Industry Industry Milestones
- August 2023: Chemours completes the sale of its glycolic acid business to Iron Path Capital-backed PureTech Scientific, LLC for USD 137 million, indicating consolidation and strategic divestitures within the broader alpha-hydroxy acid market.
- August 2023: Guolin New Materials announces the expansion of its high-quality glyoxylic acid business to the European market, signifying a strategic move to broaden its geographical presence and enhance customer reach in a key global market.
Future Outlook for Glyoxalic Acid Industry Market
The future outlook for the Glyoxalic Acid industry is exceptionally promising, buoyed by sustained demand from its core applications and emerging opportunities in sustainable chemistry. Continued innovation in production technologies, aiming for greater efficiency and environmental responsibility, will be a key growth catalyst. The increasing consumer preference for natural and eco-friendly products will further drive the adoption of glyoxalic acid in personal care and cosmetics. Strategic investments in research and development, coupled with expansion into rapidly growing emerging markets, are expected to shape the industry's trajectory. Companies that can offer high-purity products, ensure supply chain resilience, and align with green chemistry principles are poised for significant market success.
Glyoxalic Acid Industry Segmentation
-
1. End-user
- 1.1. Personal Care and Cosmetics
- 1.2. Pharmaceuticals
- 1.3. Agrochemicals
- 1.4. Flavour Industry
- 1.5. Others (Food and Beverage, etc.)
Glyoxalic Acid Industry Segmentation By Geography
-
1. Asia Pacific
- 1.1. China
- 1.2. India
- 1.3. Japan
- 1.4. South Korea
- 1.5. Rest of Asia Pacific
-
2. North America
- 2.1. United States
- 2.2. Canada
- 2.3. Mexico
-
3. Europe
- 3.1. Germany
- 3.2. United Kingdom
- 3.3. Italy
- 3.4. France
- 3.5. Rest of Europe
-
4. South America
- 4.1. Brazil
- 4.2. Argentina
- 4.3. Rest of South America
-
5. Middle East and Africa
- 5.1. Saudi Arabia
- 5.2. South Africa
- 5.3. Rest of Middle East and Africa
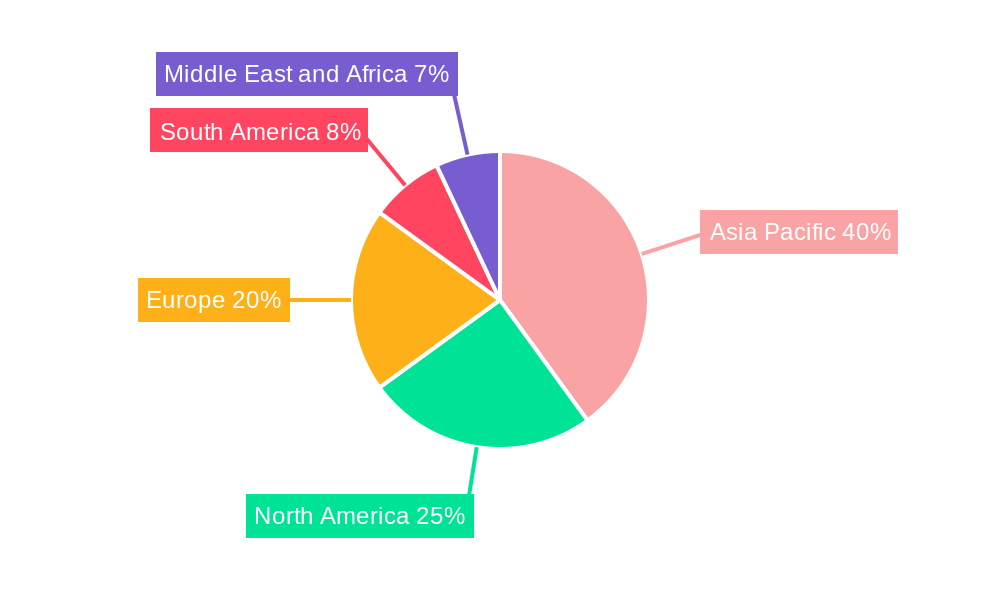
Glyoxalic Acid Industry Regional Market Share
Geographic Coverage of Glyoxalic Acid Industry
Glyoxalic Acid Industry REPORT HIGHLIGHTS
| Aspects | Details |
|---|---|
| Study Period | 2020-2034 |
| Base Year | 2025 |
| Estimated Year | 2026 |
| Forecast Period | 2026-2034 |
| Historical Period | 2020-2025 |
| Growth Rate | CAGR of 3.98% from 2020-2034 |
| Segmentation |
|
Table of Contents
- 1. Introduction
- 1.1. Research Scope
- 1.2. Market Segmentation
- 1.3. Research Objective
- 1.4. Definitions and Assumptions
- 2. Executive Summary
- 2.1. Market Snapshot
- 3. Market Dynamics
- 3.1. Market Drivers
- 3.2. Market Restrains
- 3.3. Market Trends
- 3.4. Market Opportunities
- 4. Market Factor Analysis
- 4.1. Porters Five Forces
- 4.1.1. Bargaining Power of Suppliers
- 4.1.2. Bargaining Power of Buyers
- 4.1.3. Threat of New Entrants
- 4.1.4. Threat of Substitutes
- 4.1.5. Competitive Rivalry
- 4.2. PESTEL analysis
- 4.3. BCG Analysis
- 4.3.1. Stars (High Growth, High Market Share)
- 4.3.2. Cash Cows (Low Growth, High Market Share)
- 4.3.3. Question Mark (High Growth, Low Market Share)
- 4.3.4. Dogs (Low Growth, Low Market Share)
- 4.4. Ansoff Matrix Analysis
- 4.5. Supply Chain Analysis
- 4.6. Regulatory Landscape
- 4.7. Current Market Potential and Opportunity Assessment (TAM–SAM–SOM Framework)
- 4.8. TIR Analyst Note
- 4.1. Porters Five Forces
- 5. Market Analysis, Insights and Forecast 2021-2033
- 5.1. Market Analysis, Insights and Forecast - by End-user
- 5.1.1. Personal Care and Cosmetics
- 5.1.2. Pharmaceuticals
- 5.1.3. Agrochemicals
- 5.1.4. Flavour Industry
- 5.1.5. Others (Food and Beverage, etc.)
- 5.2. Market Analysis, Insights and Forecast - by Region
- 5.2.1. Asia Pacific
- 5.2.2. North America
- 5.2.3. Europe
- 5.2.4. South America
- 5.2.5. Middle East and Africa
- 5.1. Market Analysis, Insights and Forecast - by End-user
- 6. Global Glyoxalic Acid Industry Analysis, Insights and Forecast, 2021-2033
- 6.1. Market Analysis, Insights and Forecast - by End-user
- 6.1.1. Personal Care and Cosmetics
- 6.1.2. Pharmaceuticals
- 6.1.3. Agrochemicals
- 6.1.4. Flavour Industry
- 6.1.5. Others (Food and Beverage, etc.)
- 6.1. Market Analysis, Insights and Forecast - by End-user
- 7. Asia Pacific Glyoxalic Acid Industry Analysis, Insights and Forecast, 2020-2032
- 7.1. Market Analysis, Insights and Forecast - by End-user
- 7.1.1. Personal Care and Cosmetics
- 7.1.2. Pharmaceuticals
- 7.1.3. Agrochemicals
- 7.1.4. Flavour Industry
- 7.1.5. Others (Food and Beverage, etc.)
- 7.1. Market Analysis, Insights and Forecast - by End-user
- 8. North America Glyoxalic Acid Industry Analysis, Insights and Forecast, 2020-2032
- 8.1. Market Analysis, Insights and Forecast - by End-user
- 8.1.1. Personal Care and Cosmetics
- 8.1.2. Pharmaceuticals
- 8.1.3. Agrochemicals
- 8.1.4. Flavour Industry
- 8.1.5. Others (Food and Beverage, etc.)
- 8.1. Market Analysis, Insights and Forecast - by End-user
- 9. Europe Glyoxalic Acid Industry Analysis, Insights and Forecast, 2020-2032
- 9.1. Market Analysis, Insights and Forecast - by End-user
- 9.1.1. Personal Care and Cosmetics
- 9.1.2. Pharmaceuticals
- 9.1.3. Agrochemicals
- 9.1.4. Flavour Industry
- 9.1.5. Others (Food and Beverage, etc.)
- 9.1. Market Analysis, Insights and Forecast - by End-user
- 10. South America Glyoxalic Acid Industry Analysis, Insights and Forecast, 2020-2032
- 10.1. Market Analysis, Insights and Forecast - by End-user
- 10.1.1. Personal Care and Cosmetics
- 10.1.2. Pharmaceuticals
- 10.1.3. Agrochemicals
- 10.1.4. Flavour Industry
- 10.1.5. Others (Food and Beverage, etc.)
- 10.1. Market Analysis, Insights and Forecast - by End-user
- 11. Middle East and Africa Glyoxalic Acid Industry Analysis, Insights and Forecast, 2020-2032
- 11.1. Market Analysis, Insights and Forecast - by End-user
- 11.1.1. Personal Care and Cosmetics
- 11.1.2. Pharmaceuticals
- 11.1.3. Agrochemicals
- 11.1.4. Flavour Industry
- 11.1.5. Others (Food and Beverage, etc.)
- 11.1. Market Analysis, Insights and Forecast - by End-user
- 12. Competitive Analysis
- 12.1. Company Profiles
- 12.1.1 Haihang Industry
- 12.1.1.1. Company Overview
- 12.1.1.2. Products
- 12.1.1.3. Company Financials
- 12.1.1.4. SWOT Analysis
- 12.1.2 Amzole India Pvt Ltd
- 12.1.2.1. Company Overview
- 12.1.2.2. Products
- 12.1.2.3. Company Financials
- 12.1.2.4. SWOT Analysis
- 12.1.3 WeylChem International GmbH
- 12.1.3.1. Company Overview
- 12.1.3.2. Products
- 12.1.3.3. Company Financials
- 12.1.3.4. SWOT Analysis
- 12.1.4 Zhonglan Industry Co Ltd
- 12.1.4.1. Company Overview
- 12.1.4.2. Products
- 12.1.4.3. Company Financials
- 12.1.4.4. SWOT Analysis
- 12.1.5 Akema S r l
- 12.1.5.1. Company Overview
- 12.1.5.2. Products
- 12.1.5.3. Company Financials
- 12.1.5.4. SWOT Analysis
- 12.1.6 JIAXING ZHONGHUA CHEMICAL Co Ltd
- 12.1.6.1. Company Overview
- 12.1.6.2. Products
- 12.1.6.3. Company Financials
- 12.1.6.4. SWOT Analysis
- 12.1.7 Hubei Hongyuan Pharmaceutical Technology Co Ltd
- 12.1.7.1. Company Overview
- 12.1.7.2. Products
- 12.1.7.3. Company Financials
- 12.1.7.4. SWOT Analysis
- 12.1.8 Xinjiang Guolin New Materials Co Ltd
- 12.1.8.1. Company Overview
- 12.1.8.2. Products
- 12.1.8.3. Company Financials
- 12.1.8.4. SWOT Analysis
- 12.1.9 STAN Chemical Co Ltd
- 12.1.9.1. Company Overview
- 12.1.9.2. Products
- 12.1.9.3. Company Financials
- 12.1.9.4. SWOT Analysis
- 12.1.10 Ensince Industry Co Ltd *List Not Exhaustive
- 12.1.10.1. Company Overview
- 12.1.10.2. Products
- 12.1.10.3. Company Financials
- 12.1.10.4. SWOT Analysis
- 12.1.1 Haihang Industry
- 12.2. Market Entropy
- 12.2.1 Company's Key Areas Served
- 12.2.2 Recent Developments
- 12.3. Company Market Share Analysis 2025
- 12.3.1 Top 5 Companies Market Share Analysis
- 12.3.2 Top 3 Companies Market Share Analysis
- 12.4. List of Potential Customers
- 13. Research Methodology
List of Figures
- Figure 1: Global Glyoxalic Acid Industry Revenue Breakdown (million, %) by Region 2025 & 2033
- Figure 2: Global Glyoxalic Acid Industry Volume Breakdown (kilotons, %) by Region 2025 & 2033
- Figure 3: Asia Pacific Glyoxalic Acid Industry Revenue (million), by End-user 2025 & 2033
- Figure 4: Asia Pacific Glyoxalic Acid Industry Volume (kilotons), by End-user 2025 & 2033
- Figure 5: Asia Pacific Glyoxalic Acid Industry Revenue Share (%), by End-user 2025 & 2033
- Figure 6: Asia Pacific Glyoxalic Acid Industry Volume Share (%), by End-user 2025 & 2033
- Figure 7: Asia Pacific Glyoxalic Acid Industry Revenue (million), by Country 2025 & 2033
- Figure 8: Asia Pacific Glyoxalic Acid Industry Volume (kilotons), by Country 2025 & 2033
- Figure 9: Asia Pacific Glyoxalic Acid Industry Revenue Share (%), by Country 2025 & 2033
- Figure 10: Asia Pacific Glyoxalic Acid Industry Volume Share (%), by Country 2025 & 2033
- Figure 11: North America Glyoxalic Acid Industry Revenue (million), by End-user 2025 & 2033
- Figure 12: North America Glyoxalic Acid Industry Volume (kilotons), by End-user 2025 & 2033
- Figure 13: North America Glyoxalic Acid Industry Revenue Share (%), by End-user 2025 & 2033
- Figure 14: North America Glyoxalic Acid Industry Volume Share (%), by End-user 2025 & 2033
- Figure 15: North America Glyoxalic Acid Industry Revenue (million), by Country 2025 & 2033
- Figure 16: North America Glyoxalic Acid Industry Volume (kilotons), by Country 2025 & 2033
- Figure 17: North America Glyoxalic Acid Industry Revenue Share (%), by Country 2025 & 2033
- Figure 18: North America Glyoxalic Acid Industry Volume Share (%), by Country 2025 & 2033
- Figure 19: Europe Glyoxalic Acid Industry Revenue (million), by End-user 2025 & 2033
- Figure 20: Europe Glyoxalic Acid Industry Volume (kilotons), by End-user 2025 & 2033
- Figure 21: Europe Glyoxalic Acid Industry Revenue Share (%), by End-user 2025 & 2033
- Figure 22: Europe Glyoxalic Acid Industry Volume Share (%), by End-user 2025 & 2033
- Figure 23: Europe Glyoxalic Acid Industry Revenue (million), by Country 2025 & 2033
- Figure 24: Europe Glyoxalic Acid Industry Volume (kilotons), by Country 2025 & 2033
- Figure 25: Europe Glyoxalic Acid Industry Revenue Share (%), by Country 2025 & 2033
- Figure 26: Europe Glyoxalic Acid Industry Volume Share (%), by Country 2025 & 2033
- Figure 27: South America Glyoxalic Acid Industry Revenue (million), by End-user 2025 & 2033
- Figure 28: South America Glyoxalic Acid Industry Volume (kilotons), by End-user 2025 & 2033
- Figure 29: South America Glyoxalic Acid Industry Revenue Share (%), by End-user 2025 & 2033
- Figure 30: South America Glyoxalic Acid Industry Volume Share (%), by End-user 2025 & 2033
- Figure 31: South America Glyoxalic Acid Industry Revenue (million), by Country 2025 & 2033
- Figure 32: South America Glyoxalic Acid Industry Volume (kilotons), by Country 2025 & 2033
- Figure 33: South America Glyoxalic Acid Industry Revenue Share (%), by Country 2025 & 2033
- Figure 34: South America Glyoxalic Acid Industry Volume Share (%), by Country 2025 & 2033
- Figure 35: Middle East and Africa Glyoxalic Acid Industry Revenue (million), by End-user 2025 & 2033
- Figure 36: Middle East and Africa Glyoxalic Acid Industry Volume (kilotons), by End-user 2025 & 2033
- Figure 37: Middle East and Africa Glyoxalic Acid Industry Revenue Share (%), by End-user 2025 & 2033
- Figure 38: Middle East and Africa Glyoxalic Acid Industry Volume Share (%), by End-user 2025 & 2033
- Figure 39: Middle East and Africa Glyoxalic Acid Industry Revenue (million), by Country 2025 & 2033
- Figure 40: Middle East and Africa Glyoxalic Acid Industry Volume (kilotons), by Country 2025 & 2033
- Figure 41: Middle East and Africa Glyoxalic Acid Industry Revenue Share (%), by Country 2025 & 2033
- Figure 42: Middle East and Africa Glyoxalic Acid Industry Volume Share (%), by Country 2025 & 2033
List of Tables
- Table 1: Global Glyoxalic Acid Industry Revenue million Forecast, by End-user 2020 & 2033
- Table 2: Global Glyoxalic Acid Industry Volume kilotons Forecast, by End-user 2020 & 2033
- Table 3: Global Glyoxalic Acid Industry Revenue million Forecast, by Region 2020 & 2033
- Table 4: Global Glyoxalic Acid Industry Volume kilotons Forecast, by Region 2020 & 2033
- Table 5: Global Glyoxalic Acid Industry Revenue million Forecast, by End-user 2020 & 2033
- Table 6: Global Glyoxalic Acid Industry Volume kilotons Forecast, by End-user 2020 & 2033
- Table 7: Global Glyoxalic Acid Industry Revenue million Forecast, by Country 2020 & 2033
- Table 8: Global Glyoxalic Acid Industry Volume kilotons Forecast, by Country 2020 & 2033
- Table 9: China Glyoxalic Acid Industry Revenue (million) Forecast, by Application 2020 & 2033
- Table 10: China Glyoxalic Acid Industry Volume (kilotons) Forecast, by Application 2020 & 2033
- Table 11: India Glyoxalic Acid Industry Revenue (million) Forecast, by Application 2020 & 2033
- Table 12: India Glyoxalic Acid Industry Volume (kilotons) Forecast, by Application 2020 & 2033
- Table 13: Japan Glyoxalic Acid Industry Revenue (million) Forecast, by Application 2020 & 2033
- Table 14: Japan Glyoxalic Acid Industry Volume (kilotons) Forecast, by Application 2020 & 2033
- Table 15: South Korea Glyoxalic Acid Industry Revenue (million) Forecast, by Application 2020 & 2033
- Table 16: South Korea Glyoxalic Acid Industry Volume (kilotons) Forecast, by Application 2020 & 2033
- Table 17: Rest of Asia Pacific Glyoxalic Acid Industry Revenue (million) Forecast, by Application 2020 & 2033
- Table 18: Rest of Asia Pacific Glyoxalic Acid Industry Volume (kilotons) Forecast, by Application 2020 & 2033
- Table 19: Global Glyoxalic Acid Industry Revenue million Forecast, by End-user 2020 & 2033
- Table 20: Global Glyoxalic Acid Industry Volume kilotons Forecast, by End-user 2020 & 2033
- Table 21: Global Glyoxalic Acid Industry Revenue million Forecast, by Country 2020 & 2033
- Table 22: Global Glyoxalic Acid Industry Volume kilotons Forecast, by Country 2020 & 2033
- Table 23: United States Glyoxalic Acid Industry Revenue (million) Forecast, by Application 2020 & 2033
- Table 24: United States Glyoxalic Acid Industry Volume (kilotons) Forecast, by Application 2020 & 2033
- Table 25: Canada Glyoxalic Acid Industry Revenue (million) Forecast, by Application 2020 & 2033
- Table 26: Canada Glyoxalic Acid Industry Volume (kilotons) Forecast, by Application 2020 & 2033
- Table 27: Mexico Glyoxalic Acid Industry Revenue (million) Forecast, by Application 2020 & 2033
- Table 28: Mexico Glyoxalic Acid Industry Volume (kilotons) Forecast, by Application 2020 & 2033
- Table 29: Global Glyoxalic Acid Industry Revenue million Forecast, by End-user 2020 & 2033
- Table 30: Global Glyoxalic Acid Industry Volume kilotons Forecast, by End-user 2020 & 2033
- Table 31: Global Glyoxalic Acid Industry Revenue million Forecast, by Country 2020 & 2033
- Table 32: Global Glyoxalic Acid Industry Volume kilotons Forecast, by Country 2020 & 2033
- Table 33: Germany Glyoxalic Acid Industry Revenue (million) Forecast, by Application 2020 & 2033
- Table 34: Germany Glyoxalic Acid Industry Volume (kilotons) Forecast, by Application 2020 & 2033
- Table 35: United Kingdom Glyoxalic Acid Industry Revenue (million) Forecast, by Application 2020 & 2033
- Table 36: United Kingdom Glyoxalic Acid Industry Volume (kilotons) Forecast, by Application 2020 & 2033
- Table 37: Italy Glyoxalic Acid Industry Revenue (million) Forecast, by Application 2020 & 2033
- Table 38: Italy Glyoxalic Acid Industry Volume (kilotons) Forecast, by Application 2020 & 2033
- Table 39: France Glyoxalic Acid Industry Revenue (million) Forecast, by Application 2020 & 2033
- Table 40: France Glyoxalic Acid Industry Volume (kilotons) Forecast, by Application 2020 & 2033
- Table 41: Rest of Europe Glyoxalic Acid Industry Revenue (million) Forecast, by Application 2020 & 2033
- Table 42: Rest of Europe Glyoxalic Acid Industry Volume (kilotons) Forecast, by Application 2020 & 2033
- Table 43: Global Glyoxalic Acid Industry Revenue million Forecast, by End-user 2020 & 2033
- Table 44: Global Glyoxalic Acid Industry Volume kilotons Forecast, by End-user 2020 & 2033
- Table 45: Global Glyoxalic Acid Industry Revenue million Forecast, by Country 2020 & 2033
- Table 46: Global Glyoxalic Acid Industry Volume kilotons Forecast, by Country 2020 & 2033
- Table 47: Brazil Glyoxalic Acid Industry Revenue (million) Forecast, by Application 2020 & 2033
- Table 48: Brazil Glyoxalic Acid Industry Volume (kilotons) Forecast, by Application 2020 & 2033
- Table 49: Argentina Glyoxalic Acid Industry Revenue (million) Forecast, by Application 2020 & 2033
- Table 50: Argentina Glyoxalic Acid Industry Volume (kilotons) Forecast, by Application 2020 & 2033
- Table 51: Rest of South America Glyoxalic Acid Industry Revenue (million) Forecast, by Application 2020 & 2033
- Table 52: Rest of South America Glyoxalic Acid Industry Volume (kilotons) Forecast, by Application 2020 & 2033
- Table 53: Global Glyoxalic Acid Industry Revenue million Forecast, by End-user 2020 & 2033
- Table 54: Global Glyoxalic Acid Industry Volume kilotons Forecast, by End-user 2020 & 2033
- Table 55: Global Glyoxalic Acid Industry Revenue million Forecast, by Country 2020 & 2033
- Table 56: Global Glyoxalic Acid Industry Volume kilotons Forecast, by Country 2020 & 2033
- Table 57: Saudi Arabia Glyoxalic Acid Industry Revenue (million) Forecast, by Application 2020 & 2033
- Table 58: Saudi Arabia Glyoxalic Acid Industry Volume (kilotons) Forecast, by Application 2020 & 2033
- Table 59: South Africa Glyoxalic Acid Industry Revenue (million) Forecast, by Application 2020 & 2033
- Table 60: South Africa Glyoxalic Acid Industry Volume (kilotons) Forecast, by Application 2020 & 2033
- Table 61: Rest of Middle East and Africa Glyoxalic Acid Industry Revenue (million) Forecast, by Application 2020 & 2033
- Table 62: Rest of Middle East and Africa Glyoxalic Acid Industry Volume (kilotons) Forecast, by Application 2020 & 2033
Frequently Asked Questions
1. What is the projected Compound Annual Growth Rate (CAGR) of the Glyoxalic Acid Industry?
The projected CAGR is approximately 3.98%.
2. Which companies are prominent players in the Glyoxalic Acid Industry?
Key companies in the market include Haihang Industry, Amzole India Pvt Ltd, WeylChem International GmbH, Zhonglan Industry Co Ltd, Akema S r l, JIAXING ZHONGHUA CHEMICAL Co Ltd, Hubei Hongyuan Pharmaceutical Technology Co Ltd, Xinjiang Guolin New Materials Co Ltd, STAN Chemical Co Ltd, Ensince Industry Co Ltd *List Not Exhaustive.
3. What are the main segments of the Glyoxalic Acid Industry?
The market segments include End-user.
4. Can you provide details about the market size?
The market size is estimated to be USD 364 million as of 2022.
5. What are some drivers contributing to market growth?
Increasing Demand from Agrochemicals Sector; Growing Applications from Personal Care and Cosmetic Industry; Other Drivers.
6. What are the notable trends driving market growth?
Increasing demand from Personal Care and Cosmetics Sector.
7. Are there any restraints impacting market growth?
Stringent Regulation Regarding Emission Control and Waste Disposal; Other Restraints.
8. Can you provide examples of recent developments in the market?
August 2023: Chemours completes the sale of glycolic acid business to Iron Path Capital-backed PureTech Scientific, LLC for USD 137 million.
9. What pricing options are available for accessing the report?
Pricing options include single-user, multi-user, and enterprise licenses priced at USD 4750, USD 5250, and USD 8750 respectively.
10. Is the market size provided in terms of value or volume?
The market size is provided in terms of value, measured in million and volume, measured in kilotons.
11. Are there any specific market keywords associated with the report?
Yes, the market keyword associated with the report is "Glyoxalic Acid Industry," which aids in identifying and referencing the specific market segment covered.
12. How do I determine which pricing option suits my needs best?
The pricing options vary based on user requirements and access needs. Individual users may opt for single-user licenses, while businesses requiring broader access may choose multi-user or enterprise licenses for cost-effective access to the report.
13. Are there any additional resources or data provided in the Glyoxalic Acid Industry report?
While the report offers comprehensive insights, it's advisable to review the specific contents or supplementary materials provided to ascertain if additional resources or data are available.
14. How can I stay updated on further developments or reports in the Glyoxalic Acid Industry?
To stay informed about further developments, trends, and reports in the Glyoxalic Acid Industry, consider subscribing to industry newsletters, following relevant companies and organizations, or regularly checking reputable industry news sources and publications.
Methodology
Step 1 - Identification of Relevant Samples Size from Population Database


Step 2 - Approaches for Defining Global Market Size (Value, Volume* & Price*)

Note*: In applicable scenarios
Step 3 - Data Sources
Primary Research
- Web Analytics
- Survey Reports
- Research Institute
- Latest Research Reports
- Opinion Leaders
Secondary Research
- Annual Reports
- White Paper
- Latest Press Release
- Industry Association
- Paid Database
- Investor Presentations

Step 4 - Data Triangulation
Involves using different sources of information in order to increase the validity of a study
These sources are likely to be stakeholders in a program - participants, other researchers, program staff, other community members, and so on.
Then we put all data in single framework & apply various statistical tools to find out the dynamic on the market.
During the analysis stage, feedback from the stakeholder groups would be compared to determine areas of agreement as well as areas of divergence