

Key Insights
The global graphite electrode market, valued at approximately $4.48 billion in 2025, is poised for robust expansion, projected to achieve a Compound Annual Growth Rate (CAGR) of 6.48% from 2025 to 2033. This upward trajectory is predominantly driven by escalating steel demand, particularly in rapidly industrializing emerging economies. The burgeoning electric vehicle (EV) sector and its associated battery manufacturing expansion further bolster the demand for premium graphite electrodes. Technological innovations focused on enhanced electrode efficiency and longevity are also key market drivers. Leading entities such as GrafTech International, HEG Limited, and Nippon Carbon Co Ltd are actively investing in R&D and expanding production capacities to address dynamic market requirements. However, the industry navigates challenges including volatile raw material costs (petroleum coke and needle coke) and stringent environmental regulations. Market segmentation by electrode type (e.g., high-power, ultra-high-power) and application (e.g., steelmaking, aluminum smelting) significantly influences market dynamics, with intensifying competition among established and emerging players fostering strategic collaborations and M&A activities.
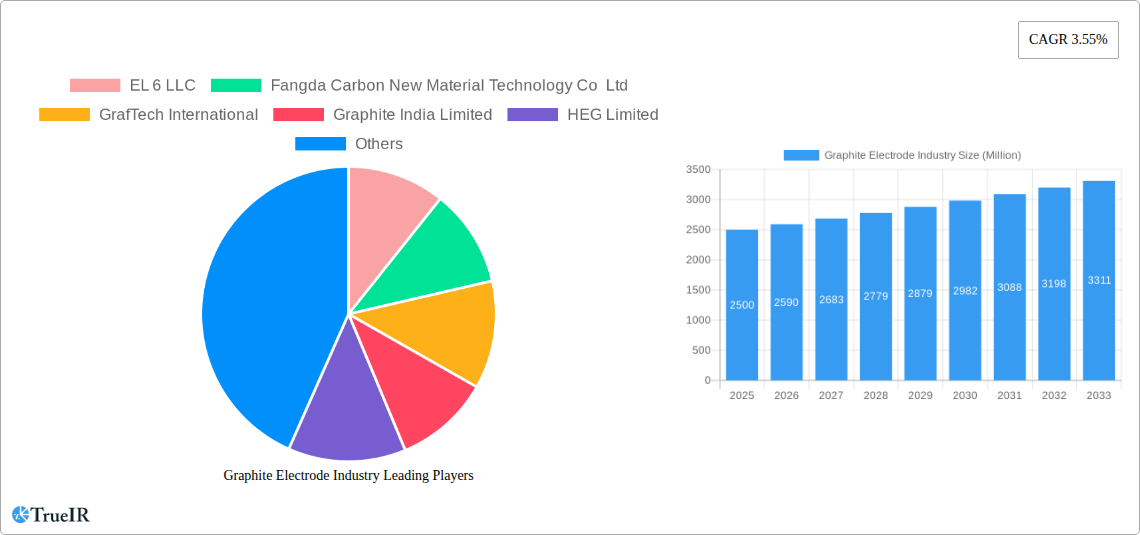
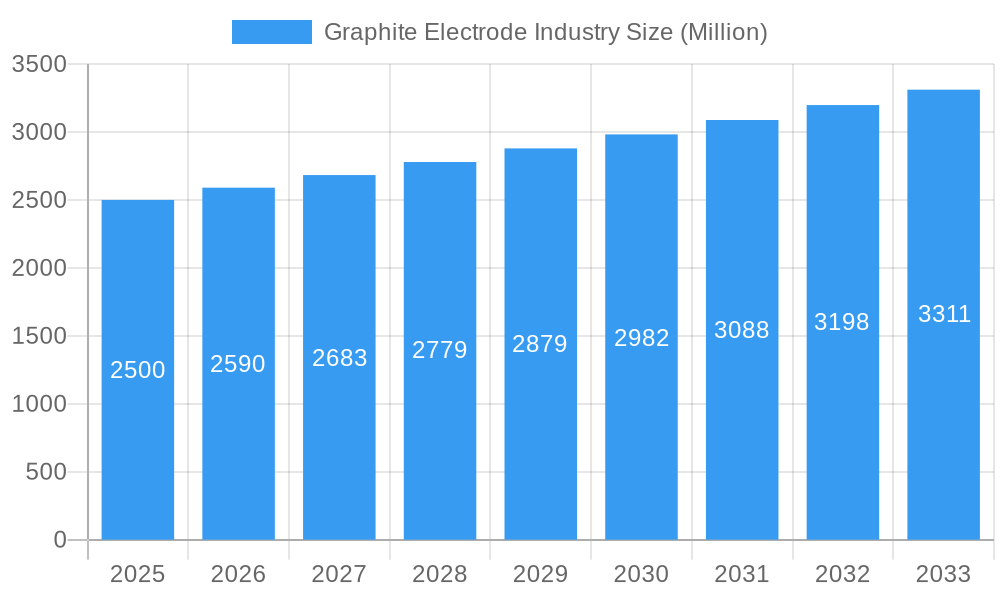
Graphite Electrode Industry Market Size (In Billion)
The forecast period (2025-2033) anticipates sustained growth, potentially moderating in the latter half of the decade due to global economic shifts and industrial production patterns. Significant regional variations in growth are expected, with industrially dynamic regions exhibiting higher graphite electrode demand. The competitive landscape comprises major multinational corporations and specialized regional producers, each leveraging distinct advantages in technology, market reach, and cost-effectiveness. The long-term outlook for the graphite electrode industry remains optimistic, underpinned by the continued essential role of steel production and the rise of new applications like EV batteries. Effective navigation of raw material price fluctuations and regulatory compliance is critical for sustained market growth.
Graphite Electrode Industry Company Market Share
Graphite Electrode Industry Market Report: 2019-2033
This comprehensive report provides a detailed analysis of the global graphite electrode industry, covering market size, trends, competitive landscape, and future outlook from 2019 to 2033. With a focus on key players, technological advancements, and regulatory impacts, this report is an essential resource for industry professionals, investors, and researchers seeking to understand and navigate this dynamic market. The base year for this analysis is 2025, with estimations for 2025 and forecasts extending to 2033. The historical period covered is 2019-2024.
Graphite Electrode Industry Market Structure & Competitive Landscape
The global graphite electrode market is characterized by a moderately concentrated structure with several major players controlling a significant market share. The 2024 Herfindahl-Hirschman Index (HHI) is estimated at xx, indicating a moderately consolidated market. Innovation is driven by the need for higher performance electrodes, particularly in the steelmaking industry, demanding increased purity, strength, and electrical conductivity. Stringent environmental regulations concerning greenhouse gas emissions and waste management significantly impact production processes and operational costs. Substitute materials, such as carbon fiber electrodes, are emerging but currently hold a relatively small market share (xx%). The market is segmented primarily by end-use industry (steelmaking being dominant), electrode grade (HP, UHP, etc.), and geography. The past five years have witnessed several mergers and acquisitions (M&A) activities, with a total transaction value of approximately $xx Million.
- Market Concentration: Moderately concentrated, with HHI estimated at xx in 2024.
- Innovation Drivers: Demand for higher-performance electrodes with enhanced purity and conductivity.
- Regulatory Impacts: Stringent environmental regulations impacting production costs and processes.
- Product Substitutes: Emergence of carbon fiber electrodes, but with limited market penetration (xx%).
- End-User Segmentation: Steelmaking (dominant), other metallurgical applications, etc.
- M&A Trends: Significant M&A activity in recent years, totaling approximately $xx Million in transaction value over the last 5 years.
Graphite Electrode Industry Market Trends & Opportunities
The global graphite electrode market is expected to witness robust growth during the forecast period (2025-2033), driven primarily by the increasing demand from the steel industry, particularly in developing economies. The market size is projected to reach $xx Million by 2033, exhibiting a Compound Annual Growth Rate (CAGR) of xx% from 2025 to 2033. Technological advancements, such as the development of high-purity graphite electrodes and improved manufacturing processes, are further propelling market expansion. Consumer preferences are shifting towards more efficient and environmentally friendly electrodes, creating opportunities for manufacturers to invest in sustainable production methods. Competitive dynamics are intense, with major players focusing on capacity expansion, strategic partnerships, and technological innovation to maintain their market share. Market penetration rates for new technologies are gradually increasing, with a projected xx% penetration by 2033. Specific regional trends include accelerated growth in [mention specific regions] due to expanding steel production capacity.
Dominant Markets & Segments in Graphite Electrode Industry
China currently dominates the global graphite electrode market, accounting for approximately xx% of the total market share in 2024. This dominance is primarily attributed to the country's large steel industry and robust infrastructure development. Other key regions include [mention specific regions], each with unique growth drivers.
- China: Dominant market share (xx%), driven by a large steel industry and infrastructure development.
- [Region 2]: Growth driven by [mention specific reasons e.g., government incentives, rising steel production].
- [Region 3]: Growth driven by [mention specific reasons e.g., expanding automotive industry, infrastructure projects].
The steelmaking segment accounts for the largest share of graphite electrode consumption, primarily due to its indispensable role in electric arc furnaces (EAF). Further growth within the steelmaking segment will rely on continued investments in EAF technology.
Graphite Electrode Industry Product Analysis
Recent product innovations focus on enhancing electrode properties, such as increased electrical conductivity, improved thermal shock resistance, and extended service life. These advancements cater to the growing demand for higher productivity and reduced operating costs in steelmaking. The competitive advantage lies in offering superior quality electrodes at competitive prices, along with reliable supply chain management. Technological advancements like improved graphitization processes and the use of advanced materials are key to maintaining market competitiveness. Key applications include steelmaking, aluminum smelting, and other metallurgical processes.
Key Drivers, Barriers & Challenges in Graphite Electrode Industry
Key Drivers: The rising global steel production, particularly in developing economies, is a primary driver. Government initiatives promoting infrastructure development and industrialization also fuel demand. Technological advancements in electrode manufacturing enhance efficiency and performance.
Challenges: Fluctuations in raw material prices (e.g., petroleum coke) impact production costs. Stringent environmental regulations necessitate investments in cleaner production technologies. Intense competition among manufacturers exerts pressure on pricing and profitability. Supply chain disruptions, especially regarding raw material availability, can severely impact production and delivery. These challenges contribute to an estimated xx% reduction in profit margins over the past 5 years.
Growth Drivers in the Graphite Electrode Industry Market
The primary growth drivers include the continued expansion of the global steel industry, especially in emerging economies. Increasing demand for high-performance electrodes from various metallurgical applications, coupled with technological advancements leading to more efficient and durable products, contributes significantly. Government support for infrastructure development in many regions creates further opportunities.
Challenges Impacting Graphite Electrode Industry Growth
Significant challenges include volatility in raw material prices, environmental regulations mandating cleaner production, and intense competition among established players. Supply chain vulnerabilities related to raw material sourcing and geopolitical factors also pose significant hurdles to consistent growth.
Key Players Shaping the Graphite Electrode Industry Market
- EL 6 LLC
- Fangda Carbon New Material Technology Co Ltd
- GrafTech International
- Graphite India Limited
- HEG Limited
- Kaifeng Pingmei New Carbon Materials Technology Co Ltd
- Liaoning Dantan Technology Group Co Ltd (Dan Carbon)
- Nantong Yangzi Carbon Co Ltd
- Nippon Carbon Co Ltd
- Sangraf International Inc
- SEC Carbon Limited
- Resonac Holdings Corporation
- Tokai Carbon Co Ltd
- Zhongze Group *List Not Exhaustive
Significant Graphite Electrode Industry Industry Milestones
- January 2023: Showa Denko K.K. (SDK) and Showa Denko Materials Co. Ltd. merged, forming Resonac Holdings Corporation and Resonac Corporation, streamlining operations in the graphite electrode sector. This merger significantly impacted market consolidation and supply chain dynamics.
Future Outlook for Graphite Electrode Industry Market
The graphite electrode market is poised for continued growth, fueled by the expanding global steel industry and increasing demand for high-performance electrodes. Strategic investments in research and development, coupled with a focus on sustainability and efficient supply chain management, will be crucial for success. The market presents significant opportunities for both established players and new entrants, particularly those focusing on innovation and technological advancements. The projected growth rate suggests strong potential for investment and market expansion throughout the forecast period.
Graphite Electrode Industry Segmentation
-
1. Electrode Grade
- 1.1. Ultra High Power (UHP)
- 1.2. High Power (SHP)
- 1.3. Regular Power (RP)
-
2. Application
- 2.1. Electric Arc Furnace
- 2.2. Basic Oxygen Furnace
- 2.3. Non-steel Application
Graphite Electrode Industry Segmentation By Geography
-
1. Asia Pacific
- 1.1. China
- 1.2. India
- 1.3. Japan
- 1.4. South Korea
- 1.5. Malaysia
- 1.6. Thailand
- 1.7. Indonesia
- 1.8. Vietnam
- 1.9. Rest of Asia Pacific
-
2. North America
- 2.1. United States
- 2.2. Canada
- 2.3. Mexico
-
3. Europe
- 3.1. Germany
- 3.2. United Kingdom
- 3.3. France
- 3.4. Italy
- 3.5. Spain
- 3.6. Nordic Countries
- 3.7. Turkey
- 3.8. Russia
- 3.9. Rest of Europe
-
4. South America
- 4.1. Brazil
- 4.2. Argentina
- 4.3. Colombia
- 4.4. Rest of South America
-
5. Middle East and Africa
- 5.1. Saudi Arabia
- 5.2. Qatar
- 5.3. United Arab Emirates
- 5.4. Egypt
- 5.5. South Africa
- 5.6. Rest of Middle East and Africa
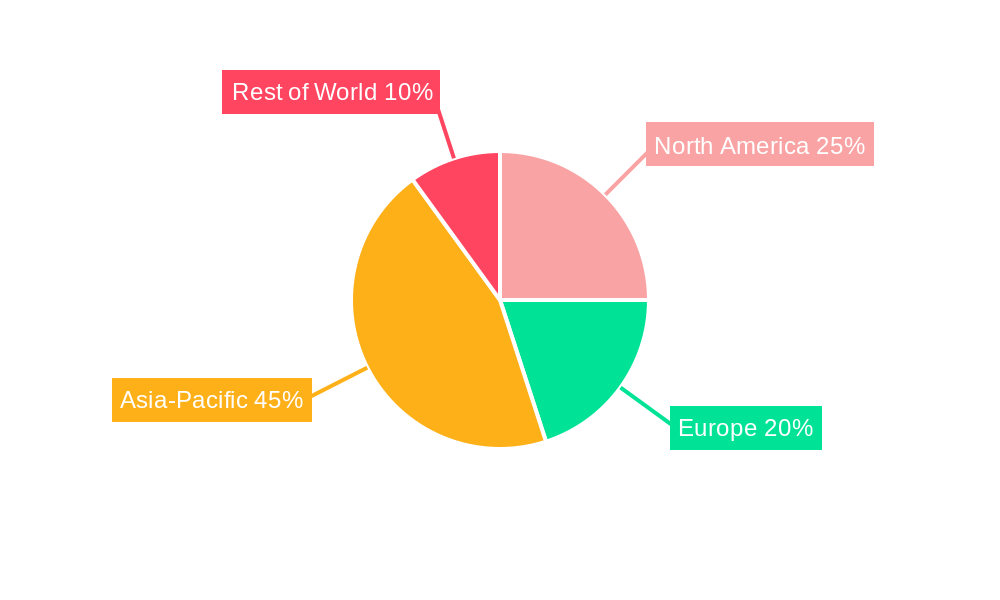
Graphite Electrode Industry Regional Market Share
Geographic Coverage of Graphite Electrode Industry
Graphite Electrode Industry REPORT HIGHLIGHTS
| Aspects | Details |
|---|---|
| Study Period | 2020-2034 |
| Base Year | 2025 |
| Estimated Year | 2026 |
| Forecast Period | 2026-2034 |
| Historical Period | 2020-2025 |
| Growth Rate | CAGR of 6.48% from 2020-2034 |
| Segmentation |
|
Table of Contents
- 1. Introduction
- 1.1. Research Scope
- 1.2. Market Segmentation
- 1.3. Research Objective
- 1.4. Definitions and Assumptions
- 2. Executive Summary
- 2.1. Market Snapshot
- 3. Market Dynamics
- 3.1. Market Drivers
- 3.2. Market Restrains
- 3.3. Market Trends
- 3.4. Market Opportunities
- 4. Market Factor Analysis
- 4.1. Porters Five Forces
- 4.1.1. Bargaining Power of Suppliers
- 4.1.2. Bargaining Power of Buyers
- 4.1.3. Threat of New Entrants
- 4.1.4. Threat of Substitutes
- 4.1.5. Competitive Rivalry
- 4.2. PESTEL analysis
- 4.3. BCG Analysis
- 4.3.1. Stars (High Growth, High Market Share)
- 4.3.2. Cash Cows (Low Growth, High Market Share)
- 4.3.3. Question Mark (High Growth, Low Market Share)
- 4.3.4. Dogs (Low Growth, Low Market Share)
- 4.4. Ansoff Matrix Analysis
- 4.5. Supply Chain Analysis
- 4.6. Regulatory Landscape
- 4.7. Current Market Potential and Opportunity Assessment (TAM–SAM–SOM Framework)
- 4.8. TIR Analyst Note
- 4.1. Porters Five Forces
- 5. Market Analysis, Insights and Forecast 2021-2033
- 5.1. Market Analysis, Insights and Forecast - by Electrode Grade
- 5.1.1. Ultra High Power (UHP)
- 5.1.2. High Power (SHP)
- 5.1.3. Regular Power (RP)
- 5.2. Market Analysis, Insights and Forecast - by Application
- 5.2.1. Electric Arc Furnace
- 5.2.2. Basic Oxygen Furnace
- 5.2.3. Non-steel Application
- 5.3. Market Analysis, Insights and Forecast - by Region
- 5.3.1. Asia Pacific
- 5.3.2. North America
- 5.3.3. Europe
- 5.3.4. South America
- 5.3.5. Middle East and Africa
- 5.1. Market Analysis, Insights and Forecast - by Electrode Grade
- 6. Global Graphite Electrode Industry Analysis, Insights and Forecast, 2021-2033
- 6.1. Market Analysis, Insights and Forecast - by Electrode Grade
- 6.1.1. Ultra High Power (UHP)
- 6.1.2. High Power (SHP)
- 6.1.3. Regular Power (RP)
- 6.2. Market Analysis, Insights and Forecast - by Application
- 6.2.1. Electric Arc Furnace
- 6.2.2. Basic Oxygen Furnace
- 6.2.3. Non-steel Application
- 6.1. Market Analysis, Insights and Forecast - by Electrode Grade
- 7. Asia Pacific Graphite Electrode Industry Analysis, Insights and Forecast, 2020-2032
- 7.1. Market Analysis, Insights and Forecast - by Electrode Grade
- 7.1.1. Ultra High Power (UHP)
- 7.1.2. High Power (SHP)
- 7.1.3. Regular Power (RP)
- 7.2. Market Analysis, Insights and Forecast - by Application
- 7.2.1. Electric Arc Furnace
- 7.2.2. Basic Oxygen Furnace
- 7.2.3. Non-steel Application
- 7.1. Market Analysis, Insights and Forecast - by Electrode Grade
- 8. North America Graphite Electrode Industry Analysis, Insights and Forecast, 2020-2032
- 8.1. Market Analysis, Insights and Forecast - by Electrode Grade
- 8.1.1. Ultra High Power (UHP)
- 8.1.2. High Power (SHP)
- 8.1.3. Regular Power (RP)
- 8.2. Market Analysis, Insights and Forecast - by Application
- 8.2.1. Electric Arc Furnace
- 8.2.2. Basic Oxygen Furnace
- 8.2.3. Non-steel Application
- 8.1. Market Analysis, Insights and Forecast - by Electrode Grade
- 9. Europe Graphite Electrode Industry Analysis, Insights and Forecast, 2020-2032
- 9.1. Market Analysis, Insights and Forecast - by Electrode Grade
- 9.1.1. Ultra High Power (UHP)
- 9.1.2. High Power (SHP)
- 9.1.3. Regular Power (RP)
- 9.2. Market Analysis, Insights and Forecast - by Application
- 9.2.1. Electric Arc Furnace
- 9.2.2. Basic Oxygen Furnace
- 9.2.3. Non-steel Application
- 9.1. Market Analysis, Insights and Forecast - by Electrode Grade
- 10. South America Graphite Electrode Industry Analysis, Insights and Forecast, 2020-2032
- 10.1. Market Analysis, Insights and Forecast - by Electrode Grade
- 10.1.1. Ultra High Power (UHP)
- 10.1.2. High Power (SHP)
- 10.1.3. Regular Power (RP)
- 10.2. Market Analysis, Insights and Forecast - by Application
- 10.2.1. Electric Arc Furnace
- 10.2.2. Basic Oxygen Furnace
- 10.2.3. Non-steel Application
- 10.1. Market Analysis, Insights and Forecast - by Electrode Grade
- 11. Middle East and Africa Graphite Electrode Industry Analysis, Insights and Forecast, 2020-2032
- 11.1. Market Analysis, Insights and Forecast - by Electrode Grade
- 11.1.1. Ultra High Power (UHP)
- 11.1.2. High Power (SHP)
- 11.1.3. Regular Power (RP)
- 11.2. Market Analysis, Insights and Forecast - by Application
- 11.2.1. Electric Arc Furnace
- 11.2.2. Basic Oxygen Furnace
- 11.2.3. Non-steel Application
- 11.1. Market Analysis, Insights and Forecast - by Electrode Grade
- 12. Competitive Analysis
- 12.1. Company Profiles
- 12.1.1 EL 6 LLC
- 12.1.1.1. Company Overview
- 12.1.1.2. Products
- 12.1.1.3. Company Financials
- 12.1.1.4. SWOT Analysis
- 12.1.2 Fangda Carbon New Material Technology Co Ltd
- 12.1.2.1. Company Overview
- 12.1.2.2. Products
- 12.1.2.3. Company Financials
- 12.1.2.4. SWOT Analysis
- 12.1.3 GrafTech International
- 12.1.3.1. Company Overview
- 12.1.3.2. Products
- 12.1.3.3. Company Financials
- 12.1.3.4. SWOT Analysis
- 12.1.4 Graphite India Limited
- 12.1.4.1. Company Overview
- 12.1.4.2. Products
- 12.1.4.3. Company Financials
- 12.1.4.4. SWOT Analysis
- 12.1.5 HEG Limited
- 12.1.5.1. Company Overview
- 12.1.5.2. Products
- 12.1.5.3. Company Financials
- 12.1.5.4. SWOT Analysis
- 12.1.6 Kaifeng Pingmei New Carbon Materials Technology Co Ltd
- 12.1.6.1. Company Overview
- 12.1.6.2. Products
- 12.1.6.3. Company Financials
- 12.1.6.4. SWOT Analysis
- 12.1.7 Liaoning Dantan Technology Group Co Ltd (Dan Carbon)
- 12.1.7.1. Company Overview
- 12.1.7.2. Products
- 12.1.7.3. Company Financials
- 12.1.7.4. SWOT Analysis
- 12.1.8 Nantong Yangzi Carbon Co Ltd
- 12.1.8.1. Company Overview
- 12.1.8.2. Products
- 12.1.8.3. Company Financials
- 12.1.8.4. SWOT Analysis
- 12.1.9 Nippon Carbon Co Ltd
- 12.1.9.1. Company Overview
- 12.1.9.2. Products
- 12.1.9.3. Company Financials
- 12.1.9.4. SWOT Analysis
- 12.1.10 Sangraf International Inc
- 12.1.10.1. Company Overview
- 12.1.10.2. Products
- 12.1.10.3. Company Financials
- 12.1.10.4. SWOT Analysis
- 12.1.11 SEC Carbon Limited
- 12.1.11.1. Company Overview
- 12.1.11.2. Products
- 12.1.11.3. Company Financials
- 12.1.11.4. SWOT Analysis
- 12.1.12 Resonac Holdings Corporation
- 12.1.12.1. Company Overview
- 12.1.12.2. Products
- 12.1.12.3. Company Financials
- 12.1.12.4. SWOT Analysis
- 12.1.13 Tokai Carbon Co Ltd
- 12.1.13.1. Company Overview
- 12.1.13.2. Products
- 12.1.13.3. Company Financials
- 12.1.13.4. SWOT Analysis
- 12.1.14 Zhongze Group*List Not Exhaustive
- 12.1.14.1. Company Overview
- 12.1.14.2. Products
- 12.1.14.3. Company Financials
- 12.1.14.4. SWOT Analysis
- 12.1.1 EL 6 LLC
- 12.2. Market Entropy
- 12.2.1 Company's Key Areas Served
- 12.2.2 Recent Developments
- 12.3. Company Market Share Analysis 2025
- 12.3.1 Top 5 Companies Market Share Analysis
- 12.3.2 Top 3 Companies Market Share Analysis
- 12.4. List of Potential Customers
- 13. Research Methodology
List of Figures
- Figure 1: Global Graphite Electrode Industry Revenue Breakdown (billion, %) by Region 2025 & 2033
- Figure 2: Asia Pacific Graphite Electrode Industry Revenue (billion), by Electrode Grade 2025 & 2033
- Figure 3: Asia Pacific Graphite Electrode Industry Revenue Share (%), by Electrode Grade 2025 & 2033
- Figure 4: Asia Pacific Graphite Electrode Industry Revenue (billion), by Application 2025 & 2033
- Figure 5: Asia Pacific Graphite Electrode Industry Revenue Share (%), by Application 2025 & 2033
- Figure 6: Asia Pacific Graphite Electrode Industry Revenue (billion), by Country 2025 & 2033
- Figure 7: Asia Pacific Graphite Electrode Industry Revenue Share (%), by Country 2025 & 2033
- Figure 8: North America Graphite Electrode Industry Revenue (billion), by Electrode Grade 2025 & 2033
- Figure 9: North America Graphite Electrode Industry Revenue Share (%), by Electrode Grade 2025 & 2033
- Figure 10: North America Graphite Electrode Industry Revenue (billion), by Application 2025 & 2033
- Figure 11: North America Graphite Electrode Industry Revenue Share (%), by Application 2025 & 2033
- Figure 12: North America Graphite Electrode Industry Revenue (billion), by Country 2025 & 2033
- Figure 13: North America Graphite Electrode Industry Revenue Share (%), by Country 2025 & 2033
- Figure 14: Europe Graphite Electrode Industry Revenue (billion), by Electrode Grade 2025 & 2033
- Figure 15: Europe Graphite Electrode Industry Revenue Share (%), by Electrode Grade 2025 & 2033
- Figure 16: Europe Graphite Electrode Industry Revenue (billion), by Application 2025 & 2033
- Figure 17: Europe Graphite Electrode Industry Revenue Share (%), by Application 2025 & 2033
- Figure 18: Europe Graphite Electrode Industry Revenue (billion), by Country 2025 & 2033
- Figure 19: Europe Graphite Electrode Industry Revenue Share (%), by Country 2025 & 2033
- Figure 20: South America Graphite Electrode Industry Revenue (billion), by Electrode Grade 2025 & 2033
- Figure 21: South America Graphite Electrode Industry Revenue Share (%), by Electrode Grade 2025 & 2033
- Figure 22: South America Graphite Electrode Industry Revenue (billion), by Application 2025 & 2033
- Figure 23: South America Graphite Electrode Industry Revenue Share (%), by Application 2025 & 2033
- Figure 24: South America Graphite Electrode Industry Revenue (billion), by Country 2025 & 2033
- Figure 25: South America Graphite Electrode Industry Revenue Share (%), by Country 2025 & 2033
- Figure 26: Middle East and Africa Graphite Electrode Industry Revenue (billion), by Electrode Grade 2025 & 2033
- Figure 27: Middle East and Africa Graphite Electrode Industry Revenue Share (%), by Electrode Grade 2025 & 2033
- Figure 28: Middle East and Africa Graphite Electrode Industry Revenue (billion), by Application 2025 & 2033
- Figure 29: Middle East and Africa Graphite Electrode Industry Revenue Share (%), by Application 2025 & 2033
- Figure 30: Middle East and Africa Graphite Electrode Industry Revenue (billion), by Country 2025 & 2033
- Figure 31: Middle East and Africa Graphite Electrode Industry Revenue Share (%), by Country 2025 & 2033
List of Tables
- Table 1: Global Graphite Electrode Industry Revenue billion Forecast, by Electrode Grade 2020 & 2033
- Table 2: Global Graphite Electrode Industry Revenue billion Forecast, by Application 2020 & 2033
- Table 3: Global Graphite Electrode Industry Revenue billion Forecast, by Region 2020 & 2033
- Table 4: Global Graphite Electrode Industry Revenue billion Forecast, by Electrode Grade 2020 & 2033
- Table 5: Global Graphite Electrode Industry Revenue billion Forecast, by Application 2020 & 2033
- Table 6: Global Graphite Electrode Industry Revenue billion Forecast, by Country 2020 & 2033
- Table 7: China Graphite Electrode Industry Revenue (billion) Forecast, by Application 2020 & 2033
- Table 8: India Graphite Electrode Industry Revenue (billion) Forecast, by Application 2020 & 2033
- Table 9: Japan Graphite Electrode Industry Revenue (billion) Forecast, by Application 2020 & 2033
- Table 10: South Korea Graphite Electrode Industry Revenue (billion) Forecast, by Application 2020 & 2033
- Table 11: Malaysia Graphite Electrode Industry Revenue (billion) Forecast, by Application 2020 & 2033
- Table 12: Thailand Graphite Electrode Industry Revenue (billion) Forecast, by Application 2020 & 2033
- Table 13: Indonesia Graphite Electrode Industry Revenue (billion) Forecast, by Application 2020 & 2033
- Table 14: Vietnam Graphite Electrode Industry Revenue (billion) Forecast, by Application 2020 & 2033
- Table 15: Rest of Asia Pacific Graphite Electrode Industry Revenue (billion) Forecast, by Application 2020 & 2033
- Table 16: Global Graphite Electrode Industry Revenue billion Forecast, by Electrode Grade 2020 & 2033
- Table 17: Global Graphite Electrode Industry Revenue billion Forecast, by Application 2020 & 2033
- Table 18: Global Graphite Electrode Industry Revenue billion Forecast, by Country 2020 & 2033
- Table 19: United States Graphite Electrode Industry Revenue (billion) Forecast, by Application 2020 & 2033
- Table 20: Canada Graphite Electrode Industry Revenue (billion) Forecast, by Application 2020 & 2033
- Table 21: Mexico Graphite Electrode Industry Revenue (billion) Forecast, by Application 2020 & 2033
- Table 22: Global Graphite Electrode Industry Revenue billion Forecast, by Electrode Grade 2020 & 2033
- Table 23: Global Graphite Electrode Industry Revenue billion Forecast, by Application 2020 & 2033
- Table 24: Global Graphite Electrode Industry Revenue billion Forecast, by Country 2020 & 2033
- Table 25: Germany Graphite Electrode Industry Revenue (billion) Forecast, by Application 2020 & 2033
- Table 26: United Kingdom Graphite Electrode Industry Revenue (billion) Forecast, by Application 2020 & 2033
- Table 27: France Graphite Electrode Industry Revenue (billion) Forecast, by Application 2020 & 2033
- Table 28: Italy Graphite Electrode Industry Revenue (billion) Forecast, by Application 2020 & 2033
- Table 29: Spain Graphite Electrode Industry Revenue (billion) Forecast, by Application 2020 & 2033
- Table 30: Nordic Countries Graphite Electrode Industry Revenue (billion) Forecast, by Application 2020 & 2033
- Table 31: Turkey Graphite Electrode Industry Revenue (billion) Forecast, by Application 2020 & 2033
- Table 32: Russia Graphite Electrode Industry Revenue (billion) Forecast, by Application 2020 & 2033
- Table 33: Rest of Europe Graphite Electrode Industry Revenue (billion) Forecast, by Application 2020 & 2033
- Table 34: Global Graphite Electrode Industry Revenue billion Forecast, by Electrode Grade 2020 & 2033
- Table 35: Global Graphite Electrode Industry Revenue billion Forecast, by Application 2020 & 2033
- Table 36: Global Graphite Electrode Industry Revenue billion Forecast, by Country 2020 & 2033
- Table 37: Brazil Graphite Electrode Industry Revenue (billion) Forecast, by Application 2020 & 2033
- Table 38: Argentina Graphite Electrode Industry Revenue (billion) Forecast, by Application 2020 & 2033
- Table 39: Colombia Graphite Electrode Industry Revenue (billion) Forecast, by Application 2020 & 2033
- Table 40: Rest of South America Graphite Electrode Industry Revenue (billion) Forecast, by Application 2020 & 2033
- Table 41: Global Graphite Electrode Industry Revenue billion Forecast, by Electrode Grade 2020 & 2033
- Table 42: Global Graphite Electrode Industry Revenue billion Forecast, by Application 2020 & 2033
- Table 43: Global Graphite Electrode Industry Revenue billion Forecast, by Country 2020 & 2033
- Table 44: Saudi Arabia Graphite Electrode Industry Revenue (billion) Forecast, by Application 2020 & 2033
- Table 45: Qatar Graphite Electrode Industry Revenue (billion) Forecast, by Application 2020 & 2033
- Table 46: United Arab Emirates Graphite Electrode Industry Revenue (billion) Forecast, by Application 2020 & 2033
- Table 47: Egypt Graphite Electrode Industry Revenue (billion) Forecast, by Application 2020 & 2033
- Table 48: South Africa Graphite Electrode Industry Revenue (billion) Forecast, by Application 2020 & 2033
- Table 49: Rest of Middle East and Africa Graphite Electrode Industry Revenue (billion) Forecast, by Application 2020 & 2033
Frequently Asked Questions
1. What is the projected Compound Annual Growth Rate (CAGR) of the Graphite Electrode Industry?
The projected CAGR is approximately 6.48%.
2. Which companies are prominent players in the Graphite Electrode Industry?
Key companies in the market include EL 6 LLC, Fangda Carbon New Material Technology Co Ltd, GrafTech International, Graphite India Limited, HEG Limited, Kaifeng Pingmei New Carbon Materials Technology Co Ltd, Liaoning Dantan Technology Group Co Ltd (Dan Carbon), Nantong Yangzi Carbon Co Ltd, Nippon Carbon Co Ltd, Sangraf International Inc, SEC Carbon Limited, Resonac Holdings Corporation, Tokai Carbon Co Ltd, Zhongze Group*List Not Exhaustive.
3. What are the main segments of the Graphite Electrode Industry?
The market segments include Electrode Grade , Application.
4. Can you provide details about the market size?
The market size is estimated to be USD 4.48 billion as of 2022.
5. What are some drivers contributing to market growth?
Strong Demand for EAF Technology for Steelmaking; Rising Availability of Steel Scrap in China.
6. What are the notable trends driving market growth?
The Electric Arc Furnace Segment to Dominate the Market.
7. Are there any restraints impacting market growth?
Strong Demand for EAF Technology for Steelmaking; Rising Availability of Steel Scrap in China.
8. Can you provide examples of recent developments in the market?
January 2023: Showa Denko K.K. (SDK) and Showa Denko Materials Co. Ltd (formerly Hitachi Chemical Company Ltd) underwent a merger. This transformation gave rise to two distinct entities, i.e., a holding company, now known as "Resonac Holdings Corporation," and a manufacturing company, named "Resonac Corporation." This merger consolidated both companies' operations, particularly in the graphite electrode sector, streamlining their manufacturing and supply chains.
9. What pricing options are available for accessing the report?
Pricing options include single-user, multi-user, and enterprise licenses priced at USD 4750, USD 5250, and USD 8750 respectively.
10. Is the market size provided in terms of value or volume?
The market size is provided in terms of value, measured in billion.
11. Are there any specific market keywords associated with the report?
Yes, the market keyword associated with the report is "Graphite Electrode Industry," which aids in identifying and referencing the specific market segment covered.
12. How do I determine which pricing option suits my needs best?
The pricing options vary based on user requirements and access needs. Individual users may opt for single-user licenses, while businesses requiring broader access may choose multi-user or enterprise licenses for cost-effective access to the report.
13. Are there any additional resources or data provided in the Graphite Electrode Industry report?
While the report offers comprehensive insights, it's advisable to review the specific contents or supplementary materials provided to ascertain if additional resources or data are available.
14. How can I stay updated on further developments or reports in the Graphite Electrode Industry?
To stay informed about further developments, trends, and reports in the Graphite Electrode Industry, consider subscribing to industry newsletters, following relevant companies and organizations, or regularly checking reputable industry news sources and publications.
Methodology
Step 1 - Identification of Relevant Samples Size from Population Database


Step 2 - Approaches for Defining Global Market Size (Value, Volume* & Price*)

Note*: In applicable scenarios
Step 3 - Data Sources
Primary Research
- Web Analytics
- Survey Reports
- Research Institute
- Latest Research Reports
- Opinion Leaders
Secondary Research
- Annual Reports
- White Paper
- Latest Press Release
- Industry Association
- Paid Database
- Investor Presentations

Step 4 - Data Triangulation
Involves using different sources of information in order to increase the validity of a study
These sources are likely to be stakeholders in a program - participants, other researchers, program staff, other community members, and so on.
Then we put all data in single framework & apply various statistical tools to find out the dynamic on the market.
During the analysis stage, feedback from the stakeholder groups would be compared to determine areas of agreement as well as areas of divergence