

Key Insights
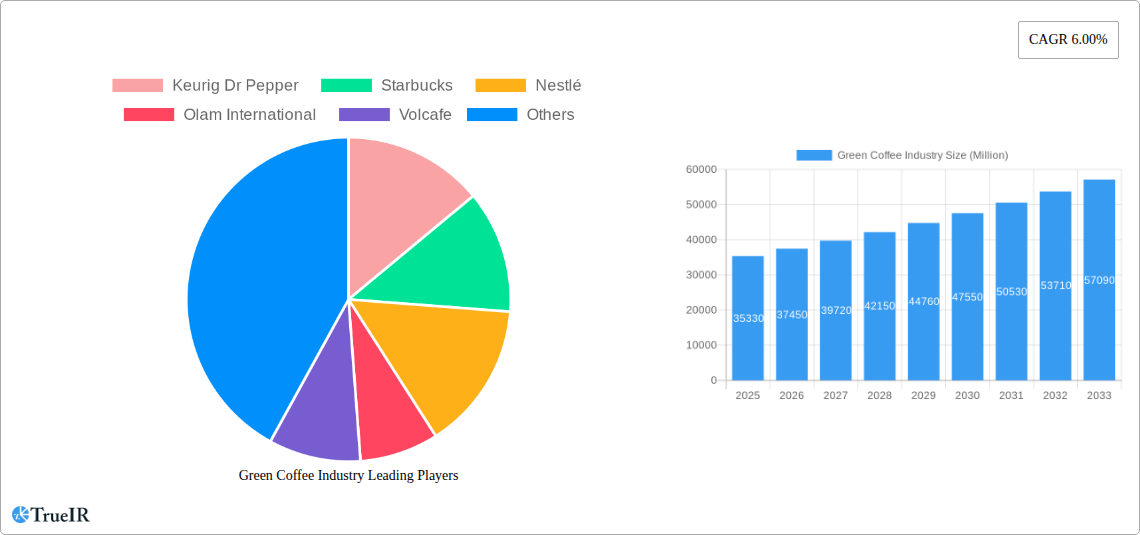
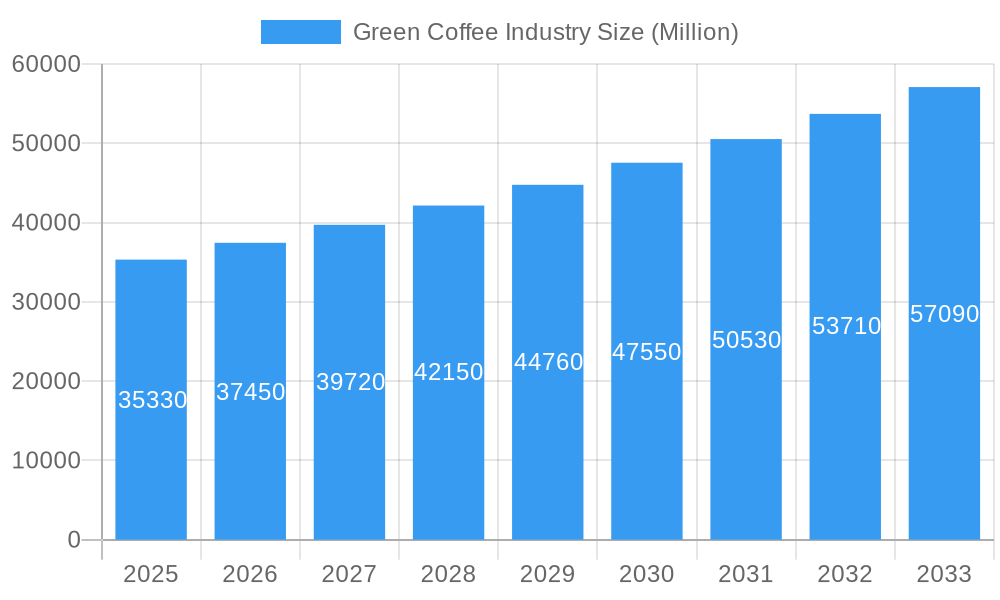
The global green coffee market, valued at $35.33 billion in 2025, is projected to experience robust growth, driven by a Compound Annual Growth Rate (CAGR) of 6.00% from 2025 to 2033. This expansion is fueled by several key factors. Increasing consumer demand for specialty coffee, particularly among millennials and Gen Z, is a significant driver. The rising popularity of at-home coffee brewing methods, including single-serve coffee makers and pour-over techniques, further boosts market growth. Health consciousness also plays a role, with consumers increasingly seeking out natural and less processed food and beverage options. The diverse applications of green coffee beans, extending beyond beverages to include food products like coffee extracts and flavored snacks, contribute to the market's expansion. Growth is also spurred by the increasing adoption of sustainable and ethically sourced coffee beans, responding to consumer preferences for environmentally and socially responsible practices. Geographic expansion into emerging markets, where coffee consumption is growing rapidly, represents another significant factor.
Green Coffee Industry Market Size (In Billion)
However, market growth is not without its challenges. Price volatility in green coffee beans due to fluctuating weather patterns and global supply chain disruptions poses a significant restraint. Competition among established coffee giants and smaller specialty roasters remains intense, necessitating continuous innovation and brand building. Furthermore, evolving consumer preferences and the need to adapt to new trends in the coffee industry require companies to invest in product development and marketing strategies. Despite these challenges, the long-term outlook for the green coffee market remains positive, driven by sustained consumer demand and strategic initiatives from key players. Regional variations exist, with North America and Europe currently holding substantial market share, while Asia-Pacific and South America demonstrate significant growth potential.
Green Coffee Industry Company Market Share
Green Coffee Industry Market Report: 2019-2033 Forecast
This comprehensive report provides a detailed analysis of the global green coffee industry, offering invaluable insights for businesses, investors, and stakeholders seeking to navigate this dynamic market. With a study period spanning 2019-2033, a base year of 2025, and a forecast period of 2025-2033, this report leverages extensive market research and data analysis to provide a holistic view of the industry's current state and future trajectory. Expect detailed breakdowns of market size (in Millions), CAGR, and crucial market segment performance, providing the actionable intelligence needed to make informed decisions.
Green Coffee Industry Market Structure & Competitive Landscape
The global green coffee market is characterized by a moderately concentrated structure, with a few major players dominating the supply chain. Key players include Keurig Dr Pepper, Starbucks, Nestlé, Olam International, Volcafe, Jacobs Douwe Egberts, Lavazza illycaffè, J.M. Smucker, and Kraft Heinz. These companies compete on factors such as product quality, brand recognition, sustainability initiatives, and supply chain efficiency. The market exhibits significant innovation driven by consumer demand for specialty coffees, sustainable sourcing, and convenient brewing methods. Regulatory changes, such as those related to fair trade and sustainability certifications, exert considerable influence. Product substitutes, such as tea and other beverages, present a degree of competitive pressure. The market's end-user segmentation comprises household consumption, commercial applications (e.g., cafes, restaurants), and other niche segments. Mergers and acquisitions (M&A) activity, totaling approximately $xx Million in the historical period, has played a significant role in shaping the market landscape.
- Market Concentration: The Herfindahl-Hirschman Index (HHI) is estimated at xx, indicating a moderately concentrated market.
- Innovation Drivers: Consumer preference for single-origin coffees, organic options, and convenient brewing systems.
- Regulatory Impacts: Regulations concerning fair trade, sustainability, and labeling significantly impact market dynamics.
- Product Substitutes: Tea and other beverages represent alternatives for consumers.
- End-User Segmentation: Household, commercial, and other segments show differing growth rates.
- M&A Trends: Significant M&A activity has led to consolidation within the industry, with a total volume of $xx Million during 2019-2024.
Green Coffee Industry Market Trends & Opportunities
The global green coffee market is poised for significant growth over the forecast period (2025-2033). The market size is projected to reach $xx Million by 2033, exhibiting a compound annual growth rate (CAGR) of xx% during this period. This expansion is fueled by rising global demand driven by increasing disposable incomes, changing consumer preferences towards healthier beverages, and the expanding popularity of specialty coffee. Technological advancements, including improvements in processing and roasting techniques, are enhancing product quality and efficiency. The market also presents several lucrative opportunities, such as developing innovative coffee products, tapping into emerging markets, and enhancing sustainability practices to align with consumer preferences. Competitive dynamics are intense, with companies focusing on brand building, product differentiation, and supply chain optimization to maintain their market share. Market penetration rates vary by region and segment, with higher rates observed in developed countries and for Arabica coffee.
Dominant Markets & Segments in Green Coffee Industry
The global green coffee market is geographically diverse, with significant presence across various regions and countries. However, specific regions such as Latin America and Asia-Pacific are expected to exhibit robust growth. Within the product type segment, Arabica coffee commands the majority of market share, owing to its superior flavor profile. In terms of application, the beverage segment dominates the market, though food applications, such as flavored coffee products, are gaining traction. The household end-user segment holds the largest market share, but the commercial segment is projected to experience significant growth during the forecast period.
- Key Growth Drivers:
- Latin America: Abundant coffee production, favorable climatic conditions.
- Asia-Pacific: Rising middle class, increased coffee consumption.
- Arabica Coffee: Superior taste and aroma, higher demand.
- Beverage Application: Established market, diversified products.
- Household End-User: Large and established consumer base.
Green Coffee Industry Product Analysis
Technological advancements are driving innovation in green coffee processing, roasting, and packaging. Methods for improving the efficiency and sustainability of these processes are constantly evolving. The market features a broad range of product offerings, catering to diverse consumer preferences. Single-origin coffees, organic varieties, and fair-trade certified coffees attract premium prices, while instant and ready-to-drink options cater to convenience-seeking consumers. The competitive advantage lies in delivering high-quality, sustainably sourced products tailored to specific consumer segments.
Key Drivers, Barriers & Challenges in Green Coffee Industry
Key Drivers:
- Increasing global demand for coffee due to rising incomes and changing lifestyle.
- Growing preference for specialty coffees, premium blends, and organic products.
- Technological advancements enhancing coffee production, processing, and packaging.
- Favorable government policies and initiatives promoting the coffee industry in several countries.
Challenges and Restraints:
- Fluctuations in coffee prices due to climate change and global supply chain disruptions.
- Increasing competition from other beverages and alternative caffeinated drinks.
- Sustainability concerns and the need for eco-friendly farming practices.
- Regulatory hurdles and compliance costs associated with fair trade, organic certification, etc. The estimated impact of these regulatory hurdles is approximately $xx Million annually.
Growth Drivers in the Green Coffee Industry Market
The green coffee industry is driven by expanding global coffee consumption fueled by population growth, rising disposable incomes, and the increasing popularity of specialty coffee. Government initiatives promoting sustainable farming practices and the development of the coffee industry in various countries further boost growth. Technological advancements in coffee production, processing, and brewing methods enhance efficiency and product quality.
Challenges Impacting Green Coffee Industry Growth
Climate change significantly impacts coffee production, leading to unpredictable yields. Supply chain disruptions and logistical challenges also affect the industry's growth potential. The high volatility of coffee prices, coupled with intense competition among producers and roasters, poses a significant challenge. Regulatory complexities related to fair trade, organic certifications, and sustainability compliance also increase costs and operational challenges for companies.
Key Players Shaping the Green Coffee Industry Market
Significant Green Coffee Industry Industry Milestones
- July 2021: The Rainforest Alliance launched a new sustainability certification program for coffee, aiming to promote sustainable farming practices and ensure fair prices for farmers. This initiative is expected to positively impact the industry's long-term sustainability and consumer perception.
- July 2022: The Ethiopian Coffee and Tea Authority (ECTA) released a new strategy to triple coffee production within 10 years. This ambitious plan, developed in collaboration with EIAR and TechnoServe, could significantly increase Ethiopia's coffee exports and global market share.
- July 2022: The Indian Government proposed a new 'Coffee Promotion and Development Bill, 2022', aiming to modernize the Coffee Board of India and enhance the production and quality of Indian coffee. This move could bolster India's position in the global coffee market.
Future Outlook for Green Coffee Industry Market
The green coffee industry is projected to experience sustained growth over the coming years, driven by rising global coffee demand, increasing consumer preference for specialty and premium coffees, and continued innovations in coffee production and processing. Strategic investments in sustainable farming practices, supply chain optimization, and product diversification will be critical for companies to thrive in this competitive market. The market presents substantial opportunities for businesses that embrace sustainability, technological advancements, and evolving consumer trends.
Green Coffee Industry Segmentation
- 1. Production Analysis
- 2. Consumption Analysis
- 3. Import Market Analysis (Value & Volume)
- 4. Export Market Analysis (Value & Volume)
- 5. Price Trend Analysis
Green Coffee Industry Segmentation By Geography
-
1. North America
- 1.1. United States
- 1.2. Canada
- 1.3. Mexico
-
2. Europe
- 2.1. Germany
- 2.2. United Kingdom
- 2.3. Spain
- 2.4. France
- 2.5. Italy
- 2.6. Belgium
- 2.7. Russia
-
3. Asia Pacific
- 3.1. China
- 3.2. Vietnam
- 3.3. Indonesia
- 3.4. India
- 3.5. Japan
-
4. South America
- 4.1. Brazil
- 4.2. Colombia
-
5. Middle East and Africa
- 5.1. Uganda
- 5.2. Ethiopia
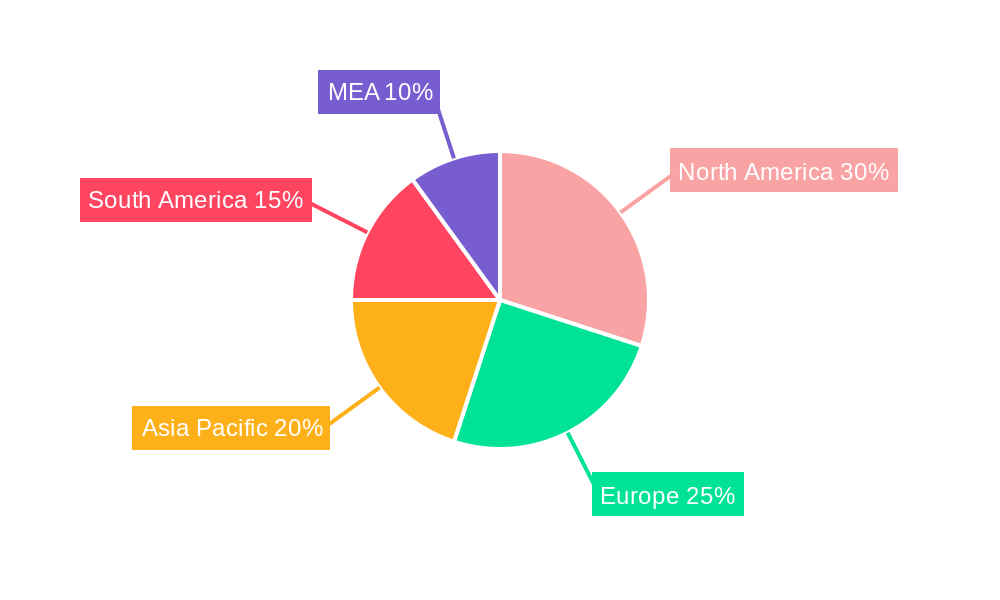
Green Coffee Industry Regional Market Share
Geographic Coverage of Green Coffee Industry
Green Coffee Industry REPORT HIGHLIGHTS
| Aspects | Details |
|---|---|
| Study Period | 2020-2034 |
| Base Year | 2025 |
| Estimated Year | 2026 |
| Forecast Period | 2026-2034 |
| Historical Period | 2020-2025 |
| Growth Rate | CAGR of 6.00% from 2020-2034 |
| Segmentation |
|
Table of Contents
- 1. Introduction
- 1.1. Research Scope
- 1.2. Market Segmentation
- 1.3. Research Methodology
- 1.4. Definitions and Assumptions
- 2. Executive Summary
- 2.1. Introduction
- 3. Market Dynamics
- 3.1. Introduction
- 3.2. Market Drivers
- 3.2.1. Increasing Berry Consumption for Health Benefits; Increasing Adoption of High-Technology Farm Practices; Growing Usage of Berries in the Food and Beverage Industries
- 3.3. Market Restrains
- 3.3.1. High Production Cost Involved in Berry Production; Increasing Disease and Pest Infestations
- 3.4. Market Trends
- 3.4.1. Increasing Demand for Certified Coffee
- 4. Market Factor Analysis
- 4.1. Porters Five Forces
- 4.2. Supply/Value Chain
- 4.3. PESTEL analysis
- 4.4. Market Entropy
- 4.5. Patent/Trademark Analysis
- 5. Global Green Coffee Industry Analysis, Insights and Forecast, 2020-2032
- 5.1. Market Analysis, Insights and Forecast - by Production Analysis
- 5.2. Market Analysis, Insights and Forecast - by Consumption Analysis
- 5.3. Market Analysis, Insights and Forecast - by Import Market Analysis (Value & Volume)
- 5.4. Market Analysis, Insights and Forecast - by Export Market Analysis (Value & Volume)
- 5.5. Market Analysis, Insights and Forecast - by Price Trend Analysis
- 5.6. Market Analysis, Insights and Forecast - by Region
- 5.6.1. North America
- 5.6.2. Europe
- 5.6.3. Asia Pacific
- 5.6.4. South America
- 5.6.5. Middle East and Africa
- 5.1. Market Analysis, Insights and Forecast - by Production Analysis
- 6. North America Green Coffee Industry Analysis, Insights and Forecast, 2020-2032
- 6.1. Market Analysis, Insights and Forecast - by Production Analysis
- 6.2. Market Analysis, Insights and Forecast - by Consumption Analysis
- 6.3. Market Analysis, Insights and Forecast - by Import Market Analysis (Value & Volume)
- 6.4. Market Analysis, Insights and Forecast - by Export Market Analysis (Value & Volume)
- 6.5. Market Analysis, Insights and Forecast - by Price Trend Analysis
- 6.1. Market Analysis, Insights and Forecast - by Production Analysis
- 7. Europe Green Coffee Industry Analysis, Insights and Forecast, 2020-2032
- 7.1. Market Analysis, Insights and Forecast - by Production Analysis
- 7.2. Market Analysis, Insights and Forecast - by Consumption Analysis
- 7.3. Market Analysis, Insights and Forecast - by Import Market Analysis (Value & Volume)
- 7.4. Market Analysis, Insights and Forecast - by Export Market Analysis (Value & Volume)
- 7.5. Market Analysis, Insights and Forecast - by Price Trend Analysis
- 7.1. Market Analysis, Insights and Forecast - by Production Analysis
- 8. Asia Pacific Green Coffee Industry Analysis, Insights and Forecast, 2020-2032
- 8.1. Market Analysis, Insights and Forecast - by Production Analysis
- 8.2. Market Analysis, Insights and Forecast - by Consumption Analysis
- 8.3. Market Analysis, Insights and Forecast - by Import Market Analysis (Value & Volume)
- 8.4. Market Analysis, Insights and Forecast - by Export Market Analysis (Value & Volume)
- 8.5. Market Analysis, Insights and Forecast - by Price Trend Analysis
- 8.1. Market Analysis, Insights and Forecast - by Production Analysis
- 9. South America Green Coffee Industry Analysis, Insights and Forecast, 2020-2032
- 9.1. Market Analysis, Insights and Forecast - by Production Analysis
- 9.2. Market Analysis, Insights and Forecast - by Consumption Analysis
- 9.3. Market Analysis, Insights and Forecast - by Import Market Analysis (Value & Volume)
- 9.4. Market Analysis, Insights and Forecast - by Export Market Analysis (Value & Volume)
- 9.5. Market Analysis, Insights and Forecast - by Price Trend Analysis
- 9.1. Market Analysis, Insights and Forecast - by Production Analysis
- 10. Middle East and Africa Green Coffee Industry Analysis, Insights and Forecast, 2020-2032
- 10.1. Market Analysis, Insights and Forecast - by Production Analysis
- 10.2. Market Analysis, Insights and Forecast - by Consumption Analysis
- 10.3. Market Analysis, Insights and Forecast - by Import Market Analysis (Value & Volume)
- 10.4. Market Analysis, Insights and Forecast - by Export Market Analysis (Value & Volume)
- 10.5. Market Analysis, Insights and Forecast - by Price Trend Analysis
- 10.1. Market Analysis, Insights and Forecast - by Production Analysis
- 11. Competitive Analysis
- 11.1. Global Market Share Analysis 2025
- 11.2. Company Profiles
- 11.2.1 Keurig Dr Pepper
- 11.2.1.1. Overview
- 11.2.1.2. Products
- 11.2.1.3. SWOT Analysis
- 11.2.1.4. Recent Developments
- 11.2.1.5. Financials (Based on Availability)
- 11.2.2 Starbucks
- 11.2.2.1. Overview
- 11.2.2.2. Products
- 11.2.2.3. SWOT Analysis
- 11.2.2.4. Recent Developments
- 11.2.2.5. Financials (Based on Availability)
- 11.2.3 Nestlé
- 11.2.3.1. Overview
- 11.2.3.2. Products
- 11.2.3.3. SWOT Analysis
- 11.2.3.4. Recent Developments
- 11.2.3.5. Financials (Based on Availability)
- 11.2.4 Olam International
- 11.2.4.1. Overview
- 11.2.4.2. Products
- 11.2.4.3. SWOT Analysis
- 11.2.4.4. Recent Developments
- 11.2.4.5. Financials (Based on Availability)
- 11.2.5 Volcafe
- 11.2.5.1. Overview
- 11.2.5.2. Products
- 11.2.5.3. SWOT Analysis
- 11.2.5.4. Recent Developments
- 11.2.5.5. Financials (Based on Availability)
- 11.2.6 Jacobs Douwe Egberts
- 11.2.6.1. Overview
- 11.2.6.2. Products
- 11.2.6.3. SWOT Analysis
- 11.2.6.4. Recent Developments
- 11.2.6.5. Financials (Based on Availability)
- 11.2.7 Lavazza illycaffè
- 11.2.7.1. Overview
- 11.2.7.2. Products
- 11.2.7.3. SWOT Analysis
- 11.2.7.4. Recent Developments
- 11.2.7.5. Financials (Based on Availability)
- 11.2.8 J.M. Smucker
- 11.2.8.1. Overview
- 11.2.8.2. Products
- 11.2.8.3. SWOT Analysis
- 11.2.8.4. Recent Developments
- 11.2.8.5. Financials (Based on Availability)
- 11.2.9 Kraft Heinz
- 11.2.9.1. Overview
- 11.2.9.2. Products
- 11.2.9.3. SWOT Analysis
- 11.2.9.4. Recent Developments
- 11.2.9.5. Financials (Based on Availability)
- 11.2.1 Keurig Dr Pepper
List of Figures
- Figure 1: Global Green Coffee Industry Revenue Breakdown (Million, %) by Region 2025 & 2033
- Figure 2: North America Green Coffee Industry Revenue (Million), by Production Analysis 2025 & 2033
- Figure 3: North America Green Coffee Industry Revenue Share (%), by Production Analysis 2025 & 2033
- Figure 4: North America Green Coffee Industry Revenue (Million), by Consumption Analysis 2025 & 2033
- Figure 5: North America Green Coffee Industry Revenue Share (%), by Consumption Analysis 2025 & 2033
- Figure 6: North America Green Coffee Industry Revenue (Million), by Import Market Analysis (Value & Volume) 2025 & 2033
- Figure 7: North America Green Coffee Industry Revenue Share (%), by Import Market Analysis (Value & Volume) 2025 & 2033
- Figure 8: North America Green Coffee Industry Revenue (Million), by Export Market Analysis (Value & Volume) 2025 & 2033
- Figure 9: North America Green Coffee Industry Revenue Share (%), by Export Market Analysis (Value & Volume) 2025 & 2033
- Figure 10: North America Green Coffee Industry Revenue (Million), by Price Trend Analysis 2025 & 2033
- Figure 11: North America Green Coffee Industry Revenue Share (%), by Price Trend Analysis 2025 & 2033
- Figure 12: North America Green Coffee Industry Revenue (Million), by Country 2025 & 2033
- Figure 13: North America Green Coffee Industry Revenue Share (%), by Country 2025 & 2033
- Figure 14: Europe Green Coffee Industry Revenue (Million), by Production Analysis 2025 & 2033
- Figure 15: Europe Green Coffee Industry Revenue Share (%), by Production Analysis 2025 & 2033
- Figure 16: Europe Green Coffee Industry Revenue (Million), by Consumption Analysis 2025 & 2033
- Figure 17: Europe Green Coffee Industry Revenue Share (%), by Consumption Analysis 2025 & 2033
- Figure 18: Europe Green Coffee Industry Revenue (Million), by Import Market Analysis (Value & Volume) 2025 & 2033
- Figure 19: Europe Green Coffee Industry Revenue Share (%), by Import Market Analysis (Value & Volume) 2025 & 2033
- Figure 20: Europe Green Coffee Industry Revenue (Million), by Export Market Analysis (Value & Volume) 2025 & 2033
- Figure 21: Europe Green Coffee Industry Revenue Share (%), by Export Market Analysis (Value & Volume) 2025 & 2033
- Figure 22: Europe Green Coffee Industry Revenue (Million), by Price Trend Analysis 2025 & 2033
- Figure 23: Europe Green Coffee Industry Revenue Share (%), by Price Trend Analysis 2025 & 2033
- Figure 24: Europe Green Coffee Industry Revenue (Million), by Country 2025 & 2033
- Figure 25: Europe Green Coffee Industry Revenue Share (%), by Country 2025 & 2033
- Figure 26: Asia Pacific Green Coffee Industry Revenue (Million), by Production Analysis 2025 & 2033
- Figure 27: Asia Pacific Green Coffee Industry Revenue Share (%), by Production Analysis 2025 & 2033
- Figure 28: Asia Pacific Green Coffee Industry Revenue (Million), by Consumption Analysis 2025 & 2033
- Figure 29: Asia Pacific Green Coffee Industry Revenue Share (%), by Consumption Analysis 2025 & 2033
- Figure 30: Asia Pacific Green Coffee Industry Revenue (Million), by Import Market Analysis (Value & Volume) 2025 & 2033
- Figure 31: Asia Pacific Green Coffee Industry Revenue Share (%), by Import Market Analysis (Value & Volume) 2025 & 2033
- Figure 32: Asia Pacific Green Coffee Industry Revenue (Million), by Export Market Analysis (Value & Volume) 2025 & 2033
- Figure 33: Asia Pacific Green Coffee Industry Revenue Share (%), by Export Market Analysis (Value & Volume) 2025 & 2033
- Figure 34: Asia Pacific Green Coffee Industry Revenue (Million), by Price Trend Analysis 2025 & 2033
- Figure 35: Asia Pacific Green Coffee Industry Revenue Share (%), by Price Trend Analysis 2025 & 2033
- Figure 36: Asia Pacific Green Coffee Industry Revenue (Million), by Country 2025 & 2033
- Figure 37: Asia Pacific Green Coffee Industry Revenue Share (%), by Country 2025 & 2033
- Figure 38: South America Green Coffee Industry Revenue (Million), by Production Analysis 2025 & 2033
- Figure 39: South America Green Coffee Industry Revenue Share (%), by Production Analysis 2025 & 2033
- Figure 40: South America Green Coffee Industry Revenue (Million), by Consumption Analysis 2025 & 2033
- Figure 41: South America Green Coffee Industry Revenue Share (%), by Consumption Analysis 2025 & 2033
- Figure 42: South America Green Coffee Industry Revenue (Million), by Import Market Analysis (Value & Volume) 2025 & 2033
- Figure 43: South America Green Coffee Industry Revenue Share (%), by Import Market Analysis (Value & Volume) 2025 & 2033
- Figure 44: South America Green Coffee Industry Revenue (Million), by Export Market Analysis (Value & Volume) 2025 & 2033
- Figure 45: South America Green Coffee Industry Revenue Share (%), by Export Market Analysis (Value & Volume) 2025 & 2033
- Figure 46: South America Green Coffee Industry Revenue (Million), by Price Trend Analysis 2025 & 2033
- Figure 47: South America Green Coffee Industry Revenue Share (%), by Price Trend Analysis 2025 & 2033
- Figure 48: South America Green Coffee Industry Revenue (Million), by Country 2025 & 2033
- Figure 49: South America Green Coffee Industry Revenue Share (%), by Country 2025 & 2033
- Figure 50: Middle East and Africa Green Coffee Industry Revenue (Million), by Production Analysis 2025 & 2033
- Figure 51: Middle East and Africa Green Coffee Industry Revenue Share (%), by Production Analysis 2025 & 2033
- Figure 52: Middle East and Africa Green Coffee Industry Revenue (Million), by Consumption Analysis 2025 & 2033
- Figure 53: Middle East and Africa Green Coffee Industry Revenue Share (%), by Consumption Analysis 2025 & 2033
- Figure 54: Middle East and Africa Green Coffee Industry Revenue (Million), by Import Market Analysis (Value & Volume) 2025 & 2033
- Figure 55: Middle East and Africa Green Coffee Industry Revenue Share (%), by Import Market Analysis (Value & Volume) 2025 & 2033
- Figure 56: Middle East and Africa Green Coffee Industry Revenue (Million), by Export Market Analysis (Value & Volume) 2025 & 2033
- Figure 57: Middle East and Africa Green Coffee Industry Revenue Share (%), by Export Market Analysis (Value & Volume) 2025 & 2033
- Figure 58: Middle East and Africa Green Coffee Industry Revenue (Million), by Price Trend Analysis 2025 & 2033
- Figure 59: Middle East and Africa Green Coffee Industry Revenue Share (%), by Price Trend Analysis 2025 & 2033
- Figure 60: Middle East and Africa Green Coffee Industry Revenue (Million), by Country 2025 & 2033
- Figure 61: Middle East and Africa Green Coffee Industry Revenue Share (%), by Country 2025 & 2033
List of Tables
- Table 1: Global Green Coffee Industry Revenue Million Forecast, by Production Analysis 2020 & 2033
- Table 2: Global Green Coffee Industry Revenue Million Forecast, by Consumption Analysis 2020 & 2033
- Table 3: Global Green Coffee Industry Revenue Million Forecast, by Import Market Analysis (Value & Volume) 2020 & 2033
- Table 4: Global Green Coffee Industry Revenue Million Forecast, by Export Market Analysis (Value & Volume) 2020 & 2033
- Table 5: Global Green Coffee Industry Revenue Million Forecast, by Price Trend Analysis 2020 & 2033
- Table 6: Global Green Coffee Industry Revenue Million Forecast, by Region 2020 & 2033
- Table 7: Global Green Coffee Industry Revenue Million Forecast, by Production Analysis 2020 & 2033
- Table 8: Global Green Coffee Industry Revenue Million Forecast, by Consumption Analysis 2020 & 2033
- Table 9: Global Green Coffee Industry Revenue Million Forecast, by Import Market Analysis (Value & Volume) 2020 & 2033
- Table 10: Global Green Coffee Industry Revenue Million Forecast, by Export Market Analysis (Value & Volume) 2020 & 2033
- Table 11: Global Green Coffee Industry Revenue Million Forecast, by Price Trend Analysis 2020 & 2033
- Table 12: Global Green Coffee Industry Revenue Million Forecast, by Country 2020 & 2033
- Table 13: United States Green Coffee Industry Revenue (Million) Forecast, by Application 2020 & 2033
- Table 14: Canada Green Coffee Industry Revenue (Million) Forecast, by Application 2020 & 2033
- Table 15: Mexico Green Coffee Industry Revenue (Million) Forecast, by Application 2020 & 2033
- Table 16: Global Green Coffee Industry Revenue Million Forecast, by Production Analysis 2020 & 2033
- Table 17: Global Green Coffee Industry Revenue Million Forecast, by Consumption Analysis 2020 & 2033
- Table 18: Global Green Coffee Industry Revenue Million Forecast, by Import Market Analysis (Value & Volume) 2020 & 2033
- Table 19: Global Green Coffee Industry Revenue Million Forecast, by Export Market Analysis (Value & Volume) 2020 & 2033
- Table 20: Global Green Coffee Industry Revenue Million Forecast, by Price Trend Analysis 2020 & 2033
- Table 21: Global Green Coffee Industry Revenue Million Forecast, by Country 2020 & 2033
- Table 22: Germany Green Coffee Industry Revenue (Million) Forecast, by Application 2020 & 2033
- Table 23: United Kingdom Green Coffee Industry Revenue (Million) Forecast, by Application 2020 & 2033
- Table 24: Spain Green Coffee Industry Revenue (Million) Forecast, by Application 2020 & 2033
- Table 25: France Green Coffee Industry Revenue (Million) Forecast, by Application 2020 & 2033
- Table 26: Italy Green Coffee Industry Revenue (Million) Forecast, by Application 2020 & 2033
- Table 27: Belgium Green Coffee Industry Revenue (Million) Forecast, by Application 2020 & 2033
- Table 28: Russia Green Coffee Industry Revenue (Million) Forecast, by Application 2020 & 2033
- Table 29: Global Green Coffee Industry Revenue Million Forecast, by Production Analysis 2020 & 2033
- Table 30: Global Green Coffee Industry Revenue Million Forecast, by Consumption Analysis 2020 & 2033
- Table 31: Global Green Coffee Industry Revenue Million Forecast, by Import Market Analysis (Value & Volume) 2020 & 2033
- Table 32: Global Green Coffee Industry Revenue Million Forecast, by Export Market Analysis (Value & Volume) 2020 & 2033
- Table 33: Global Green Coffee Industry Revenue Million Forecast, by Price Trend Analysis 2020 & 2033
- Table 34: Global Green Coffee Industry Revenue Million Forecast, by Country 2020 & 2033
- Table 35: China Green Coffee Industry Revenue (Million) Forecast, by Application 2020 & 2033
- Table 36: Vietnam Green Coffee Industry Revenue (Million) Forecast, by Application 2020 & 2033
- Table 37: Indonesia Green Coffee Industry Revenue (Million) Forecast, by Application 2020 & 2033
- Table 38: India Green Coffee Industry Revenue (Million) Forecast, by Application 2020 & 2033
- Table 39: Japan Green Coffee Industry Revenue (Million) Forecast, by Application 2020 & 2033
- Table 40: Global Green Coffee Industry Revenue Million Forecast, by Production Analysis 2020 & 2033
- Table 41: Global Green Coffee Industry Revenue Million Forecast, by Consumption Analysis 2020 & 2033
- Table 42: Global Green Coffee Industry Revenue Million Forecast, by Import Market Analysis (Value & Volume) 2020 & 2033
- Table 43: Global Green Coffee Industry Revenue Million Forecast, by Export Market Analysis (Value & Volume) 2020 & 2033
- Table 44: Global Green Coffee Industry Revenue Million Forecast, by Price Trend Analysis 2020 & 2033
- Table 45: Global Green Coffee Industry Revenue Million Forecast, by Country 2020 & 2033
- Table 46: Brazil Green Coffee Industry Revenue (Million) Forecast, by Application 2020 & 2033
- Table 47: Colombia Green Coffee Industry Revenue (Million) Forecast, by Application 2020 & 2033
- Table 48: Global Green Coffee Industry Revenue Million Forecast, by Production Analysis 2020 & 2033
- Table 49: Global Green Coffee Industry Revenue Million Forecast, by Consumption Analysis 2020 & 2033
- Table 50: Global Green Coffee Industry Revenue Million Forecast, by Import Market Analysis (Value & Volume) 2020 & 2033
- Table 51: Global Green Coffee Industry Revenue Million Forecast, by Export Market Analysis (Value & Volume) 2020 & 2033
- Table 52: Global Green Coffee Industry Revenue Million Forecast, by Price Trend Analysis 2020 & 2033
- Table 53: Global Green Coffee Industry Revenue Million Forecast, by Country 2020 & 2033
- Table 54: Uganda Green Coffee Industry Revenue (Million) Forecast, by Application 2020 & 2033
- Table 55: Ethiopia Green Coffee Industry Revenue (Million) Forecast, by Application 2020 & 2033
Frequently Asked Questions
1. What is the projected Compound Annual Growth Rate (CAGR) of the Green Coffee Industry?
The projected CAGR is approximately 6.00%.
2. Which companies are prominent players in the Green Coffee Industry?
Key companies in the market include Keurig Dr Pepper , Starbucks , Nestlé , Olam International , Volcafe, Jacobs Douwe Egberts , Lavazza illycaffè , J.M. Smucker , Kraft Heinz .
3. What are the main segments of the Green Coffee Industry?
The market segments include Production Analysis, Consumption Analysis, Import Market Analysis (Value & Volume), Export Market Analysis (Value & Volume), Price Trend Analysis.
4. Can you provide details about the market size?
The market size is estimated to be USD 35.33 Million as of 2022.
5. What are some drivers contributing to market growth?
Increasing Berry Consumption for Health Benefits; Increasing Adoption of High-Technology Farm Practices; Growing Usage of Berries in the Food and Beverage Industries.
6. What are the notable trends driving market growth?
Increasing Demand for Certified Coffee.
7. Are there any restraints impacting market growth?
High Production Cost Involved in Berry Production; Increasing Disease and Pest Infestations.
8. Can you provide examples of recent developments in the market?
July 2022: The Ethiopian Coffee and Tea Authority (ECTA) released a new, comprehensive strategy for the country's coffee sector, which was developed in collaboration with the Ethiopian Institute of Agriculture Research (EIAR) and international nonprofit TechnoServe to increase coffee production by three times within next 10 years.
9. What pricing options are available for accessing the report?
Pricing options include single-user, multi-user, and enterprise licenses priced at USD 4750, USD 5250, and USD 8750 respectively.
10. Is the market size provided in terms of value or volume?
The market size is provided in terms of value, measured in Million.
11. Are there any specific market keywords associated with the report?
Yes, the market keyword associated with the report is "Green Coffee Industry," which aids in identifying and referencing the specific market segment covered.
12. How do I determine which pricing option suits my needs best?
The pricing options vary based on user requirements and access needs. Individual users may opt for single-user licenses, while businesses requiring broader access may choose multi-user or enterprise licenses for cost-effective access to the report.
13. Are there any additional resources or data provided in the Green Coffee Industry report?
While the report offers comprehensive insights, it's advisable to review the specific contents or supplementary materials provided to ascertain if additional resources or data are available.
14. How can I stay updated on further developments or reports in the Green Coffee Industry?
To stay informed about further developments, trends, and reports in the Green Coffee Industry, consider subscribing to industry newsletters, following relevant companies and organizations, or regularly checking reputable industry news sources and publications.
Methodology
Step 1 - Identification of Relevant Samples Size from Population Database


Step 2 - Approaches for Defining Global Market Size (Value, Volume* & Price*)

Note*: In applicable scenarios
Step 3 - Data Sources
Primary Research
- Web Analytics
- Survey Reports
- Research Institute
- Latest Research Reports
- Opinion Leaders
Secondary Research
- Annual Reports
- White Paper
- Latest Press Release
- Industry Association
- Paid Database
- Investor Presentations

Step 4 - Data Triangulation
Involves using different sources of information in order to increase the validity of a study
These sources are likely to be stakeholders in a program - participants, other researchers, program staff, other community members, and so on.
Then we put all data in single framework & apply various statistical tools to find out the dynamic on the market.
During the analysis stage, feedback from the stakeholder groups would be compared to determine areas of agreement as well as areas of divergence