

Key Insights
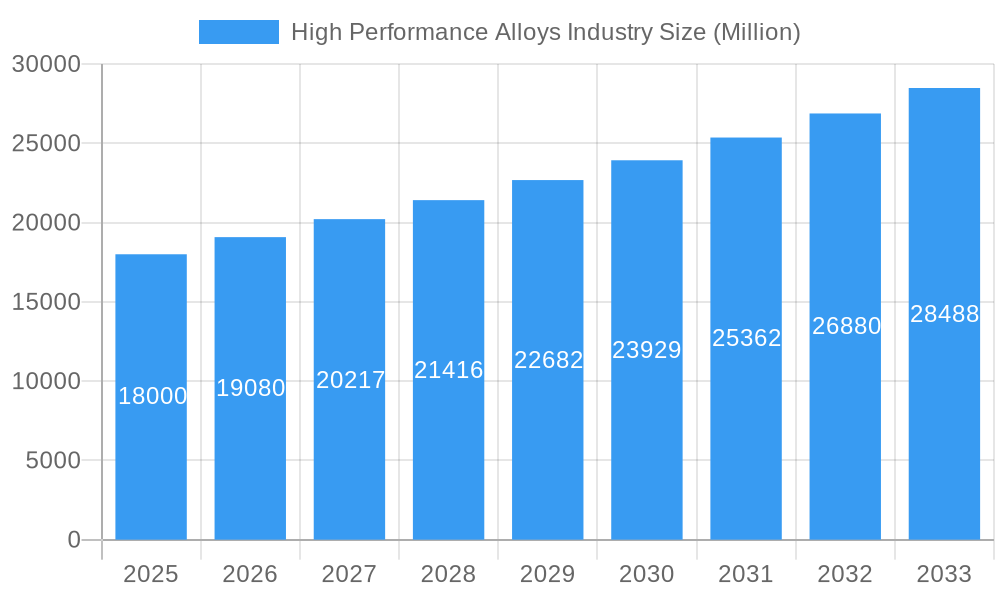
The global High-Performance Alloys market is poised for substantial expansion, fueled by escalating demand across critical industries. Projections indicate a robust growth trajectory, with the market size estimated at $11.64 billion in the base year of 2025. The market is forecast to expand at a Compound Annual Growth Rate (CAGR) of 3.72% from 2025 to 2033. Key growth drivers include the aerospace and defense sectors, which require advanced materials for next-generation applications. The automotive industry's focus on fuel efficiency and performance enhancement, alongside the energy sector's adoption of durable materials for renewable technologies like wind turbines and solar panels, further bolsters demand. Emerging applications in medical implants and advanced manufacturing also contribute to this market's dynamism.
High Performance Alloys Industry Market Size (In Billion)
The market's upward trend is expected to persist, influenced by economic conditions and technological advancements. Intense competition among leading alloy manufacturers stimulates innovation, focusing on alloys with superior strength-to-weight ratios, corrosion resistance, and high-temperature performance. North America and Europe are anticipated to maintain significant market shares due to strong industrial bases and R&D activities. However, the Asia-Pacific region presents the highest long-term growth potential, driven by rapid industrialization and infrastructure investments.
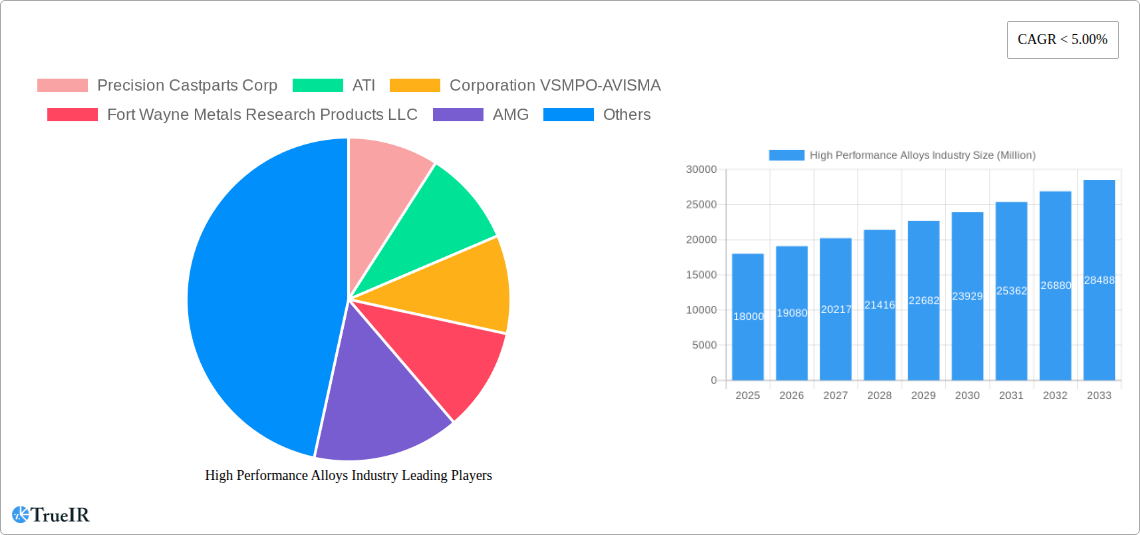
High Performance Alloys Industry Company Market Share
This report offers a comprehensive analysis of the High-Performance Alloys industry, detailing market dynamics, competitive landscapes, and future growth projections from 2019 to 2033. It provides essential insights for industry professionals, investors, and stakeholders seeking a strategic understanding of this vital sector. The report covers a market valued at $11.64 billion in 2025, projecting significant growth by 2033.
High Performance Alloys Industry Market Structure & Competitive Landscape
The High Performance Alloys industry is characterized by a moderately concentrated market structure. While a few major players like Precision Castparts Corp, ATI, and VSMPO-AVISMA hold significant market share, numerous smaller companies also contribute to the overall market volume. The Herfindahl-Hirschman Index (HHI) for the industry is estimated at xx, suggesting a moderately concentrated landscape.
Innovation is a key driver, with companies continuously developing advanced alloys to meet evolving demands for higher strength, durability, and resistance to extreme conditions. Stringent regulatory frameworks regarding material safety and environmental impact exert significant influence, prompting companies to invest in sustainable production processes. The industry experiences substitution pressures from alternative materials like composites and ceramics in niche applications.
End-user segmentation plays a crucial role, with Aerospace, Power, and Oil & Gas representing the largest market segments. Mergers and Acquisitions (M&A) activity is relatively frequent, driven by the pursuit of economies of scale, technological advancements, and expanded market access. The total value of M&A transactions in the High Performance Alloys industry from 2019 to 2024 is estimated at $XX Million.
- Market Concentration: Moderately concentrated, with a few dominant players and many smaller participants.
- Innovation Drivers: Development of advanced alloys with enhanced properties, additive manufacturing technologies.
- Regulatory Impacts: Stringent safety and environmental regulations influence production processes and material specifications.
- Product Substitutes: Composites, ceramics, and other advanced materials pose competitive challenges in specific applications.
- End-User Segmentation: Aerospace, Power, Oil & Gas, Automotive, and Electrical & Electronics are key end-user segments.
- M&A Trends: Frequent M&A activity driven by expansion, technology acquisition, and economies of scale.
High Performance Alloys Industry Market Trends & Opportunities
The High Performance Alloys market is experiencing robust growth, driven by increasing demand from key end-user industries. The market size is projected to grow at a Compound Annual Growth Rate (CAGR) of xx% from 2025 to 2033. Technological advancements, particularly in additive manufacturing and materials science, are significantly impacting the industry, enabling the production of complex components with enhanced performance characteristics. The rising adoption of lightweight alloys in aerospace and automotive applications further fuels market expansion. Consumer preferences are increasingly focusing on sustainability and environmental responsibility, prompting manufacturers to develop eco-friendly production processes and alloys. Competitive dynamics remain intense, with companies focusing on innovation, cost optimization, and supply chain diversification. Market penetration rates vary significantly across different end-user industries and geographic regions. The aerospace sector demonstrates high market penetration for titanium alloys, while the automotive industry sees increasing adoption of high-strength steel alloys.
Dominant Markets & Segments in High Performance Alloys Industry
The Aerospace sector is currently the dominant end-user industry for High Performance Alloys, driven by the need for lightweight yet high-strength materials in aircraft and spacecraft construction. Titanium alloys are particularly significant in this segment. Within base metal types, Nickel alloys hold a substantial market share due to their superior corrosion and heat resistance, finding extensive use in power generation and chemical processing. The Asia-Pacific region exhibits strong growth potential, fueled by expanding infrastructure development and industrialization.
- Leading Region: Asia-Pacific (driven by infrastructure development and industrial growth)
- Leading Base Metal Type: Nickel (due to corrosion and heat resistance)
- Leading Product Type: Heat Resistant Alloys (owing to applications in aerospace, power, and oil & gas)
- Leading End-user Industry: Aerospace (demand for lightweight and high-strength materials)
Key Growth Drivers:
- Aerospace: Demand for lightweight and high-strength materials in aircraft and spacecraft manufacturing.
- Power Generation: Need for corrosion-resistant alloys in power plants and energy infrastructure.
- Oil & Gas: Requirement for heat-resistant and corrosion-resistant alloys in high-temperature and harsh environments.
- Automotive: Increasing adoption of lightweight alloys to enhance fuel efficiency.
- Infrastructure Development: Growing investment in infrastructure projects globally stimulates demand for durable alloys.
High Performance Alloys Industry Product Analysis
Recent product innovations center around advanced alloys with enhanced properties such as high-temperature strength, corrosion resistance, and wear resistance. Additive manufacturing processes are playing a crucial role in producing complex shapes and geometries, leading to improved component performance. The focus is on developing alloys with a superior combination of properties, optimizing cost-effectiveness, and addressing sustainability concerns. These advancements are enabling the creation of lighter, stronger, and more durable components across various applications, contributing to improved efficiency and safety in various sectors.
Key Drivers, Barriers & Challenges in High Performance Alloys Industry
Key Drivers:
The High Performance Alloys industry is driven by technological advancements, particularly in additive manufacturing and materials science. Strong demand from end-user industries such as aerospace and power generation fuels growth. Government initiatives promoting sustainable technologies and energy efficiency contribute to industry expansion.
Challenges and Restraints:
Supply chain disruptions and fluctuating raw material prices pose significant challenges. Stringent environmental regulations and the need to adopt sustainable manufacturing processes increase production costs. Intense competition and the emergence of alternative materials introduce pressures on pricing and market share. These factors can influence the industry's profitability and long-term growth trajectory. Estimated impact of these challenges on 2025 market size is a reduction of xx Million.
Growth Drivers in the High Performance Alloys Industry Market
Technological advancements, particularly in additive manufacturing and materials science, are key drivers. Strong demand from aerospace, power, and oil & gas sectors fuels market growth. Government initiatives promoting sustainable and energy-efficient technologies also contribute to expansion.
Challenges Impacting High Performance Alloys Industry Growth
Supply chain disruptions, fluctuating raw material prices, and stringent environmental regulations significantly impact growth. Intense competition and the emergence of alternative materials such as composites and ceramics also present challenges.
Key Players Shaping the High Performance Alloys Industry Market
- Precision Castparts Corp
- ATI
- Corporation VSMPO-AVISMA
- Fort Wayne Metals Research Products LLC
- AMG
- High Performance Alloys Inc
- Stanford Advanced Materials
- Nippon Yakin Kogyo Co Ltd
- CRS Holdings Inc
Significant High Performance Alloys Industry Industry Milestones
- January 2022: Alloy Wire International (AWI) launched Inconel 617, a high-performance alloy for medical, aerospace, nuclear, and petrochemical applications.
- January 2022: Desktop Metal introduced DM HH Stainless Steel (DM HH-SS), a high-strength and hardness alloy for additive manufacturing, targeting oil & gas, automotive, and medical sectors.
- December 2022: SLM Solutions partnered with Elementum 3D to produce high-performance parts using high-quality alloys for aerospace and space applications.
Future Outlook for High Performance Alloys Industry Market
The High Performance Alloys industry is poised for continued growth driven by increasing demand across various sectors. Strategic opportunities exist in developing innovative alloys with enhanced properties, leveraging additive manufacturing, and focusing on sustainability. The market's future potential is considerable, offering significant growth opportunities for companies that effectively address the challenges and capitalize on emerging trends.
High Performance Alloys Industry Segmentation
-
1. Base Metal Type
- 1.1. Aluminum
- 1.2. Nickel
- 1.3. Steel
- 1.4. Magnesium
- 1.5. Titanium
- 1.6. Other Base Metal Types
-
2. Product Type
- 2.1. Heat Resistant Alloys
- 2.2. Corrosion Resistant Alloys
- 2.3. Wear Resistant Alloys
- 2.4. Other Product Types
-
3. End-user Industry
- 3.1. Aerospace
- 3.2. Power
- 3.3. Oil and Gas (including Chemical)
- 3.4. Electrical and Electronics
- 3.5. Automotive
- 3.6. Other End-user Industries
High Performance Alloys Industry Segmentation By Geography
-
1. Asia Pacific
- 1.1. China
- 1.2. India
- 1.3. Japan
- 1.4. South Korea
- 1.5. Rest of Asia Pacific
-
2. North America
- 2.1. United States
- 2.2. Canada
- 2.3. Mexico
-
3. Europe
- 3.1. United Kingdom
- 3.2. France
- 3.3. Germany
- 3.4. Italy
- 3.5. Rest of Europe
-
4. Rest of the World
- 4.1. South America
- 4.2. Middle East and Africa

High Performance Alloys Industry Regional Market Share
Geographic Coverage of High Performance Alloys Industry
High Performance Alloys Industry REPORT HIGHLIGHTS
| Aspects | Details |
|---|---|
| Study Period | 2020-2034 |
| Base Year | 2025 |
| Estimated Year | 2026 |
| Forecast Period | 2026-2034 |
| Historical Period | 2020-2025 |
| Growth Rate | CAGR of 3.72% from 2020-2034 |
| Segmentation |
|
Table of Contents
- 1. Introduction
- 1.1. Research Scope
- 1.2. Market Segmentation
- 1.3. Research Objective
- 1.4. Definitions and Assumptions
- 2. Executive Summary
- 2.1. Market Snapshot
- 3. Market Dynamics
- 3.1. Market Drivers
- 3.2. Market Restrains
- 3.3. Market Trends
- 3.4. Market Opportunities
- 4. Market Factor Analysis
- 4.1. Porters Five Forces
- 4.1.1. Bargaining Power of Suppliers
- 4.1.2. Bargaining Power of Buyers
- 4.1.3. Threat of New Entrants
- 4.1.4. Threat of Substitutes
- 4.1.5. Competitive Rivalry
- 4.2. PESTEL analysis
- 4.3. BCG Analysis
- 4.3.1. Stars (High Growth, High Market Share)
- 4.3.2. Cash Cows (Low Growth, High Market Share)
- 4.3.3. Question Mark (High Growth, Low Market Share)
- 4.3.4. Dogs (Low Growth, Low Market Share)
- 4.4. Ansoff Matrix Analysis
- 4.5. Supply Chain Analysis
- 4.6. Regulatory Landscape
- 4.7. Current Market Potential and Opportunity Assessment (TAM–SAM–SOM Framework)
- 4.8. TIR Analyst Note
- 4.1. Porters Five Forces
- 5. Market Analysis, Insights and Forecast 2021-2033
- 5.1. Market Analysis, Insights and Forecast - by Base Metal Type
- 5.1.1. Aluminum
- 5.1.2. Nickel
- 5.1.3. Steel
- 5.1.4. Magnesium
- 5.1.5. Titanium
- 5.1.6. Other Base Metal Types
- 5.2. Market Analysis, Insights and Forecast - by Product Type
- 5.2.1. Heat Resistant Alloys
- 5.2.2. Corrosion Resistant Alloys
- 5.2.3. Wear Resistant Alloys
- 5.2.4. Other Product Types
- 5.3. Market Analysis, Insights and Forecast - by End-user Industry
- 5.3.1. Aerospace
- 5.3.2. Power
- 5.3.3. Oil and Gas (including Chemical)
- 5.3.4. Electrical and Electronics
- 5.3.5. Automotive
- 5.3.6. Other End-user Industries
- 5.4. Market Analysis, Insights and Forecast - by Region
- 5.4.1. Asia Pacific
- 5.4.2. North America
- 5.4.3. Europe
- 5.4.4. Rest of the World
- 5.1. Market Analysis, Insights and Forecast - by Base Metal Type
- 6. Global High Performance Alloys Industry Analysis, Insights and Forecast, 2021-2033
- 6.1. Market Analysis, Insights and Forecast - by Base Metal Type
- 6.1.1. Aluminum
- 6.1.2. Nickel
- 6.1.3. Steel
- 6.1.4. Magnesium
- 6.1.5. Titanium
- 6.1.6. Other Base Metal Types
- 6.2. Market Analysis, Insights and Forecast - by Product Type
- 6.2.1. Heat Resistant Alloys
- 6.2.2. Corrosion Resistant Alloys
- 6.2.3. Wear Resistant Alloys
- 6.2.4. Other Product Types
- 6.3. Market Analysis, Insights and Forecast - by End-user Industry
- 6.3.1. Aerospace
- 6.3.2. Power
- 6.3.3. Oil and Gas (including Chemical)
- 6.3.4. Electrical and Electronics
- 6.3.5. Automotive
- 6.3.6. Other End-user Industries
- 6.1. Market Analysis, Insights and Forecast - by Base Metal Type
- 7. Asia Pacific High Performance Alloys Industry Analysis, Insights and Forecast, 2020-2032
- 7.1. Market Analysis, Insights and Forecast - by Base Metal Type
- 7.1.1. Aluminum
- 7.1.2. Nickel
- 7.1.3. Steel
- 7.1.4. Magnesium
- 7.1.5. Titanium
- 7.1.6. Other Base Metal Types
- 7.2. Market Analysis, Insights and Forecast - by Product Type
- 7.2.1. Heat Resistant Alloys
- 7.2.2. Corrosion Resistant Alloys
- 7.2.3. Wear Resistant Alloys
- 7.2.4. Other Product Types
- 7.3. Market Analysis, Insights and Forecast - by End-user Industry
- 7.3.1. Aerospace
- 7.3.2. Power
- 7.3.3. Oil and Gas (including Chemical)
- 7.3.4. Electrical and Electronics
- 7.3.5. Automotive
- 7.3.6. Other End-user Industries
- 7.1. Market Analysis, Insights and Forecast - by Base Metal Type
- 8. North America High Performance Alloys Industry Analysis, Insights and Forecast, 2020-2032
- 8.1. Market Analysis, Insights and Forecast - by Base Metal Type
- 8.1.1. Aluminum
- 8.1.2. Nickel
- 8.1.3. Steel
- 8.1.4. Magnesium
- 8.1.5. Titanium
- 8.1.6. Other Base Metal Types
- 8.2. Market Analysis, Insights and Forecast - by Product Type
- 8.2.1. Heat Resistant Alloys
- 8.2.2. Corrosion Resistant Alloys
- 8.2.3. Wear Resistant Alloys
- 8.2.4. Other Product Types
- 8.3. Market Analysis, Insights and Forecast - by End-user Industry
- 8.3.1. Aerospace
- 8.3.2. Power
- 8.3.3. Oil and Gas (including Chemical)
- 8.3.4. Electrical and Electronics
- 8.3.5. Automotive
- 8.3.6. Other End-user Industries
- 8.1. Market Analysis, Insights and Forecast - by Base Metal Type
- 9. Europe High Performance Alloys Industry Analysis, Insights and Forecast, 2020-2032
- 9.1. Market Analysis, Insights and Forecast - by Base Metal Type
- 9.1.1. Aluminum
- 9.1.2. Nickel
- 9.1.3. Steel
- 9.1.4. Magnesium
- 9.1.5. Titanium
- 9.1.6. Other Base Metal Types
- 9.2. Market Analysis, Insights and Forecast - by Product Type
- 9.2.1. Heat Resistant Alloys
- 9.2.2. Corrosion Resistant Alloys
- 9.2.3. Wear Resistant Alloys
- 9.2.4. Other Product Types
- 9.3. Market Analysis, Insights and Forecast - by End-user Industry
- 9.3.1. Aerospace
- 9.3.2. Power
- 9.3.3. Oil and Gas (including Chemical)
- 9.3.4. Electrical and Electronics
- 9.3.5. Automotive
- 9.3.6. Other End-user Industries
- 9.1. Market Analysis, Insights and Forecast - by Base Metal Type
- 10. Rest of the World High Performance Alloys Industry Analysis, Insights and Forecast, 2020-2032
- 10.1. Market Analysis, Insights and Forecast - by Base Metal Type
- 10.1.1. Aluminum
- 10.1.2. Nickel
- 10.1.3. Steel
- 10.1.4. Magnesium
- 10.1.5. Titanium
- 10.1.6. Other Base Metal Types
- 10.2. Market Analysis, Insights and Forecast - by Product Type
- 10.2.1. Heat Resistant Alloys
- 10.2.2. Corrosion Resistant Alloys
- 10.2.3. Wear Resistant Alloys
- 10.2.4. Other Product Types
- 10.3. Market Analysis, Insights and Forecast - by End-user Industry
- 10.3.1. Aerospace
- 10.3.2. Power
- 10.3.3. Oil and Gas (including Chemical)
- 10.3.4. Electrical and Electronics
- 10.3.5. Automotive
- 10.3.6. Other End-user Industries
- 10.1. Market Analysis, Insights and Forecast - by Base Metal Type
- 11. Competitive Analysis
- 11.1. Company Profiles
- 11.1.1 Precision Castparts Corp
- 11.1.1.1. Company Overview
- 11.1.1.2. Products
- 11.1.1.3. Company Financials
- 11.1.1.4. SWOT Analysis
- 11.1.2 ATI
- 11.1.2.1. Company Overview
- 11.1.2.2. Products
- 11.1.2.3. Company Financials
- 11.1.2.4. SWOT Analysis
- 11.1.3 Corporation VSMPO-AVISMA
- 11.1.3.1. Company Overview
- 11.1.3.2. Products
- 11.1.3.3. Company Financials
- 11.1.3.4. SWOT Analysis
- 11.1.4 Fort Wayne Metals Research Products LLC
- 11.1.4.1. Company Overview
- 11.1.4.2. Products
- 11.1.4.3. Company Financials
- 11.1.4.4. SWOT Analysis
- 11.1.5 AMG
- 11.1.5.1. Company Overview
- 11.1.5.2. Products
- 11.1.5.3. Company Financials
- 11.1.5.4. SWOT Analysis
- 11.1.6 High Performance Alloys Inc
- 11.1.6.1. Company Overview
- 11.1.6.2. Products
- 11.1.6.3. Company Financials
- 11.1.6.4. SWOT Analysis
- 11.1.7 Stanford Advanced Materials*List Not Exhaustive
- 11.1.7.1. Company Overview
- 11.1.7.2. Products
- 11.1.7.3. Company Financials
- 11.1.7.4. SWOT Analysis
- 11.1.8 Nippon Yakin Kogyo Co Ltd
- 11.1.8.1. Company Overview
- 11.1.8.2. Products
- 11.1.8.3. Company Financials
- 11.1.8.4. SWOT Analysis
- 11.1.9 CRS Holdings Inc
- 11.1.9.1. Company Overview
- 11.1.9.2. Products
- 11.1.9.3. Company Financials
- 11.1.9.4. SWOT Analysis
- 11.1.1 Precision Castparts Corp
- 11.2. Market Entropy
- 11.2.1 Company's Key Areas Served
- 11.2.2 Recent Developments
- 11.3. Company Market Share Analysis 2025
- 11.3.1 Top 5 Companies Market Share Analysis
- 11.3.2 Top 3 Companies Market Share Analysis
- 11.4. List of Potential Customers
- 12. Research Methodology
List of Figures
- Figure 1: Global High Performance Alloys Industry Revenue Breakdown (billion, %) by Region 2025 & 2033
- Figure 2: Asia Pacific High Performance Alloys Industry Revenue (billion), by Base Metal Type 2025 & 2033
- Figure 3: Asia Pacific High Performance Alloys Industry Revenue Share (%), by Base Metal Type 2025 & 2033
- Figure 4: Asia Pacific High Performance Alloys Industry Revenue (billion), by Product Type 2025 & 2033
- Figure 5: Asia Pacific High Performance Alloys Industry Revenue Share (%), by Product Type 2025 & 2033
- Figure 6: Asia Pacific High Performance Alloys Industry Revenue (billion), by End-user Industry 2025 & 2033
- Figure 7: Asia Pacific High Performance Alloys Industry Revenue Share (%), by End-user Industry 2025 & 2033
- Figure 8: Asia Pacific High Performance Alloys Industry Revenue (billion), by Country 2025 & 2033
- Figure 9: Asia Pacific High Performance Alloys Industry Revenue Share (%), by Country 2025 & 2033
- Figure 10: North America High Performance Alloys Industry Revenue (billion), by Base Metal Type 2025 & 2033
- Figure 11: North America High Performance Alloys Industry Revenue Share (%), by Base Metal Type 2025 & 2033
- Figure 12: North America High Performance Alloys Industry Revenue (billion), by Product Type 2025 & 2033
- Figure 13: North America High Performance Alloys Industry Revenue Share (%), by Product Type 2025 & 2033
- Figure 14: North America High Performance Alloys Industry Revenue (billion), by End-user Industry 2025 & 2033
- Figure 15: North America High Performance Alloys Industry Revenue Share (%), by End-user Industry 2025 & 2033
- Figure 16: North America High Performance Alloys Industry Revenue (billion), by Country 2025 & 2033
- Figure 17: North America High Performance Alloys Industry Revenue Share (%), by Country 2025 & 2033
- Figure 18: Europe High Performance Alloys Industry Revenue (billion), by Base Metal Type 2025 & 2033
- Figure 19: Europe High Performance Alloys Industry Revenue Share (%), by Base Metal Type 2025 & 2033
- Figure 20: Europe High Performance Alloys Industry Revenue (billion), by Product Type 2025 & 2033
- Figure 21: Europe High Performance Alloys Industry Revenue Share (%), by Product Type 2025 & 2033
- Figure 22: Europe High Performance Alloys Industry Revenue (billion), by End-user Industry 2025 & 2033
- Figure 23: Europe High Performance Alloys Industry Revenue Share (%), by End-user Industry 2025 & 2033
- Figure 24: Europe High Performance Alloys Industry Revenue (billion), by Country 2025 & 2033
- Figure 25: Europe High Performance Alloys Industry Revenue Share (%), by Country 2025 & 2033
- Figure 26: Rest of the World High Performance Alloys Industry Revenue (billion), by Base Metal Type 2025 & 2033
- Figure 27: Rest of the World High Performance Alloys Industry Revenue Share (%), by Base Metal Type 2025 & 2033
- Figure 28: Rest of the World High Performance Alloys Industry Revenue (billion), by Product Type 2025 & 2033
- Figure 29: Rest of the World High Performance Alloys Industry Revenue Share (%), by Product Type 2025 & 2033
- Figure 30: Rest of the World High Performance Alloys Industry Revenue (billion), by End-user Industry 2025 & 2033
- Figure 31: Rest of the World High Performance Alloys Industry Revenue Share (%), by End-user Industry 2025 & 2033
- Figure 32: Rest of the World High Performance Alloys Industry Revenue (billion), by Country 2025 & 2033
- Figure 33: Rest of the World High Performance Alloys Industry Revenue Share (%), by Country 2025 & 2033
List of Tables
- Table 1: Global High Performance Alloys Industry Revenue billion Forecast, by Base Metal Type 2020 & 2033
- Table 2: Global High Performance Alloys Industry Revenue billion Forecast, by Product Type 2020 & 2033
- Table 3: Global High Performance Alloys Industry Revenue billion Forecast, by End-user Industry 2020 & 2033
- Table 4: Global High Performance Alloys Industry Revenue billion Forecast, by Region 2020 & 2033
- Table 5: Global High Performance Alloys Industry Revenue billion Forecast, by Base Metal Type 2020 & 2033
- Table 6: Global High Performance Alloys Industry Revenue billion Forecast, by Product Type 2020 & 2033
- Table 7: Global High Performance Alloys Industry Revenue billion Forecast, by End-user Industry 2020 & 2033
- Table 8: Global High Performance Alloys Industry Revenue billion Forecast, by Country 2020 & 2033
- Table 9: China High Performance Alloys Industry Revenue (billion) Forecast, by Application 2020 & 2033
- Table 10: India High Performance Alloys Industry Revenue (billion) Forecast, by Application 2020 & 2033
- Table 11: Japan High Performance Alloys Industry Revenue (billion) Forecast, by Application 2020 & 2033
- Table 12: South Korea High Performance Alloys Industry Revenue (billion) Forecast, by Application 2020 & 2033
- Table 13: Rest of Asia Pacific High Performance Alloys Industry Revenue (billion) Forecast, by Application 2020 & 2033
- Table 14: Global High Performance Alloys Industry Revenue billion Forecast, by Base Metal Type 2020 & 2033
- Table 15: Global High Performance Alloys Industry Revenue billion Forecast, by Product Type 2020 & 2033
- Table 16: Global High Performance Alloys Industry Revenue billion Forecast, by End-user Industry 2020 & 2033
- Table 17: Global High Performance Alloys Industry Revenue billion Forecast, by Country 2020 & 2033
- Table 18: United States High Performance Alloys Industry Revenue (billion) Forecast, by Application 2020 & 2033
- Table 19: Canada High Performance Alloys Industry Revenue (billion) Forecast, by Application 2020 & 2033
- Table 20: Mexico High Performance Alloys Industry Revenue (billion) Forecast, by Application 2020 & 2033
- Table 21: Global High Performance Alloys Industry Revenue billion Forecast, by Base Metal Type 2020 & 2033
- Table 22: Global High Performance Alloys Industry Revenue billion Forecast, by Product Type 2020 & 2033
- Table 23: Global High Performance Alloys Industry Revenue billion Forecast, by End-user Industry 2020 & 2033
- Table 24: Global High Performance Alloys Industry Revenue billion Forecast, by Country 2020 & 2033
- Table 25: United Kingdom High Performance Alloys Industry Revenue (billion) Forecast, by Application 2020 & 2033
- Table 26: France High Performance Alloys Industry Revenue (billion) Forecast, by Application 2020 & 2033
- Table 27: Germany High Performance Alloys Industry Revenue (billion) Forecast, by Application 2020 & 2033
- Table 28: Italy High Performance Alloys Industry Revenue (billion) Forecast, by Application 2020 & 2033
- Table 29: Rest of Europe High Performance Alloys Industry Revenue (billion) Forecast, by Application 2020 & 2033
- Table 30: Global High Performance Alloys Industry Revenue billion Forecast, by Base Metal Type 2020 & 2033
- Table 31: Global High Performance Alloys Industry Revenue billion Forecast, by Product Type 2020 & 2033
- Table 32: Global High Performance Alloys Industry Revenue billion Forecast, by End-user Industry 2020 & 2033
- Table 33: Global High Performance Alloys Industry Revenue billion Forecast, by Country 2020 & 2033
- Table 34: South America High Performance Alloys Industry Revenue (billion) Forecast, by Application 2020 & 2033
- Table 35: Middle East and Africa High Performance Alloys Industry Revenue (billion) Forecast, by Application 2020 & 2033
Frequently Asked Questions
1. What is the projected Compound Annual Growth Rate (CAGR) of the High Performance Alloys Industry?
The projected CAGR is approximately 3.72%.
2. Which companies are prominent players in the High Performance Alloys Industry?
Key companies in the market include Precision Castparts Corp, ATI, Corporation VSMPO-AVISMA, Fort Wayne Metals Research Products LLC, AMG, High Performance Alloys Inc, Stanford Advanced Materials*List Not Exhaustive, Nippon Yakin Kogyo Co Ltd, CRS Holdings Inc.
3. What are the main segments of the High Performance Alloys Industry?
The market segments include Base Metal Type, Product Type, End-user Industry.
4. Can you provide details about the market size?
The market size is estimated to be USD 11.64 billion as of 2022.
5. What are some drivers contributing to market growth?
Increasing Demand of the Alloys in the Aerospace Industry; Other Drivers.
6. What are the notable trends driving market growth?
Aerospace Industry to Dominate the Market.
7. Are there any restraints impacting market growth?
Fluctuating Pricing of Raw Materials; Other Restraints.
8. Can you provide examples of recent developments in the market?
December 2022: SLM Solutions announced its partnership with Elementum 3D to produce high-performance parts with high-quality alloys for aerospace and space customers. The collaboration between the two companies broadens the use of additive manufacturing, increases exposure for Elementum 3D materials, and enables SLM Solutions to rapidly expand the material portfolio for the NXG XII 600; therefore, the high-performance alloys from Elementum 3D will be available on SLM technology as early as 2023.
9. What pricing options are available for accessing the report?
Pricing options include single-user, multi-user, and enterprise licenses priced at USD 4750, USD 5250, and USD 8750 respectively.
10. Is the market size provided in terms of value or volume?
The market size is provided in terms of value, measured in billion.
11. Are there any specific market keywords associated with the report?
Yes, the market keyword associated with the report is "High Performance Alloys Industry," which aids in identifying and referencing the specific market segment covered.
12. How do I determine which pricing option suits my needs best?
The pricing options vary based on user requirements and access needs. Individual users may opt for single-user licenses, while businesses requiring broader access may choose multi-user or enterprise licenses for cost-effective access to the report.
13. Are there any additional resources or data provided in the High Performance Alloys Industry report?
While the report offers comprehensive insights, it's advisable to review the specific contents or supplementary materials provided to ascertain if additional resources or data are available.
14. How can I stay updated on further developments or reports in the High Performance Alloys Industry?
To stay informed about further developments, trends, and reports in the High Performance Alloys Industry, consider subscribing to industry newsletters, following relevant companies and organizations, or regularly checking reputable industry news sources and publications.
Methodology
Step 1 - Identification of Relevant Samples Size from Population Database


Step 2 - Approaches for Defining Global Market Size (Value, Volume* & Price*)

Note*: In applicable scenarios
Step 3 - Data Sources
Primary Research
- Web Analytics
- Survey Reports
- Research Institute
- Latest Research Reports
- Opinion Leaders
Secondary Research
- Annual Reports
- White Paper
- Latest Press Release
- Industry Association
- Paid Database
- Investor Presentations

Step 4 - Data Triangulation
Involves using different sources of information in order to increase the validity of a study
These sources are likely to be stakeholders in a program - participants, other researchers, program staff, other community members, and so on.
Then we put all data in single framework & apply various statistical tools to find out the dynamic on the market.
During the analysis stage, feedback from the stakeholder groups would be compared to determine areas of agreement as well as areas of divergence