

Key Insights
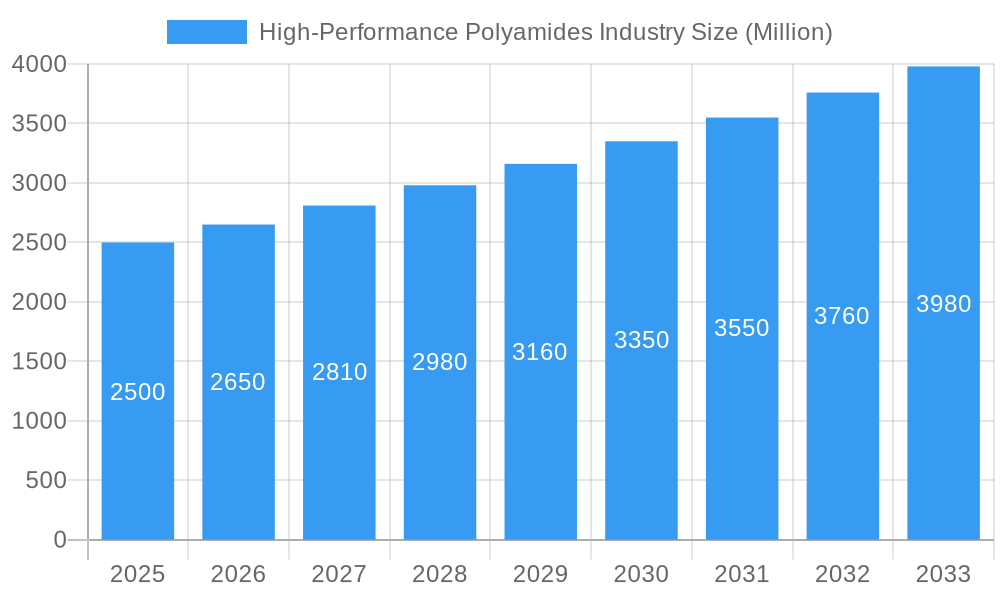
The High-Performance Polyamides (HPP) market is poised for significant expansion, driven by escalating demand across critical end-user industries. Projected to reach $2.23 billion by 2025, the market is expected to grow at a Compound Annual Growth Rate (CAGR) of approximately 5.5% from 2025 to 2033. Key growth catalysts include the automotive sector, particularly in electric vehicle (EV) development and lightweighting initiatives, where HPPs' superior strength-to-weight ratio and durability are paramount. The aerospace and defense industries further contribute to market growth through their reliance on HPPs for high-performance applications. Additionally, the increasing adoption of HPPs in medical implants and devices, alongside burgeoning demand in electrical and electronics for components requiring exceptional thermal and chemical resistance, fuels market expansion. Polyamide 11 and Polyamide 46 variants are experiencing particularly strong uptake due to their unique properties. Market challenges include raw material price volatility and potential material substitution, though the long-term outlook remains robust, supported by continuous technological advancements and sustained demand from key sectors.
High-Performance Polyamides Industry Market Size (In Billion)
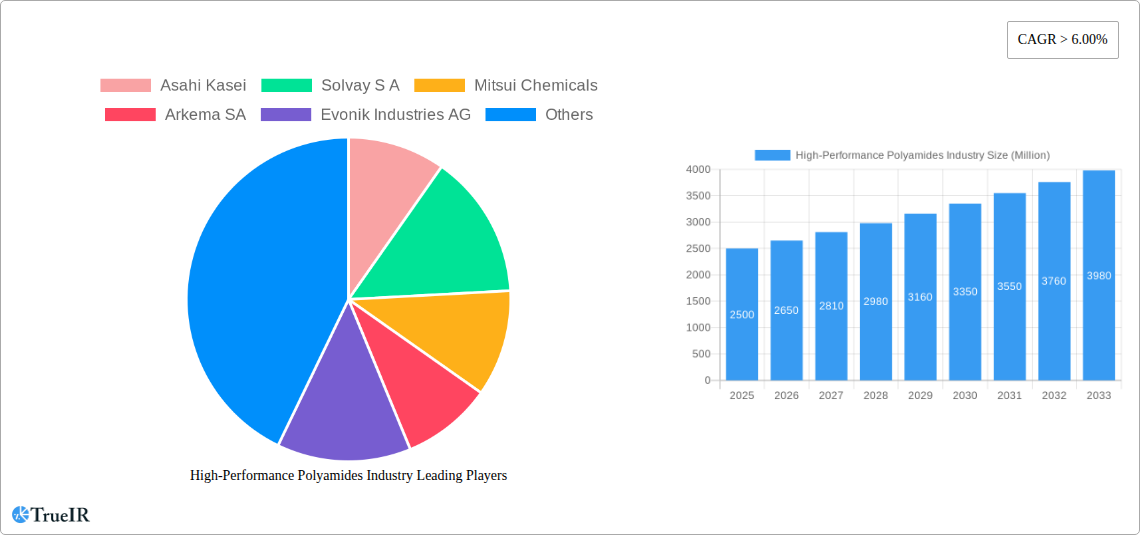
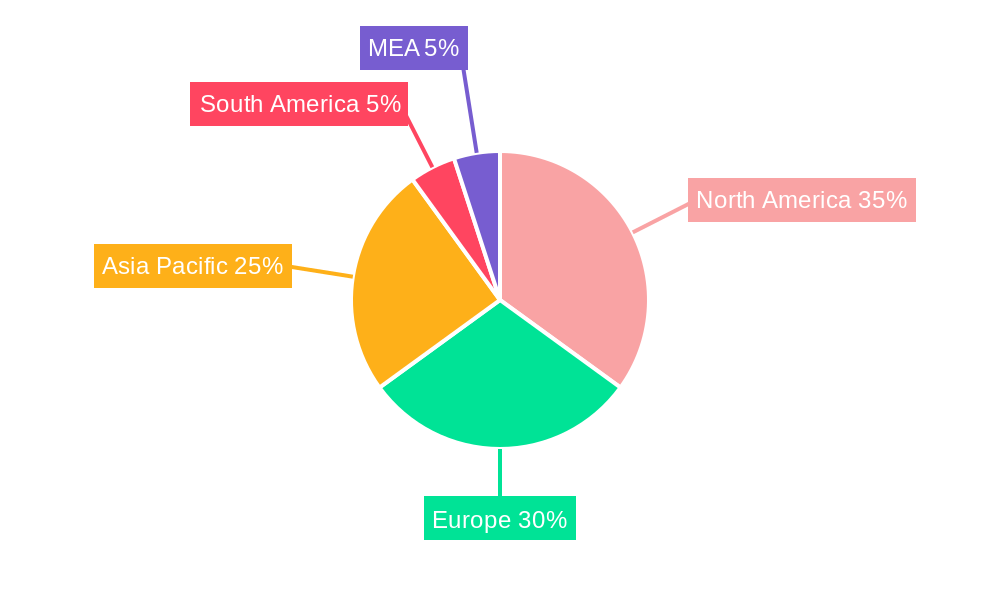
Geographically, the HPP market demonstrates a diverse distribution across North America, Europe, and Asia Pacific. North America maintains a substantial market share, anchored by its robust automotive and aerospace industries. Asia Pacific, led by China and India, is exhibiting rapid growth fueled by industrialization and expanding automotive production. Europe is also a significant contributor, driven by strong demand from automotive and medical sectors. The competitive landscape features prominent players such as Asahi Kasei, Solvay S.A., Mitsui Chemicals, Arkema S.A., Evonik Industries AG, and BASF SE. These companies are actively engaged in product innovation, strategic collaborations, and global expansion to solidify their market positions and leverage growth opportunities, fostering an environment of innovation and driving market advancement.
High-Performance Polyamides Industry Company Market Share
High-Performance Polyamides Industry Market Report: 2019-2033
This comprehensive report provides a detailed analysis of the High-Performance Polyamides industry, offering invaluable insights for businesses, investors, and researchers seeking to navigate this dynamic market. The study period covers 2019-2033, with 2025 serving as the base and estimated year. The forecast period spans 2025-2033, while the historical period encompasses 2019-2024. The report projects a market valued at $XX Million in 2025, poised for significant growth over the forecast period.
High-Performance Polyamides Industry Market Structure & Competitive Landscape
The High-Performance Polyamides market exhibits a moderately concentrated structure, with key players such as Asahi Kasei, Solvay S.A., Mitsui Chemicals, Arkema SA, Evonik Industries AG, Teknor Apex Company, Toray Industries Inc, BASF SE, DuPont, and Lanxess holding significant market share. The Herfindahl-Hirschman Index (HHI) is estimated at xx in 2025, indicating a moderately concentrated market.
- Innovation Drivers: Ongoing R&D efforts focused on enhancing material properties like strength, temperature resistance, and chemical stability drive market growth. This includes the development of bio-based polyamides and tailored solutions for specific applications.
- Regulatory Impacts: Stringent environmental regulations concerning material sustainability and manufacturing processes influence market dynamics. Compliance costs and the demand for eco-friendly alternatives shape industry strategies.
- Product Substitutes: Competition arises from alternative materials such as high-performance plastics, composites, and metals, depending on the specific application. This necessitates continuous innovation to maintain a competitive edge.
- End-User Segmentation: The market is segmented by end-user industries, including Automotive, Aerospace & Defense, Medical, Industrial, Electrical & Electronics, and Others. The automotive sector is currently the largest segment, accounting for xx% of the total market value in 2025.
- M&A Trends: The industry witnesses a moderate level of mergers and acquisitions (M&A) activity, primarily driven by companies seeking to expand their product portfolios, technological capabilities, and market reach. The total M&A volume during the historical period (2019-2024) is estimated at $xx Million.
High-Performance Polyamides Industry Market Trends & Opportunities
The global High-Performance Polyamides market is experiencing robust growth, driven by several key factors. The market size is projected to expand at a Compound Annual Growth Rate (CAGR) of xx% during the forecast period (2025-2033). This expansion is fueled by increasing demand from diverse end-user sectors.
Technological advancements, particularly in additive manufacturing (3D printing) and material science, are opening up new avenues for high-performance polyamides. Consumer preferences are shifting towards lightweight, durable, and sustainable materials, creating significant opportunities for innovative polyamide solutions. The increasing adoption of electric vehicles and advancements in aerospace technology further boost market demand. Competitive dynamics are characterized by product differentiation, cost optimization, and strategic partnerships. Market penetration rates vary across different end-user segments and geographical regions. The automotive industry shows the highest penetration rate (xx%), followed by the aerospace and defense sector (xx%). Further analysis reveals a strong correlation between economic growth and increased demand for high-performance polyamides.
Dominant Markets & Segments in High-Performance Polyamides Industry
The automotive industry stands as the dominant end-user segment, accounting for xx Million in 2025, driven primarily by the growing demand for lightweight components in vehicles. Geographically, Asia-Pacific is the leading market, fueled by rapid industrialization and infrastructure development.
Key Growth Drivers:
- Automotive: Increasing demand for lightweight vehicles, stringent fuel efficiency regulations, and the rise of electric vehicles.
- Aerospace & Defense: Need for high-strength, lightweight materials in aircraft and defense systems.
- Medical: Growing demand for biocompatible materials in medical implants and devices.
- Polyamide 6T: Superior mechanical properties and chemical resistance, making it suitable for high-performance applications.
- Asia-Pacific: Rapid industrialization, expanding automotive sector, and robust infrastructure development.
The report provides a detailed breakdown of market dominance across various segments and regions, analyzing their growth trajectories and contributing factors. Further analysis dives into the reasons behind the dominance of specific segments, including regional-specific market drivers, regulatory factors, and the availability of skilled labor.
High-Performance Polyamides Industry Product Analysis
High-performance polyamides are witnessing continuous innovation, with advancements focused on enhancing material properties such as strength, heat resistance, and chemical resistance. These advancements are leading to broader applications across various sectors, such as automotive parts, aerospace components, medical implants, and electronic devices. Companies are focusing on developing specialized grades of polyamides to cater to specific application requirements, thus improving the product's market fit and strengthening its competitive advantage. The focus on sustainability is also driving the development of bio-based polyamides and recyclable options.
Key Drivers, Barriers & Challenges in High-Performance Polyamides Industry
Key Drivers:
- Technological advancements in material science and manufacturing processes.
- Growing demand from diverse end-user industries, particularly automotive and aerospace.
- Stringent regulations promoting lightweight and sustainable materials.
Key Challenges:
- Fluctuations in raw material prices.
- Intense competition from alternative materials.
- Stringent environmental regulations increasing production costs. The impact of these regulations on profitability is estimated at xx% in 2025.
Growth Drivers in the High-Performance Polyamides Industry Market
The growth of the high-performance polyamides industry is primarily driven by technological advancements that enhance material properties and expand applications, including 3D printing, which enables complex geometries and faster prototyping. Growing demand from key end-use segments such as automotive (lightweighting initiatives) and aerospace (structural components) contribute significantly. Furthermore, supportive government regulations and policies promoting the use of sustainable materials are driving adoption.
Challenges Impacting High-Performance Polyamides Industry Growth
The high-performance polyamides industry faces challenges such as fluctuating raw material prices impacting profitability and supply chain disruptions. Stringent environmental regulations increase production costs, while intense competition from substitute materials requires continuous innovation and cost optimization. These factors, coupled with potential economic downturns, can significantly impact market growth.
Key Players Shaping the High-Performance Polyamides Industry Market
Significant High-Performance Polyamides Industry Industry Milestones
- 2020: Introduction of a new bio-based polyamide by Evonik Industries AG.
- 2021: Merger between two key players resulting in increased market share.
- 2022: Launch of a high-temperature-resistant polyamide by Solvay S.A.
- 2023: Significant investment in R&D for sustainable polyamide production by BASF SE.
- 2024: Regulatory changes impacting the use of certain polyamide types in the automotive industry.
Future Outlook for High-Performance Polyamides Industry Market
The high-performance polyamides market is poised for continued growth, driven by ongoing technological innovations, increasing demand from key end-use industries, and supportive government policies. Strategic opportunities exist in developing sustainable and recyclable materials, exploring new applications, and expanding into emerging markets. The market's future trajectory is strongly linked to the growth of sectors such as electric vehicles and renewable energy, offering significant market potential in the years to come.
High-Performance Polyamides Industry Segmentation
-
1. Type
- 1.1. Polyamide 11
- 1.2. Polyamide 46
- 1.3. Polyphthalamides
- 1.4. Polyamide 6T
- 1.5. Other Types
-
2. End-user Industry
- 2.1. Automotive
- 2.2. Aerospace and Defense
- 2.3. Medical
- 2.4. Industrial
- 2.5. Electrical and Electronics
- 2.6. Other End-user Industries
High-Performance Polyamides Industry Segmentation By Geography
-
1. Asia Pacific
- 1.1. China
- 1.2. India
- 1.3. Japan
- 1.4. South Korea
- 1.5. Rest of Asia Pacific
-
2. North America
- 2.1. United States
- 2.2. Canada
- 2.3. Mexico
-
3. Europe
- 3.1. Germany
- 3.2. United Kingdom
- 3.3. France
- 3.4. Italy
- 3.5. Rest of Europe
-
4. South America
- 4.1. Brazil
- 4.2. Argentina
- 4.3. Rest of South America
-
5. Middle East and Africa
- 5.1. Saudi Arabia
- 5.2. South Africa
- 5.3. Rest of Middle East and Africa
High-Performance Polyamides Industry Regional Market Share
Geographic Coverage of High-Performance Polyamides Industry
High-Performance Polyamides Industry REPORT HIGHLIGHTS
| Aspects | Details |
|---|---|
| Study Period | 2020-2034 |
| Base Year | 2025 |
| Estimated Year | 2026 |
| Forecast Period | 2026-2034 |
| Historical Period | 2020-2025 |
| Growth Rate | CAGR of 5.5% from 2020-2034 |
| Segmentation |
|
Table of Contents
- 1. Introduction
- 1.1. Research Scope
- 1.2. Market Segmentation
- 1.3. Research Methodology
- 1.4. Definitions and Assumptions
- 2. Executive Summary
- 2.1. Introduction
- 3. Market Dynamics
- 3.1. Introduction
- 3.2. Market Drivers
- 3.2.1. ; Increasing Applications for High-Performance Polymers; Growing Demand from the Automobile Industry
- 3.3. Market Restrains
- 3.3.1. ; High cost and Impact of COVID-19; Other Restraints
- 3.4. Market Trends
- 3.4.1. Growing Demand from Automobile Sector
- 4. Market Factor Analysis
- 4.1. Porters Five Forces
- 4.2. Supply/Value Chain
- 4.3. PESTEL analysis
- 4.4. Market Entropy
- 4.5. Patent/Trademark Analysis
- 5. Global High-Performance Polyamides Industry Analysis, Insights and Forecast, 2020-2032
- 5.1. Market Analysis, Insights and Forecast - by Type
- 5.1.1. Polyamide 11
- 5.1.2. Polyamide 46
- 5.1.3. Polyphthalamides
- 5.1.4. Polyamide 6T
- 5.1.5. Other Types
- 5.2. Market Analysis, Insights and Forecast - by End-user Industry
- 5.2.1. Automotive
- 5.2.2. Aerospace and Defense
- 5.2.3. Medical
- 5.2.4. Industrial
- 5.2.5. Electrical and Electronics
- 5.2.6. Other End-user Industries
- 5.3. Market Analysis, Insights and Forecast - by Region
- 5.3.1. Asia Pacific
- 5.3.2. North America
- 5.3.3. Europe
- 5.3.4. South America
- 5.3.5. Middle East and Africa
- 5.1. Market Analysis, Insights and Forecast - by Type
- 6. Asia Pacific High-Performance Polyamides Industry Analysis, Insights and Forecast, 2020-2032
- 6.1. Market Analysis, Insights and Forecast - by Type
- 6.1.1. Polyamide 11
- 6.1.2. Polyamide 46
- 6.1.3. Polyphthalamides
- 6.1.4. Polyamide 6T
- 6.1.5. Other Types
- 6.2. Market Analysis, Insights and Forecast - by End-user Industry
- 6.2.1. Automotive
- 6.2.2. Aerospace and Defense
- 6.2.3. Medical
- 6.2.4. Industrial
- 6.2.5. Electrical and Electronics
- 6.2.6. Other End-user Industries
- 6.1. Market Analysis, Insights and Forecast - by Type
- 7. North America High-Performance Polyamides Industry Analysis, Insights and Forecast, 2020-2032
- 7.1. Market Analysis, Insights and Forecast - by Type
- 7.1.1. Polyamide 11
- 7.1.2. Polyamide 46
- 7.1.3. Polyphthalamides
- 7.1.4. Polyamide 6T
- 7.1.5. Other Types
- 7.2. Market Analysis, Insights and Forecast - by End-user Industry
- 7.2.1. Automotive
- 7.2.2. Aerospace and Defense
- 7.2.3. Medical
- 7.2.4. Industrial
- 7.2.5. Electrical and Electronics
- 7.2.6. Other End-user Industries
- 7.1. Market Analysis, Insights and Forecast - by Type
- 8. Europe High-Performance Polyamides Industry Analysis, Insights and Forecast, 2020-2032
- 8.1. Market Analysis, Insights and Forecast - by Type
- 8.1.1. Polyamide 11
- 8.1.2. Polyamide 46
- 8.1.3. Polyphthalamides
- 8.1.4. Polyamide 6T
- 8.1.5. Other Types
- 8.2. Market Analysis, Insights and Forecast - by End-user Industry
- 8.2.1. Automotive
- 8.2.2. Aerospace and Defense
- 8.2.3. Medical
- 8.2.4. Industrial
- 8.2.5. Electrical and Electronics
- 8.2.6. Other End-user Industries
- 8.1. Market Analysis, Insights and Forecast - by Type
- 9. South America High-Performance Polyamides Industry Analysis, Insights and Forecast, 2020-2032
- 9.1. Market Analysis, Insights and Forecast - by Type
- 9.1.1. Polyamide 11
- 9.1.2. Polyamide 46
- 9.1.3. Polyphthalamides
- 9.1.4. Polyamide 6T
- 9.1.5. Other Types
- 9.2. Market Analysis, Insights and Forecast - by End-user Industry
- 9.2.1. Automotive
- 9.2.2. Aerospace and Defense
- 9.2.3. Medical
- 9.2.4. Industrial
- 9.2.5. Electrical and Electronics
- 9.2.6. Other End-user Industries
- 9.1. Market Analysis, Insights and Forecast - by Type
- 10. Middle East and Africa High-Performance Polyamides Industry Analysis, Insights and Forecast, 2020-2032
- 10.1. Market Analysis, Insights and Forecast - by Type
- 10.1.1. Polyamide 11
- 10.1.2. Polyamide 46
- 10.1.3. Polyphthalamides
- 10.1.4. Polyamide 6T
- 10.1.5. Other Types
- 10.2. Market Analysis, Insights and Forecast - by End-user Industry
- 10.2.1. Automotive
- 10.2.2. Aerospace and Defense
- 10.2.3. Medical
- 10.2.4. Industrial
- 10.2.5. Electrical and Electronics
- 10.2.6. Other End-user Industries
- 10.1. Market Analysis, Insights and Forecast - by Type
- 11. Competitive Analysis
- 11.1. Global Market Share Analysis 2025
- 11.2. Company Profiles
- 11.2.1 Asahi Kasei
- 11.2.1.1. Overview
- 11.2.1.2. Products
- 11.2.1.3. SWOT Analysis
- 11.2.1.4. Recent Developments
- 11.2.1.5. Financials (Based on Availability)
- 11.2.2 Solvay S A
- 11.2.2.1. Overview
- 11.2.2.2. Products
- 11.2.2.3. SWOT Analysis
- 11.2.2.4. Recent Developments
- 11.2.2.5. Financials (Based on Availability)
- 11.2.3 Mitsui Chemicals
- 11.2.3.1. Overview
- 11.2.3.2. Products
- 11.2.3.3. SWOT Analysis
- 11.2.3.4. Recent Developments
- 11.2.3.5. Financials (Based on Availability)
- 11.2.4 Arkema SA
- 11.2.4.1. Overview
- 11.2.4.2. Products
- 11.2.4.3. SWOT Analysis
- 11.2.4.4. Recent Developments
- 11.2.4.5. Financials (Based on Availability)
- 11.2.5 Evonik Industries AG
- 11.2.5.1. Overview
- 11.2.5.2. Products
- 11.2.5.3. SWOT Analysis
- 11.2.5.4. Recent Developments
- 11.2.5.5. Financials (Based on Availability)
- 11.2.6 Teknor Apex Company
- 11.2.6.1. Overview
- 11.2.6.2. Products
- 11.2.6.3. SWOT Analysis
- 11.2.6.4. Recent Developments
- 11.2.6.5. Financials (Based on Availability)
- 11.2.7 Toray Industries Inc
- 11.2.7.1. Overview
- 11.2.7.2. Products
- 11.2.7.3. SWOT Analysis
- 11.2.7.4. Recent Developments
- 11.2.7.5. Financials (Based on Availability)
- 11.2.8 BASF SE
- 11.2.8.1. Overview
- 11.2.8.2. Products
- 11.2.8.3. SWOT Analysis
- 11.2.8.4. Recent Developments
- 11.2.8.5. Financials (Based on Availability)
- 11.2.9 DuPont
- 11.2.9.1. Overview
- 11.2.9.2. Products
- 11.2.9.3. SWOT Analysis
- 11.2.9.4. Recent Developments
- 11.2.9.5. Financials (Based on Availability)
- 11.2.10 Lanxess
- 11.2.10.1. Overview
- 11.2.10.2. Products
- 11.2.10.3. SWOT Analysis
- 11.2.10.4. Recent Developments
- 11.2.10.5. Financials (Based on Availability)
- 11.2.1 Asahi Kasei
List of Figures
- Figure 1: Global High-Performance Polyamides Industry Revenue Breakdown (billion, %) by Region 2025 & 2033
- Figure 2: Global High-Performance Polyamides Industry Volume Breakdown (K Tons, %) by Region 2025 & 2033
- Figure 3: Asia Pacific High-Performance Polyamides Industry Revenue (billion), by Type 2025 & 2033
- Figure 4: Asia Pacific High-Performance Polyamides Industry Volume (K Tons), by Type 2025 & 2033
- Figure 5: Asia Pacific High-Performance Polyamides Industry Revenue Share (%), by Type 2025 & 2033
- Figure 6: Asia Pacific High-Performance Polyamides Industry Volume Share (%), by Type 2025 & 2033
- Figure 7: Asia Pacific High-Performance Polyamides Industry Revenue (billion), by End-user Industry 2025 & 2033
- Figure 8: Asia Pacific High-Performance Polyamides Industry Volume (K Tons), by End-user Industry 2025 & 2033
- Figure 9: Asia Pacific High-Performance Polyamides Industry Revenue Share (%), by End-user Industry 2025 & 2033
- Figure 10: Asia Pacific High-Performance Polyamides Industry Volume Share (%), by End-user Industry 2025 & 2033
- Figure 11: Asia Pacific High-Performance Polyamides Industry Revenue (billion), by Country 2025 & 2033
- Figure 12: Asia Pacific High-Performance Polyamides Industry Volume (K Tons), by Country 2025 & 2033
- Figure 13: Asia Pacific High-Performance Polyamides Industry Revenue Share (%), by Country 2025 & 2033
- Figure 14: Asia Pacific High-Performance Polyamides Industry Volume Share (%), by Country 2025 & 2033
- Figure 15: North America High-Performance Polyamides Industry Revenue (billion), by Type 2025 & 2033
- Figure 16: North America High-Performance Polyamides Industry Volume (K Tons), by Type 2025 & 2033
- Figure 17: North America High-Performance Polyamides Industry Revenue Share (%), by Type 2025 & 2033
- Figure 18: North America High-Performance Polyamides Industry Volume Share (%), by Type 2025 & 2033
- Figure 19: North America High-Performance Polyamides Industry Revenue (billion), by End-user Industry 2025 & 2033
- Figure 20: North America High-Performance Polyamides Industry Volume (K Tons), by End-user Industry 2025 & 2033
- Figure 21: North America High-Performance Polyamides Industry Revenue Share (%), by End-user Industry 2025 & 2033
- Figure 22: North America High-Performance Polyamides Industry Volume Share (%), by End-user Industry 2025 & 2033
- Figure 23: North America High-Performance Polyamides Industry Revenue (billion), by Country 2025 & 2033
- Figure 24: North America High-Performance Polyamides Industry Volume (K Tons), by Country 2025 & 2033
- Figure 25: North America High-Performance Polyamides Industry Revenue Share (%), by Country 2025 & 2033
- Figure 26: North America High-Performance Polyamides Industry Volume Share (%), by Country 2025 & 2033
- Figure 27: Europe High-Performance Polyamides Industry Revenue (billion), by Type 2025 & 2033
- Figure 28: Europe High-Performance Polyamides Industry Volume (K Tons), by Type 2025 & 2033
- Figure 29: Europe High-Performance Polyamides Industry Revenue Share (%), by Type 2025 & 2033
- Figure 30: Europe High-Performance Polyamides Industry Volume Share (%), by Type 2025 & 2033
- Figure 31: Europe High-Performance Polyamides Industry Revenue (billion), by End-user Industry 2025 & 2033
- Figure 32: Europe High-Performance Polyamides Industry Volume (K Tons), by End-user Industry 2025 & 2033
- Figure 33: Europe High-Performance Polyamides Industry Revenue Share (%), by End-user Industry 2025 & 2033
- Figure 34: Europe High-Performance Polyamides Industry Volume Share (%), by End-user Industry 2025 & 2033
- Figure 35: Europe High-Performance Polyamides Industry Revenue (billion), by Country 2025 & 2033
- Figure 36: Europe High-Performance Polyamides Industry Volume (K Tons), by Country 2025 & 2033
- Figure 37: Europe High-Performance Polyamides Industry Revenue Share (%), by Country 2025 & 2033
- Figure 38: Europe High-Performance Polyamides Industry Volume Share (%), by Country 2025 & 2033
- Figure 39: South America High-Performance Polyamides Industry Revenue (billion), by Type 2025 & 2033
- Figure 40: South America High-Performance Polyamides Industry Volume (K Tons), by Type 2025 & 2033
- Figure 41: South America High-Performance Polyamides Industry Revenue Share (%), by Type 2025 & 2033
- Figure 42: South America High-Performance Polyamides Industry Volume Share (%), by Type 2025 & 2033
- Figure 43: South America High-Performance Polyamides Industry Revenue (billion), by End-user Industry 2025 & 2033
- Figure 44: South America High-Performance Polyamides Industry Volume (K Tons), by End-user Industry 2025 & 2033
- Figure 45: South America High-Performance Polyamides Industry Revenue Share (%), by End-user Industry 2025 & 2033
- Figure 46: South America High-Performance Polyamides Industry Volume Share (%), by End-user Industry 2025 & 2033
- Figure 47: South America High-Performance Polyamides Industry Revenue (billion), by Country 2025 & 2033
- Figure 48: South America High-Performance Polyamides Industry Volume (K Tons), by Country 2025 & 2033
- Figure 49: South America High-Performance Polyamides Industry Revenue Share (%), by Country 2025 & 2033
- Figure 50: South America High-Performance Polyamides Industry Volume Share (%), by Country 2025 & 2033
- Figure 51: Middle East and Africa High-Performance Polyamides Industry Revenue (billion), by Type 2025 & 2033
- Figure 52: Middle East and Africa High-Performance Polyamides Industry Volume (K Tons), by Type 2025 & 2033
- Figure 53: Middle East and Africa High-Performance Polyamides Industry Revenue Share (%), by Type 2025 & 2033
- Figure 54: Middle East and Africa High-Performance Polyamides Industry Volume Share (%), by Type 2025 & 2033
- Figure 55: Middle East and Africa High-Performance Polyamides Industry Revenue (billion), by End-user Industry 2025 & 2033
- Figure 56: Middle East and Africa High-Performance Polyamides Industry Volume (K Tons), by End-user Industry 2025 & 2033
- Figure 57: Middle East and Africa High-Performance Polyamides Industry Revenue Share (%), by End-user Industry 2025 & 2033
- Figure 58: Middle East and Africa High-Performance Polyamides Industry Volume Share (%), by End-user Industry 2025 & 2033
- Figure 59: Middle East and Africa High-Performance Polyamides Industry Revenue (billion), by Country 2025 & 2033
- Figure 60: Middle East and Africa High-Performance Polyamides Industry Volume (K Tons), by Country 2025 & 2033
- Figure 61: Middle East and Africa High-Performance Polyamides Industry Revenue Share (%), by Country 2025 & 2033
- Figure 62: Middle East and Africa High-Performance Polyamides Industry Volume Share (%), by Country 2025 & 2033
List of Tables
- Table 1: Global High-Performance Polyamides Industry Revenue billion Forecast, by Type 2020 & 2033
- Table 2: Global High-Performance Polyamides Industry Volume K Tons Forecast, by Type 2020 & 2033
- Table 3: Global High-Performance Polyamides Industry Revenue billion Forecast, by End-user Industry 2020 & 2033
- Table 4: Global High-Performance Polyamides Industry Volume K Tons Forecast, by End-user Industry 2020 & 2033
- Table 5: Global High-Performance Polyamides Industry Revenue billion Forecast, by Region 2020 & 2033
- Table 6: Global High-Performance Polyamides Industry Volume K Tons Forecast, by Region 2020 & 2033
- Table 7: Global High-Performance Polyamides Industry Revenue billion Forecast, by Type 2020 & 2033
- Table 8: Global High-Performance Polyamides Industry Volume K Tons Forecast, by Type 2020 & 2033
- Table 9: Global High-Performance Polyamides Industry Revenue billion Forecast, by End-user Industry 2020 & 2033
- Table 10: Global High-Performance Polyamides Industry Volume K Tons Forecast, by End-user Industry 2020 & 2033
- Table 11: Global High-Performance Polyamides Industry Revenue billion Forecast, by Country 2020 & 2033
- Table 12: Global High-Performance Polyamides Industry Volume K Tons Forecast, by Country 2020 & 2033
- Table 13: China High-Performance Polyamides Industry Revenue (billion) Forecast, by Application 2020 & 2033
- Table 14: China High-Performance Polyamides Industry Volume (K Tons) Forecast, by Application 2020 & 2033
- Table 15: India High-Performance Polyamides Industry Revenue (billion) Forecast, by Application 2020 & 2033
- Table 16: India High-Performance Polyamides Industry Volume (K Tons) Forecast, by Application 2020 & 2033
- Table 17: Japan High-Performance Polyamides Industry Revenue (billion) Forecast, by Application 2020 & 2033
- Table 18: Japan High-Performance Polyamides Industry Volume (K Tons) Forecast, by Application 2020 & 2033
- Table 19: South Korea High-Performance Polyamides Industry Revenue (billion) Forecast, by Application 2020 & 2033
- Table 20: South Korea High-Performance Polyamides Industry Volume (K Tons) Forecast, by Application 2020 & 2033
- Table 21: Rest of Asia Pacific High-Performance Polyamides Industry Revenue (billion) Forecast, by Application 2020 & 2033
- Table 22: Rest of Asia Pacific High-Performance Polyamides Industry Volume (K Tons) Forecast, by Application 2020 & 2033
- Table 23: Global High-Performance Polyamides Industry Revenue billion Forecast, by Type 2020 & 2033
- Table 24: Global High-Performance Polyamides Industry Volume K Tons Forecast, by Type 2020 & 2033
- Table 25: Global High-Performance Polyamides Industry Revenue billion Forecast, by End-user Industry 2020 & 2033
- Table 26: Global High-Performance Polyamides Industry Volume K Tons Forecast, by End-user Industry 2020 & 2033
- Table 27: Global High-Performance Polyamides Industry Revenue billion Forecast, by Country 2020 & 2033
- Table 28: Global High-Performance Polyamides Industry Volume K Tons Forecast, by Country 2020 & 2033
- Table 29: United States High-Performance Polyamides Industry Revenue (billion) Forecast, by Application 2020 & 2033
- Table 30: United States High-Performance Polyamides Industry Volume (K Tons) Forecast, by Application 2020 & 2033
- Table 31: Canada High-Performance Polyamides Industry Revenue (billion) Forecast, by Application 2020 & 2033
- Table 32: Canada High-Performance Polyamides Industry Volume (K Tons) Forecast, by Application 2020 & 2033
- Table 33: Mexico High-Performance Polyamides Industry Revenue (billion) Forecast, by Application 2020 & 2033
- Table 34: Mexico High-Performance Polyamides Industry Volume (K Tons) Forecast, by Application 2020 & 2033
- Table 35: Global High-Performance Polyamides Industry Revenue billion Forecast, by Type 2020 & 2033
- Table 36: Global High-Performance Polyamides Industry Volume K Tons Forecast, by Type 2020 & 2033
- Table 37: Global High-Performance Polyamides Industry Revenue billion Forecast, by End-user Industry 2020 & 2033
- Table 38: Global High-Performance Polyamides Industry Volume K Tons Forecast, by End-user Industry 2020 & 2033
- Table 39: Global High-Performance Polyamides Industry Revenue billion Forecast, by Country 2020 & 2033
- Table 40: Global High-Performance Polyamides Industry Volume K Tons Forecast, by Country 2020 & 2033
- Table 41: Germany High-Performance Polyamides Industry Revenue (billion) Forecast, by Application 2020 & 2033
- Table 42: Germany High-Performance Polyamides Industry Volume (K Tons) Forecast, by Application 2020 & 2033
- Table 43: United Kingdom High-Performance Polyamides Industry Revenue (billion) Forecast, by Application 2020 & 2033
- Table 44: United Kingdom High-Performance Polyamides Industry Volume (K Tons) Forecast, by Application 2020 & 2033
- Table 45: France High-Performance Polyamides Industry Revenue (billion) Forecast, by Application 2020 & 2033
- Table 46: France High-Performance Polyamides Industry Volume (K Tons) Forecast, by Application 2020 & 2033
- Table 47: Italy High-Performance Polyamides Industry Revenue (billion) Forecast, by Application 2020 & 2033
- Table 48: Italy High-Performance Polyamides Industry Volume (K Tons) Forecast, by Application 2020 & 2033
- Table 49: Rest of Europe High-Performance Polyamides Industry Revenue (billion) Forecast, by Application 2020 & 2033
- Table 50: Rest of Europe High-Performance Polyamides Industry Volume (K Tons) Forecast, by Application 2020 & 2033
- Table 51: Global High-Performance Polyamides Industry Revenue billion Forecast, by Type 2020 & 2033
- Table 52: Global High-Performance Polyamides Industry Volume K Tons Forecast, by Type 2020 & 2033
- Table 53: Global High-Performance Polyamides Industry Revenue billion Forecast, by End-user Industry 2020 & 2033
- Table 54: Global High-Performance Polyamides Industry Volume K Tons Forecast, by End-user Industry 2020 & 2033
- Table 55: Global High-Performance Polyamides Industry Revenue billion Forecast, by Country 2020 & 2033
- Table 56: Global High-Performance Polyamides Industry Volume K Tons Forecast, by Country 2020 & 2033
- Table 57: Brazil High-Performance Polyamides Industry Revenue (billion) Forecast, by Application 2020 & 2033
- Table 58: Brazil High-Performance Polyamides Industry Volume (K Tons) Forecast, by Application 2020 & 2033
- Table 59: Argentina High-Performance Polyamides Industry Revenue (billion) Forecast, by Application 2020 & 2033
- Table 60: Argentina High-Performance Polyamides Industry Volume (K Tons) Forecast, by Application 2020 & 2033
- Table 61: Rest of South America High-Performance Polyamides Industry Revenue (billion) Forecast, by Application 2020 & 2033
- Table 62: Rest of South America High-Performance Polyamides Industry Volume (K Tons) Forecast, by Application 2020 & 2033
- Table 63: Global High-Performance Polyamides Industry Revenue billion Forecast, by Type 2020 & 2033
- Table 64: Global High-Performance Polyamides Industry Volume K Tons Forecast, by Type 2020 & 2033
- Table 65: Global High-Performance Polyamides Industry Revenue billion Forecast, by End-user Industry 2020 & 2033
- Table 66: Global High-Performance Polyamides Industry Volume K Tons Forecast, by End-user Industry 2020 & 2033
- Table 67: Global High-Performance Polyamides Industry Revenue billion Forecast, by Country 2020 & 2033
- Table 68: Global High-Performance Polyamides Industry Volume K Tons Forecast, by Country 2020 & 2033
- Table 69: Saudi Arabia High-Performance Polyamides Industry Revenue (billion) Forecast, by Application 2020 & 2033
- Table 70: Saudi Arabia High-Performance Polyamides Industry Volume (K Tons) Forecast, by Application 2020 & 2033
- Table 71: South Africa High-Performance Polyamides Industry Revenue (billion) Forecast, by Application 2020 & 2033
- Table 72: South Africa High-Performance Polyamides Industry Volume (K Tons) Forecast, by Application 2020 & 2033
- Table 73: Rest of Middle East and Africa High-Performance Polyamides Industry Revenue (billion) Forecast, by Application 2020 & 2033
- Table 74: Rest of Middle East and Africa High-Performance Polyamides Industry Volume (K Tons) Forecast, by Application 2020 & 2033
Frequently Asked Questions
1. What is the projected Compound Annual Growth Rate (CAGR) of the High-Performance Polyamides Industry?
The projected CAGR is approximately 5.5%.
2. Which companies are prominent players in the High-Performance Polyamides Industry?
Key companies in the market include Asahi Kasei, Solvay S A, Mitsui Chemicals, Arkema SA, Evonik Industries AG, Teknor Apex Company, Toray Industries Inc, BASF SE, DuPont, Lanxess.
3. What are the main segments of the High-Performance Polyamides Industry?
The market segments include Type, End-user Industry.
4. Can you provide details about the market size?
The market size is estimated to be USD 2.23 billion as of 2022.
5. What are some drivers contributing to market growth?
; Increasing Applications for High-Performance Polymers; Growing Demand from the Automobile Industry.
6. What are the notable trends driving market growth?
Growing Demand from Automobile Sector.
7. Are there any restraints impacting market growth?
; High cost and Impact of COVID-19; Other Restraints.
8. Can you provide examples of recent developments in the market?
N/A
9. What pricing options are available for accessing the report?
Pricing options include single-user, multi-user, and enterprise licenses priced at USD 4750, USD 5250, and USD 8750 respectively.
10. Is the market size provided in terms of value or volume?
The market size is provided in terms of value, measured in billion and volume, measured in K Tons.
11. Are there any specific market keywords associated with the report?
Yes, the market keyword associated with the report is "High-Performance Polyamides Industry," which aids in identifying and referencing the specific market segment covered.
12. How do I determine which pricing option suits my needs best?
The pricing options vary based on user requirements and access needs. Individual users may opt for single-user licenses, while businesses requiring broader access may choose multi-user or enterprise licenses for cost-effective access to the report.
13. Are there any additional resources or data provided in the High-Performance Polyamides Industry report?
While the report offers comprehensive insights, it's advisable to review the specific contents or supplementary materials provided to ascertain if additional resources or data are available.
14. How can I stay updated on further developments or reports in the High-Performance Polyamides Industry?
To stay informed about further developments, trends, and reports in the High-Performance Polyamides Industry, consider subscribing to industry newsletters, following relevant companies and organizations, or regularly checking reputable industry news sources and publications.
Methodology
Step 1 - Identification of Relevant Samples Size from Population Database


Step 2 - Approaches for Defining Global Market Size (Value, Volume* & Price*)

Note*: In applicable scenarios
Step 3 - Data Sources
Primary Research
- Web Analytics
- Survey Reports
- Research Institute
- Latest Research Reports
- Opinion Leaders
Secondary Research
- Annual Reports
- White Paper
- Latest Press Release
- Industry Association
- Paid Database
- Investor Presentations

Step 4 - Data Triangulation
Involves using different sources of information in order to increase the validity of a study
These sources are likely to be stakeholders in a program - participants, other researchers, program staff, other community members, and so on.
Then we put all data in single framework & apply various statistical tools to find out the dynamic on the market.
During the analysis stage, feedback from the stakeholder groups would be compared to determine areas of agreement as well as areas of divergence