

Key Insights
The High-Purity Alumina (HPA) market is poised for significant expansion, driven by increasing demand for advanced materials across key industries. With a projected Compound Annual Growth Rate (CAGR) of 20.62%, the market is estimated to reach $0.57 billion by 2025. This growth is underpinned by the burgeoning LED lighting sector, reliant on HPA for sapphire substrate production, and the electronics industry's need for high-performance ceramics and advanced packaging. Emerging applications in lithium-ion batteries and fuel cells further fuel market development, presenting lucrative opportunities for manufacturers. While detailed regional data is limited, the market is expected to be geographically diverse, with established players in Asia (especially China) and North America, and a growing presence elsewhere. The competitive environment features both multinational corporations and specialized firms. Key industry trends include a focus on sustainability and the development of cost-effective, efficient production methods. Challenges such as raw material price volatility and the imperative for continuous technological innovation are being addressed by market participants.
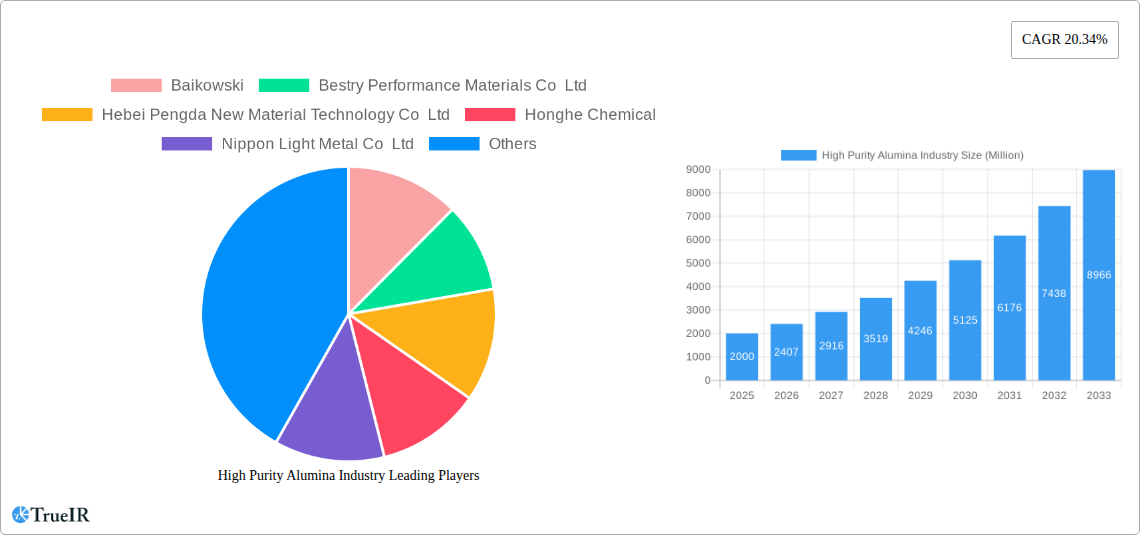
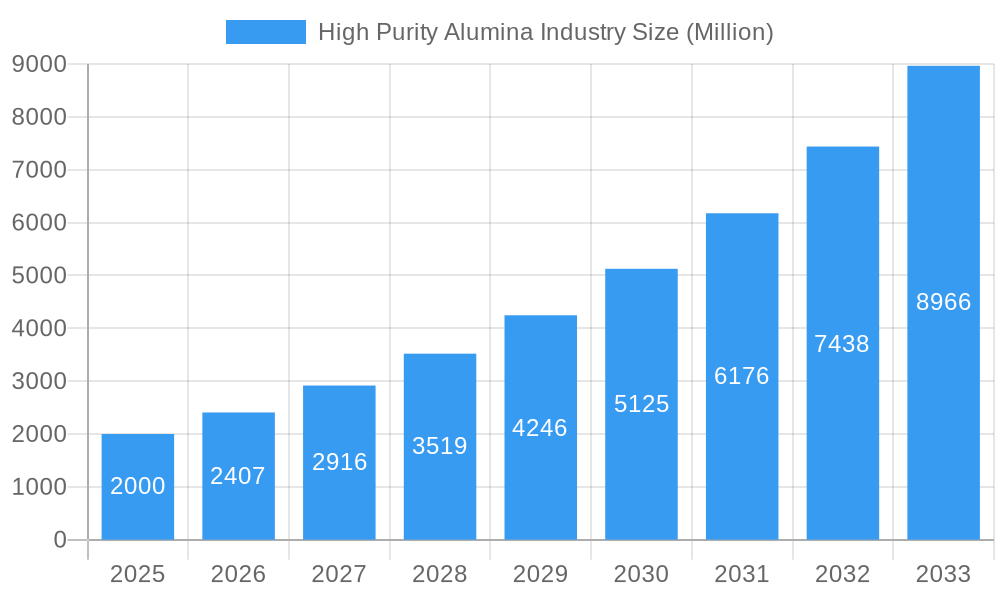
High Purity Alumina Industry Market Size (In Million)
The market's diverse applications span LED lighting, semiconductors, ceramics, and advanced batteries. Ongoing materials science innovation continually broadens HPA's application scope, ensuring sustained market growth. While challenges like raw material price fluctuations persist, technological advancements and the rising demand for high-performance materials are anticipated to mitigate these concerns. The competitive landscape includes established global entities and regional manufacturers, presenting both opportunities and potential threats. Future market trajectory will be influenced by technological progress, regulatory shifts, and the global economic climate. However, the current robust growth indicates a highly probable upward trend.
High Purity Alumina Industry Company Market Share
High Purity Alumina Industry Market Report: 2019-2033 Forecast
This comprehensive report provides an in-depth analysis of the High Purity Alumina industry, projecting market trends and growth from 2019 to 2033. The study covers market structure, competitive dynamics, key players, technological advancements, and future outlook, offering invaluable insights for industry stakeholders. With a focus on high-purity alumina (HPA) applications and a detailed analysis of the global market, this report is an essential resource for informed decision-making. The study period covers 2019-2033, with 2025 as the base and estimated year. The forecast period is 2025-2033, and the historical period is 2019-2024.
High Purity Alumina Industry Market Structure & Competitive Landscape
The High Purity Alumina market is characterized by a moderately concentrated landscape with a few major players controlling a significant share. The market concentration ratio (CR4) is estimated at xx%, indicating a moderately competitive environment. Innovation is a key driver, with companies constantly striving to improve purity levels and develop new applications. Stringent regulatory frameworks related to environmental sustainability and product safety also shape the market dynamics. Product substitutes, such as other ceramic materials, pose a competitive threat, though HPA's superior properties often maintain its dominance in specific applications. The end-user segmentation is diverse, encompassing electronics, ceramics, and energy storage (primarily for lithium-ion batteries). M&A activity in the sector has been moderate, with xx transactions recorded during the historical period, primarily focused on consolidating production capabilities and expanding market reach.
- Market Concentration: CR4 estimated at xx%.
- Innovation Drivers: Enhanced purity levels, new applications in advanced electronics and energy storage.
- Regulatory Impacts: Stringent environmental and safety regulations impacting production processes.
- Product Substitutes: Competition from alternative ceramic materials.
- End-User Segmentation: Electronics (xx Million USD), Ceramics (xx Million USD), Energy Storage (xx Million USD).
- M&A Trends: Moderate activity, xx transactions recorded between 2019-2024, focused on expansion and consolidation.
High Purity Alumina Industry Market Trends & Opportunities
The global high-purity alumina market is experiencing robust growth, driven by increasing demand from the electronics and energy storage sectors. The market size is projected to reach xx Million USD by 2033, exhibiting a compound annual growth rate (CAGR) of xx% during the forecast period. Technological advancements, such as Sumitomo Chemical's new ultra-fine α-alumina production technology, are significantly impacting the industry, leading to improved product quality and efficiency. Consumer preferences for high-performance electronics and environmentally friendly energy solutions are fueling demand for HPA. Intense competition among key players is further driving innovation and efficiency improvements, leading to a continuously evolving market landscape. Market penetration rates vary across different segments and regions, with the highest penetration observed in developed economies with advanced electronics industries.
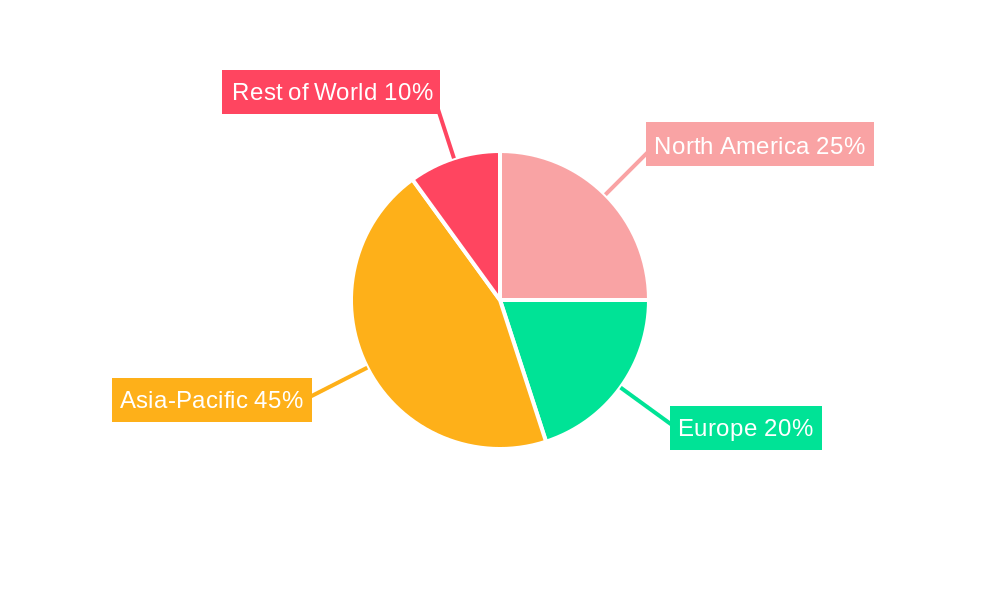
Dominant Markets & Segments in High Purity Alumina Industry
The Asia-Pacific region is currently the dominant market for high-purity alumina, driven by strong growth in electronics manufacturing and the expanding lithium-ion battery industry. China, in particular, is a major producer and consumer of HPA.
- Key Growth Drivers in Asia-Pacific:
- Rapid expansion of electronics manufacturing.
- Increasing demand for lithium-ion batteries.
- Government support for renewable energy technologies.
- Favorable infrastructure development.
The dominance of the Asia-Pacific region is primarily attributable to the large-scale presence of electronics manufacturing facilities and the burgeoning electric vehicle (EV) market. This region's continuous investment in infrastructure and supportive government policies further enhances its leading position in the high-purity alumina market. While other regions exhibit growth, Asia-Pacific's current market share significantly surpasses others, creating a substantial lead in terms of both production and consumption.
High Purity Alumina Industry Product Analysis
High-purity alumina products are characterized by their exceptional purity (99.99% or more), fine particle size, and controlled morphology, making them ideal for demanding applications. Recent innovations focus on enhancing these properties to meet the ever-evolving requirements of advanced electronics and energy storage devices. Technological advancements, such as the development of ultra-fine α-alumina by Sumitomo Chemical, improve efficiency and product quality, offering a significant competitive advantage. Market fit is directly correlated with the ability of producers to meet the specific purity and particle size requirements of various applications.
Key Drivers, Barriers & Challenges in High Purity Alumina Industry
Key Drivers:
- Growing demand from the electronics industry (especially for semiconductors and integrated circuits).
- Expansion of the electric vehicle (EV) sector driving demand for high-capacity batteries.
- Government initiatives promoting renewable energy and sustainable technologies.
Challenges:
- Fluctuations in raw material prices (e.g., aluminum hydroxide).
- Stringent environmental regulations increasing production costs.
- Intense competition among established and emerging players.
- Supply chain disruptions impacting production and delivery timelines. For example, xx% of supply was disrupted in 2022 due to geopolitical factors.
Growth Drivers in the High Purity Alumina Industry Market
The High Purity Alumina market is propelled by several key factors. The increasing demand from electronics manufacturers for high-purity materials to produce advanced components fuels significant growth. The rise in renewable energy adoption, particularly in electric vehicles and energy storage, creates a substantial demand for high-performance batteries which necessitate high-purity alumina. Government incentives and supportive policies for clean energy initiatives further amplify this growth trend. The steady technological advancements in the refinement processes and production methods of high-purity alumina further contribute to the continuous expansion of the market.
Challenges Impacting High Purity Alumina Industry Growth
Several factors hinder the growth of the high-purity alumina market. Complex and ever-changing environmental regulations can increase production costs and create compliance challenges. Supply chain vulnerabilities, such as disruptions due to geopolitical events or resource scarcity, can lead to production delays and price volatility. Intense competition among market participants necessitates constant innovation and cost optimization, increasing pressure on profit margins. Moreover, the availability and pricing of raw materials impact production feasibility and profitability.
Key Players Shaping the High Purity Alumina Industry Market
- Baikowski
- Bestry Performance Materials Co Ltd
- Hebei Pengda New Material Technology Co Ltd
- Honghe Chemical
- Nippon Light Metal Co Ltd
- Polar Sapphire
- Rusal
- Sasol (USA) Corporation
- Shandong Keheng Crystal Material Technology Co Ltd
- Sumitomo Chemical Co Ltd
- Wuxi Tuobada Titanium Dioxide Products Co Ltd
- Xuancheng Jingrui New Materials Co Ltd
- *List Not Exhaustive
Significant High Purity Alumina Industry Industry Milestones
- August 2023: Sumitomo Chemical introduced a new technology for the production of ultra-fine α-alumina, commencing production in September 2023. This significantly enhances the quality and efficiency of ultra-high purity alumina production.
- January 2022: Polar Performance Materials received USD 4.1 million in funding from Sustainable Development Technology Canada (SDTC) for Battery Cleantech. This investment supports the development of a demonstration line for high-purity alumina production specifically for lithium-ion batteries, bolstering the industry’s contribution to sustainable energy solutions.
Future Outlook for High Purity Alumina Industry Market
The High Purity Alumina market is poised for continued growth, driven by technological advancements, increasing demand from key sectors, and supportive government policies. Strategic investments in research and development are expected to yield new applications and improve product performance. The expanding electric vehicle market and the growing need for high-capacity energy storage systems will continue to stimulate demand. The industry’s commitment to sustainable production practices and improved supply chain resilience will further enhance its long-term outlook. The market is expected to witness significant expansion over the forecast period.
High Purity Alumina Industry Segmentation
-
1. Type
- 1.1. 4N
- 1.2. 5N
- 1.3. 6N
-
2. Technology
- 2.1. Hydrolysis
- 2.2. Hydrochloric Acid Leaching
-
3. Application
- 3.1. LED Lighting
- 3.2. Phosphor
- 3.3. Semiconductor
- 3.4. Lithium-ion (Li-Ion) Batteries
- 3.5. Technical Ceramics
- 3.6. Other Applications
High Purity Alumina Industry Segmentation By Geography
-
1. Asia Pacific
- 1.1. China
- 1.2. India
- 1.3. Japan
- 1.4. South Korea
- 1.5. Malaysia
- 1.6. Thailand
- 1.7. Indonesia
- 1.8. Vietnam
- 1.9. Rest of Asia Pacific
-
2. North America
- 2.1. United States
- 2.2. Canada
- 2.3. Mexico
-
3. Europe
- 3.1. Germany
- 3.2. United Kingdom
- 3.3. France
- 3.4. Italy
- 3.5. Spain
- 3.6. NORDIC Countries
- 3.7. Turkey
- 3.8. Russia
- 3.9. Rest of Europe
-
4. South America
- 4.1. Brazil
- 4.2. Argentina
- 4.3. Colombia
- 4.4. Rest of South America
-
5. Middle East and Africa
- 5.1. Saudi Arabia
- 5.2. Qatar
- 5.3. United Arab Emirates
- 5.4. Nigeria
- 5.5. Egypt
- 5.6. South Africa
- 5.7. Rest of Middle East and Africa
High Purity Alumina Industry Regional Market Share
Geographic Coverage of High Purity Alumina Industry
High Purity Alumina Industry REPORT HIGHLIGHTS
| Aspects | Details |
|---|---|
| Study Period | 2020-2034 |
| Base Year | 2025 |
| Estimated Year | 2026 |
| Forecast Period | 2026-2034 |
| Historical Period | 2020-2025 |
| Growth Rate | CAGR of 20.62% from 2020-2034 |
| Segmentation |
|
Table of Contents
- 1. Introduction
- 1.1. Research Scope
- 1.2. Market Segmentation
- 1.3. Research Objective
- 1.4. Definitions and Assumptions
- 2. Executive Summary
- 2.1. Market Snapshot
- 3. Market Dynamics
- 3.1. Market Drivers
- 3.2. Market Restrains
- 3.3. Market Trends
- 3.4. Market Opportunities
- 4. Market Factor Analysis
- 4.1. Porters Five Forces
- 4.1.1. Bargaining Power of Suppliers
- 4.1.2. Bargaining Power of Buyers
- 4.1.3. Threat of New Entrants
- 4.1.4. Threat of Substitutes
- 4.1.5. Competitive Rivalry
- 4.2. PESTEL analysis
- 4.3. BCG Analysis
- 4.3.1. Stars (High Growth, High Market Share)
- 4.3.2. Cash Cows (Low Growth, High Market Share)
- 4.3.3. Question Mark (High Growth, Low Market Share)
- 4.3.4. Dogs (Low Growth, Low Market Share)
- 4.4. Ansoff Matrix Analysis
- 4.5. Supply Chain Analysis
- 4.6. Regulatory Landscape
- 4.7. Current Market Potential and Opportunity Assessment (TAM–SAM–SOM Framework)
- 4.8. TIR Analyst Note
- 4.1. Porters Five Forces
- 5. Market Analysis, Insights and Forecast 2021-2033
- 5.1. Market Analysis, Insights and Forecast - by Type
- 5.1.1. 4N
- 5.1.2. 5N
- 5.1.3. 6N
- 5.2. Market Analysis, Insights and Forecast - by Technology
- 5.2.1. Hydrolysis
- 5.2.2. Hydrochloric Acid Leaching
- 5.3. Market Analysis, Insights and Forecast - by Application
- 5.3.1. LED Lighting
- 5.3.2. Phosphor
- 5.3.3. Semiconductor
- 5.3.4. Lithium-ion (Li-Ion) Batteries
- 5.3.5. Technical Ceramics
- 5.3.6. Other Applications
- 5.4. Market Analysis, Insights and Forecast - by Region
- 5.4.1. Asia Pacific
- 5.4.2. North America
- 5.4.3. Europe
- 5.4.4. South America
- 5.4.5. Middle East and Africa
- 5.1. Market Analysis, Insights and Forecast - by Type
- 6. Global High Purity Alumina Industry Analysis, Insights and Forecast, 2021-2033
- 6.1. Market Analysis, Insights and Forecast - by Type
- 6.1.1. 4N
- 6.1.2. 5N
- 6.1.3. 6N
- 6.2. Market Analysis, Insights and Forecast - by Technology
- 6.2.1. Hydrolysis
- 6.2.2. Hydrochloric Acid Leaching
- 6.3. Market Analysis, Insights and Forecast - by Application
- 6.3.1. LED Lighting
- 6.3.2. Phosphor
- 6.3.3. Semiconductor
- 6.3.4. Lithium-ion (Li-Ion) Batteries
- 6.3.5. Technical Ceramics
- 6.3.6. Other Applications
- 6.1. Market Analysis, Insights and Forecast - by Type
- 7. Asia Pacific High Purity Alumina Industry Analysis, Insights and Forecast, 2020-2032
- 7.1. Market Analysis, Insights and Forecast - by Type
- 7.1.1. 4N
- 7.1.2. 5N
- 7.1.3. 6N
- 7.2. Market Analysis, Insights and Forecast - by Technology
- 7.2.1. Hydrolysis
- 7.2.2. Hydrochloric Acid Leaching
- 7.3. Market Analysis, Insights and Forecast - by Application
- 7.3.1. LED Lighting
- 7.3.2. Phosphor
- 7.3.3. Semiconductor
- 7.3.4. Lithium-ion (Li-Ion) Batteries
- 7.3.5. Technical Ceramics
- 7.3.6. Other Applications
- 7.1. Market Analysis, Insights and Forecast - by Type
- 8. North America High Purity Alumina Industry Analysis, Insights and Forecast, 2020-2032
- 8.1. Market Analysis, Insights and Forecast - by Type
- 8.1.1. 4N
- 8.1.2. 5N
- 8.1.3. 6N
- 8.2. Market Analysis, Insights and Forecast - by Technology
- 8.2.1. Hydrolysis
- 8.2.2. Hydrochloric Acid Leaching
- 8.3. Market Analysis, Insights and Forecast - by Application
- 8.3.1. LED Lighting
- 8.3.2. Phosphor
- 8.3.3. Semiconductor
- 8.3.4. Lithium-ion (Li-Ion) Batteries
- 8.3.5. Technical Ceramics
- 8.3.6. Other Applications
- 8.1. Market Analysis, Insights and Forecast - by Type
- 9. Europe High Purity Alumina Industry Analysis, Insights and Forecast, 2020-2032
- 9.1. Market Analysis, Insights and Forecast - by Type
- 9.1.1. 4N
- 9.1.2. 5N
- 9.1.3. 6N
- 9.2. Market Analysis, Insights and Forecast - by Technology
- 9.2.1. Hydrolysis
- 9.2.2. Hydrochloric Acid Leaching
- 9.3. Market Analysis, Insights and Forecast - by Application
- 9.3.1. LED Lighting
- 9.3.2. Phosphor
- 9.3.3. Semiconductor
- 9.3.4. Lithium-ion (Li-Ion) Batteries
- 9.3.5. Technical Ceramics
- 9.3.6. Other Applications
- 9.1. Market Analysis, Insights and Forecast - by Type
- 10. South America High Purity Alumina Industry Analysis, Insights and Forecast, 2020-2032
- 10.1. Market Analysis, Insights and Forecast - by Type
- 10.1.1. 4N
- 10.1.2. 5N
- 10.1.3. 6N
- 10.2. Market Analysis, Insights and Forecast - by Technology
- 10.2.1. Hydrolysis
- 10.2.2. Hydrochloric Acid Leaching
- 10.3. Market Analysis, Insights and Forecast - by Application
- 10.3.1. LED Lighting
- 10.3.2. Phosphor
- 10.3.3. Semiconductor
- 10.3.4. Lithium-ion (Li-Ion) Batteries
- 10.3.5. Technical Ceramics
- 10.3.6. Other Applications
- 10.1. Market Analysis, Insights and Forecast - by Type
- 11. Middle East and Africa High Purity Alumina Industry Analysis, Insights and Forecast, 2020-2032
- 11.1. Market Analysis, Insights and Forecast - by Type
- 11.1.1. 4N
- 11.1.2. 5N
- 11.1.3. 6N
- 11.2. Market Analysis, Insights and Forecast - by Technology
- 11.2.1. Hydrolysis
- 11.2.2. Hydrochloric Acid Leaching
- 11.3. Market Analysis, Insights and Forecast - by Application
- 11.3.1. LED Lighting
- 11.3.2. Phosphor
- 11.3.3. Semiconductor
- 11.3.4. Lithium-ion (Li-Ion) Batteries
- 11.3.5. Technical Ceramics
- 11.3.6. Other Applications
- 11.1. Market Analysis, Insights and Forecast - by Type
- 12. Competitive Analysis
- 12.1. Company Profiles
- 12.1.1 Baikowski
- 12.1.1.1. Company Overview
- 12.1.1.2. Products
- 12.1.1.3. Company Financials
- 12.1.1.4. SWOT Analysis
- 12.1.2 Bestry Performance Materials Co Ltd
- 12.1.2.1. Company Overview
- 12.1.2.2. Products
- 12.1.2.3. Company Financials
- 12.1.2.4. SWOT Analysis
- 12.1.3 Hebei Pengda New Material Technology Co Ltd
- 12.1.3.1. Company Overview
- 12.1.3.2. Products
- 12.1.3.3. Company Financials
- 12.1.3.4. SWOT Analysis
- 12.1.4 Honghe Chemical
- 12.1.4.1. Company Overview
- 12.1.4.2. Products
- 12.1.4.3. Company Financials
- 12.1.4.4. SWOT Analysis
- 12.1.5 Nippon Light Metal Co Ltd
- 12.1.5.1. Company Overview
- 12.1.5.2. Products
- 12.1.5.3. Company Financials
- 12.1.5.4. SWOT Analysis
- 12.1.6 Polar Sapphire
- 12.1.6.1. Company Overview
- 12.1.6.2. Products
- 12.1.6.3. Company Financials
- 12.1.6.4. SWOT Analysis
- 12.1.7 Rusal
- 12.1.7.1. Company Overview
- 12.1.7.2. Products
- 12.1.7.3. Company Financials
- 12.1.7.4. SWOT Analysis
- 12.1.8 Sasol (USA) Corporation
- 12.1.8.1. Company Overview
- 12.1.8.2. Products
- 12.1.8.3. Company Financials
- 12.1.8.4. SWOT Analysis
- 12.1.9 Shandong Keheng Crystal Material Technology Co Ltd
- 12.1.9.1. Company Overview
- 12.1.9.2. Products
- 12.1.9.3. Company Financials
- 12.1.9.4. SWOT Analysis
- 12.1.10 Sumitomo Chemical Co Ltd
- 12.1.10.1. Company Overview
- 12.1.10.2. Products
- 12.1.10.3. Company Financials
- 12.1.10.4. SWOT Analysis
- 12.1.11 Wuxi Tuobada Titanium Dioxide Products Co Ltd
- 12.1.11.1. Company Overview
- 12.1.11.2. Products
- 12.1.11.3. Company Financials
- 12.1.11.4. SWOT Analysis
- 12.1.12 Xuancheng Jingrui New Materials Co Ltd*List Not Exhaustive
- 12.1.12.1. Company Overview
- 12.1.12.2. Products
- 12.1.12.3. Company Financials
- 12.1.12.4. SWOT Analysis
- 12.1.1 Baikowski
- 12.2. Market Entropy
- 12.2.1 Company's Key Areas Served
- 12.2.2 Recent Developments
- 12.3. Company Market Share Analysis 2025
- 12.3.1 Top 5 Companies Market Share Analysis
- 12.3.2 Top 3 Companies Market Share Analysis
- 12.4. List of Potential Customers
- 13. Research Methodology
List of Figures
- Figure 1: Global High Purity Alumina Industry Revenue Breakdown (billion, %) by Region 2025 & 2033
- Figure 2: Asia Pacific High Purity Alumina Industry Revenue (billion), by Type 2025 & 2033
- Figure 3: Asia Pacific High Purity Alumina Industry Revenue Share (%), by Type 2025 & 2033
- Figure 4: Asia Pacific High Purity Alumina Industry Revenue (billion), by Technology 2025 & 2033
- Figure 5: Asia Pacific High Purity Alumina Industry Revenue Share (%), by Technology 2025 & 2033
- Figure 6: Asia Pacific High Purity Alumina Industry Revenue (billion), by Application 2025 & 2033
- Figure 7: Asia Pacific High Purity Alumina Industry Revenue Share (%), by Application 2025 & 2033
- Figure 8: Asia Pacific High Purity Alumina Industry Revenue (billion), by Country 2025 & 2033
- Figure 9: Asia Pacific High Purity Alumina Industry Revenue Share (%), by Country 2025 & 2033
- Figure 10: North America High Purity Alumina Industry Revenue (billion), by Type 2025 & 2033
- Figure 11: North America High Purity Alumina Industry Revenue Share (%), by Type 2025 & 2033
- Figure 12: North America High Purity Alumina Industry Revenue (billion), by Technology 2025 & 2033
- Figure 13: North America High Purity Alumina Industry Revenue Share (%), by Technology 2025 & 2033
- Figure 14: North America High Purity Alumina Industry Revenue (billion), by Application 2025 & 2033
- Figure 15: North America High Purity Alumina Industry Revenue Share (%), by Application 2025 & 2033
- Figure 16: North America High Purity Alumina Industry Revenue (billion), by Country 2025 & 2033
- Figure 17: North America High Purity Alumina Industry Revenue Share (%), by Country 2025 & 2033
- Figure 18: Europe High Purity Alumina Industry Revenue (billion), by Type 2025 & 2033
- Figure 19: Europe High Purity Alumina Industry Revenue Share (%), by Type 2025 & 2033
- Figure 20: Europe High Purity Alumina Industry Revenue (billion), by Technology 2025 & 2033
- Figure 21: Europe High Purity Alumina Industry Revenue Share (%), by Technology 2025 & 2033
- Figure 22: Europe High Purity Alumina Industry Revenue (billion), by Application 2025 & 2033
- Figure 23: Europe High Purity Alumina Industry Revenue Share (%), by Application 2025 & 2033
- Figure 24: Europe High Purity Alumina Industry Revenue (billion), by Country 2025 & 2033
- Figure 25: Europe High Purity Alumina Industry Revenue Share (%), by Country 2025 & 2033
- Figure 26: South America High Purity Alumina Industry Revenue (billion), by Type 2025 & 2033
- Figure 27: South America High Purity Alumina Industry Revenue Share (%), by Type 2025 & 2033
- Figure 28: South America High Purity Alumina Industry Revenue (billion), by Technology 2025 & 2033
- Figure 29: South America High Purity Alumina Industry Revenue Share (%), by Technology 2025 & 2033
- Figure 30: South America High Purity Alumina Industry Revenue (billion), by Application 2025 & 2033
- Figure 31: South America High Purity Alumina Industry Revenue Share (%), by Application 2025 & 2033
- Figure 32: South America High Purity Alumina Industry Revenue (billion), by Country 2025 & 2033
- Figure 33: South America High Purity Alumina Industry Revenue Share (%), by Country 2025 & 2033
- Figure 34: Middle East and Africa High Purity Alumina Industry Revenue (billion), by Type 2025 & 2033
- Figure 35: Middle East and Africa High Purity Alumina Industry Revenue Share (%), by Type 2025 & 2033
- Figure 36: Middle East and Africa High Purity Alumina Industry Revenue (billion), by Technology 2025 & 2033
- Figure 37: Middle East and Africa High Purity Alumina Industry Revenue Share (%), by Technology 2025 & 2033
- Figure 38: Middle East and Africa High Purity Alumina Industry Revenue (billion), by Application 2025 & 2033
- Figure 39: Middle East and Africa High Purity Alumina Industry Revenue Share (%), by Application 2025 & 2033
- Figure 40: Middle East and Africa High Purity Alumina Industry Revenue (billion), by Country 2025 & 2033
- Figure 41: Middle East and Africa High Purity Alumina Industry Revenue Share (%), by Country 2025 & 2033
List of Tables
- Table 1: Global High Purity Alumina Industry Revenue billion Forecast, by Type 2020 & 2033
- Table 2: Global High Purity Alumina Industry Revenue billion Forecast, by Technology 2020 & 2033
- Table 3: Global High Purity Alumina Industry Revenue billion Forecast, by Application 2020 & 2033
- Table 4: Global High Purity Alumina Industry Revenue billion Forecast, by Region 2020 & 2033
- Table 5: Global High Purity Alumina Industry Revenue billion Forecast, by Type 2020 & 2033
- Table 6: Global High Purity Alumina Industry Revenue billion Forecast, by Technology 2020 & 2033
- Table 7: Global High Purity Alumina Industry Revenue billion Forecast, by Application 2020 & 2033
- Table 8: Global High Purity Alumina Industry Revenue billion Forecast, by Country 2020 & 2033
- Table 9: China High Purity Alumina Industry Revenue (billion) Forecast, by Application 2020 & 2033
- Table 10: India High Purity Alumina Industry Revenue (billion) Forecast, by Application 2020 & 2033
- Table 11: Japan High Purity Alumina Industry Revenue (billion) Forecast, by Application 2020 & 2033
- Table 12: South Korea High Purity Alumina Industry Revenue (billion) Forecast, by Application 2020 & 2033
- Table 13: Malaysia High Purity Alumina Industry Revenue (billion) Forecast, by Application 2020 & 2033
- Table 14: Thailand High Purity Alumina Industry Revenue (billion) Forecast, by Application 2020 & 2033
- Table 15: Indonesia High Purity Alumina Industry Revenue (billion) Forecast, by Application 2020 & 2033
- Table 16: Vietnam High Purity Alumina Industry Revenue (billion) Forecast, by Application 2020 & 2033
- Table 17: Rest of Asia Pacific High Purity Alumina Industry Revenue (billion) Forecast, by Application 2020 & 2033
- Table 18: Global High Purity Alumina Industry Revenue billion Forecast, by Type 2020 & 2033
- Table 19: Global High Purity Alumina Industry Revenue billion Forecast, by Technology 2020 & 2033
- Table 20: Global High Purity Alumina Industry Revenue billion Forecast, by Application 2020 & 2033
- Table 21: Global High Purity Alumina Industry Revenue billion Forecast, by Country 2020 & 2033
- Table 22: United States High Purity Alumina Industry Revenue (billion) Forecast, by Application 2020 & 2033
- Table 23: Canada High Purity Alumina Industry Revenue (billion) Forecast, by Application 2020 & 2033
- Table 24: Mexico High Purity Alumina Industry Revenue (billion) Forecast, by Application 2020 & 2033
- Table 25: Global High Purity Alumina Industry Revenue billion Forecast, by Type 2020 & 2033
- Table 26: Global High Purity Alumina Industry Revenue billion Forecast, by Technology 2020 & 2033
- Table 27: Global High Purity Alumina Industry Revenue billion Forecast, by Application 2020 & 2033
- Table 28: Global High Purity Alumina Industry Revenue billion Forecast, by Country 2020 & 2033
- Table 29: Germany High Purity Alumina Industry Revenue (billion) Forecast, by Application 2020 & 2033
- Table 30: United Kingdom High Purity Alumina Industry Revenue (billion) Forecast, by Application 2020 & 2033
- Table 31: France High Purity Alumina Industry Revenue (billion) Forecast, by Application 2020 & 2033
- Table 32: Italy High Purity Alumina Industry Revenue (billion) Forecast, by Application 2020 & 2033
- Table 33: Spain High Purity Alumina Industry Revenue (billion) Forecast, by Application 2020 & 2033
- Table 34: NORDIC Countries High Purity Alumina Industry Revenue (billion) Forecast, by Application 2020 & 2033
- Table 35: Turkey High Purity Alumina Industry Revenue (billion) Forecast, by Application 2020 & 2033
- Table 36: Russia High Purity Alumina Industry Revenue (billion) Forecast, by Application 2020 & 2033
- Table 37: Rest of Europe High Purity Alumina Industry Revenue (billion) Forecast, by Application 2020 & 2033
- Table 38: Global High Purity Alumina Industry Revenue billion Forecast, by Type 2020 & 2033
- Table 39: Global High Purity Alumina Industry Revenue billion Forecast, by Technology 2020 & 2033
- Table 40: Global High Purity Alumina Industry Revenue billion Forecast, by Application 2020 & 2033
- Table 41: Global High Purity Alumina Industry Revenue billion Forecast, by Country 2020 & 2033
- Table 42: Brazil High Purity Alumina Industry Revenue (billion) Forecast, by Application 2020 & 2033
- Table 43: Argentina High Purity Alumina Industry Revenue (billion) Forecast, by Application 2020 & 2033
- Table 44: Colombia High Purity Alumina Industry Revenue (billion) Forecast, by Application 2020 & 2033
- Table 45: Rest of South America High Purity Alumina Industry Revenue (billion) Forecast, by Application 2020 & 2033
- Table 46: Global High Purity Alumina Industry Revenue billion Forecast, by Type 2020 & 2033
- Table 47: Global High Purity Alumina Industry Revenue billion Forecast, by Technology 2020 & 2033
- Table 48: Global High Purity Alumina Industry Revenue billion Forecast, by Application 2020 & 2033
- Table 49: Global High Purity Alumina Industry Revenue billion Forecast, by Country 2020 & 2033
- Table 50: Saudi Arabia High Purity Alumina Industry Revenue (billion) Forecast, by Application 2020 & 2033
- Table 51: Qatar High Purity Alumina Industry Revenue (billion) Forecast, by Application 2020 & 2033
- Table 52: United Arab Emirates High Purity Alumina Industry Revenue (billion) Forecast, by Application 2020 & 2033
- Table 53: Nigeria High Purity Alumina Industry Revenue (billion) Forecast, by Application 2020 & 2033
- Table 54: Egypt High Purity Alumina Industry Revenue (billion) Forecast, by Application 2020 & 2033
- Table 55: South Africa High Purity Alumina Industry Revenue (billion) Forecast, by Application 2020 & 2033
- Table 56: Rest of Middle East and Africa High Purity Alumina Industry Revenue (billion) Forecast, by Application 2020 & 2033
Frequently Asked Questions
1. What is the projected Compound Annual Growth Rate (CAGR) of the High Purity Alumina Industry?
The projected CAGR is approximately 20.62%.
2. Which companies are prominent players in the High Purity Alumina Industry?
Key companies in the market include Baikowski, Bestry Performance Materials Co Ltd, Hebei Pengda New Material Technology Co Ltd, Honghe Chemical, Nippon Light Metal Co Ltd, Polar Sapphire, Rusal, Sasol (USA) Corporation, Shandong Keheng Crystal Material Technology Co Ltd, Sumitomo Chemical Co Ltd, Wuxi Tuobada Titanium Dioxide Products Co Ltd, Xuancheng Jingrui New Materials Co Ltd*List Not Exhaustive.
3. What are the main segments of the High Purity Alumina Industry?
The market segments include Type, Technology, Application.
4. Can you provide details about the market size?
The market size is estimated to be USD 0.57 billion as of 2022.
5. What are some drivers contributing to market growth?
Increasing Demand for LED-based Lighting; Demand from Lithium-ion Battery Markets.
6. What are the notable trends driving market growth?
The LED Lighting Segment is Expected to Dominate the Market.
7. Are there any restraints impacting market growth?
Increasing Demand for LED-based Lighting; Demand from Lithium-ion Battery Markets.
8. Can you provide examples of recent developments in the market?
August 2023: Sumitomo Chemical introduced a new technology for the production of ultra-fine α-alumina, which was set to start in September 2023. Alumina materials that are made by calcining aluminum hydroxide at high temperatures have a purity of around 99.99% or more. They are called ultra-high purity alumina.
9. What pricing options are available for accessing the report?
Pricing options include single-user, multi-user, and enterprise licenses priced at USD 4750, USD 5250, and USD 8750 respectively.
10. Is the market size provided in terms of value or volume?
The market size is provided in terms of value, measured in billion.
11. Are there any specific market keywords associated with the report?
Yes, the market keyword associated with the report is "High Purity Alumina Industry," which aids in identifying and referencing the specific market segment covered.
12. How do I determine which pricing option suits my needs best?
The pricing options vary based on user requirements and access needs. Individual users may opt for single-user licenses, while businesses requiring broader access may choose multi-user or enterprise licenses for cost-effective access to the report.
13. Are there any additional resources or data provided in the High Purity Alumina Industry report?
While the report offers comprehensive insights, it's advisable to review the specific contents or supplementary materials provided to ascertain if additional resources or data are available.
14. How can I stay updated on further developments or reports in the High Purity Alumina Industry?
To stay informed about further developments, trends, and reports in the High Purity Alumina Industry, consider subscribing to industry newsletters, following relevant companies and organizations, or regularly checking reputable industry news sources and publications.
Methodology
Step 1 - Identification of Relevant Samples Size from Population Database


Step 2 - Approaches for Defining Global Market Size (Value, Volume* & Price*)

Note*: In applicable scenarios
Step 3 - Data Sources
Primary Research
- Web Analytics
- Survey Reports
- Research Institute
- Latest Research Reports
- Opinion Leaders
Secondary Research
- Annual Reports
- White Paper
- Latest Press Release
- Industry Association
- Paid Database
- Investor Presentations

Step 4 - Data Triangulation
Involves using different sources of information in order to increase the validity of a study
These sources are likely to be stakeholders in a program - participants, other researchers, program staff, other community members, and so on.
Then we put all data in single framework & apply various statistical tools to find out the dynamic on the market.
During the analysis stage, feedback from the stakeholder groups would be compared to determine areas of agreement as well as areas of divergence