

Key Insights
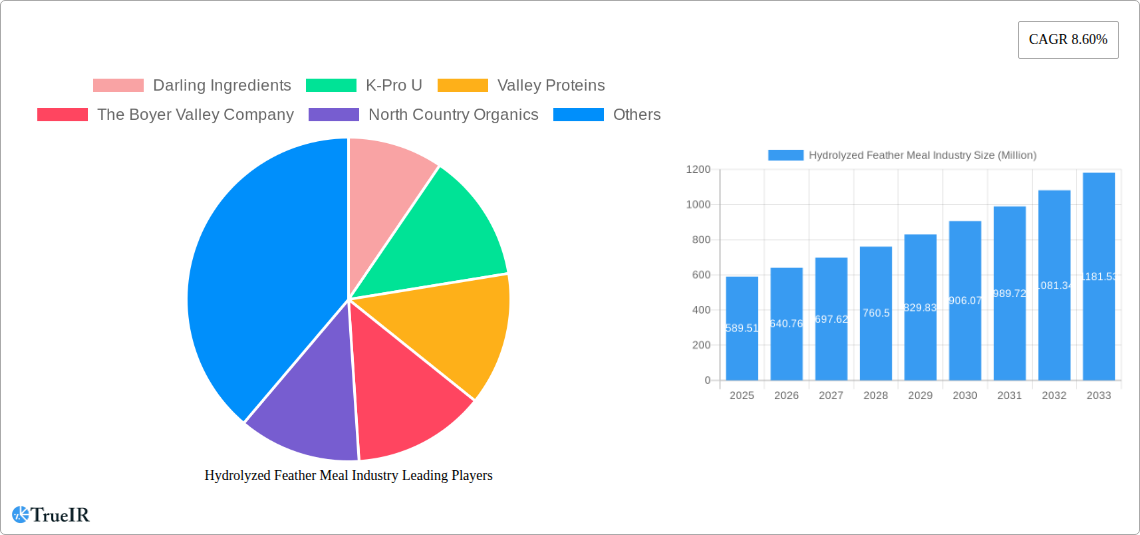
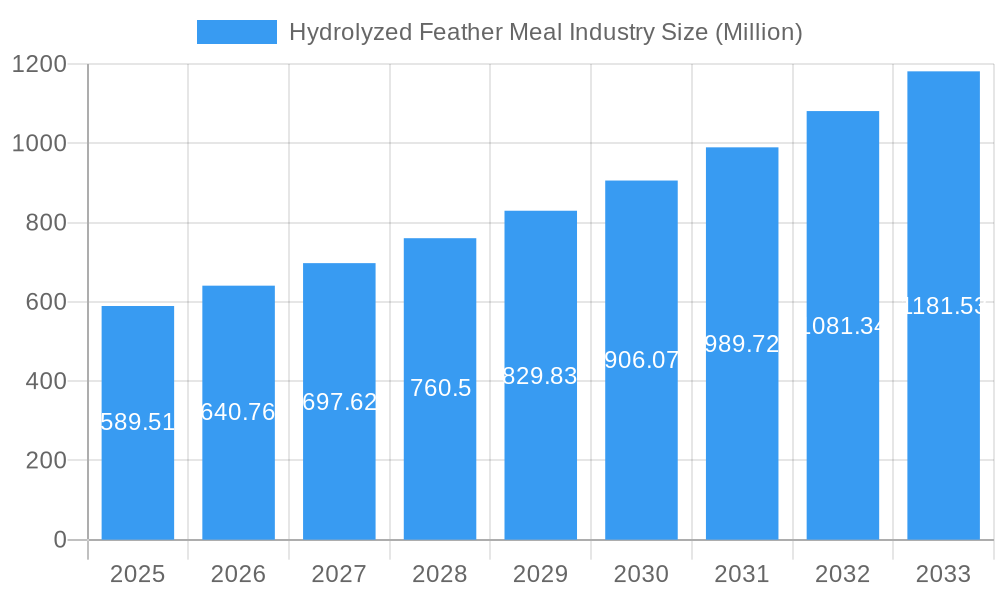
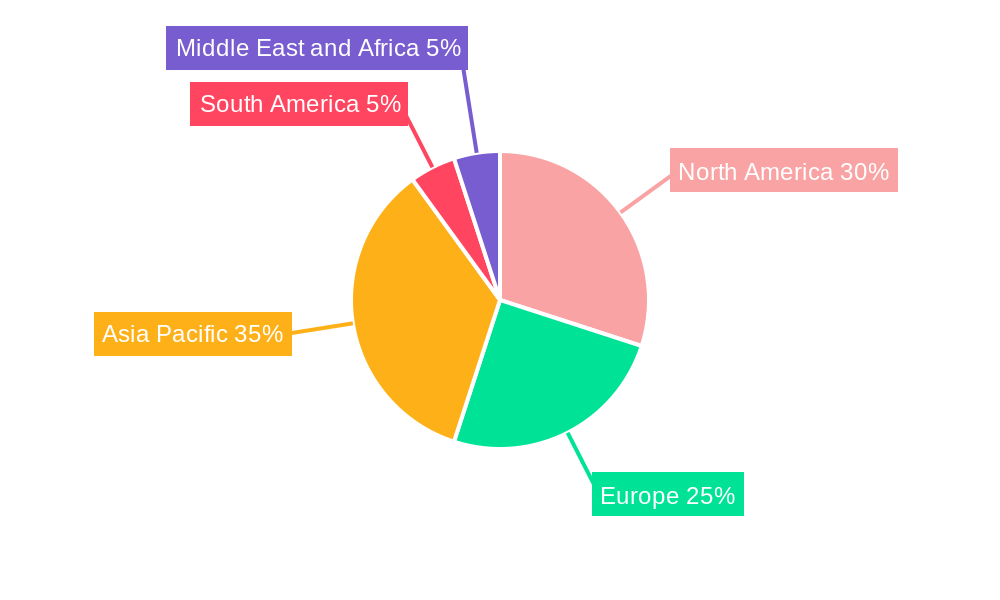
The global hydrolyzed feather meal market, valued at $589.51 million in 2025, is projected to experience robust growth, driven by increasing demand from the animal feed and agrochemical sectors. This growth is fueled by several key factors. The rising global population necessitates increased protein sources for animal feed, making hydrolyzed feather meal an attractive, sustainable, and cost-effective alternative to traditional protein sources. Furthermore, its use in agrochemicals as a natural fertilizer contributes to the growing demand for environmentally friendly agricultural practices. The organic segment within the hydrolyzed feather meal market is experiencing particularly strong growth, reflecting the increasing consumer preference for organically produced food and feed. While challenges exist, such as regulatory hurdles and potential inconsistencies in product quality across different manufacturers, the market is poised for significant expansion. Technological advancements leading to improved hydrolysis processes are also contributing to higher quality products and broader market acceptance. Competitive dynamics are shaped by a mix of established players and emerging businesses, leading to innovation and the introduction of new value-added products. The geographical distribution of market share is expected to see continued growth in regions with large agricultural sectors and increasing demand for animal protein, particularly in Asia-Pacific and North America.
Hydrolyzed Feather Meal Industry Market Size (In Million)
The forecast period (2025-2033) anticipates a substantial increase in market size, primarily due to the consistent CAGR of 8.60%. This growth is expected to be relatively uniform across the major application segments, with animal feed maintaining its dominance due to the sheer scale of the global livestock industry. Regional variations in growth rates will be influenced by factors such as government policies promoting sustainable agriculture, the level of investment in the animal feed sector, and the rate of adoption of organic farming practices. Overall, the hydrolyzed feather meal market offers a compelling investment opportunity, benefiting from a confluence of positive trends in the agricultural and food processing industries.
Hydrolyzed Feather Meal Industry Company Market Share
Hydrolyzed Feather Meal Industry Market Report: 2019-2033
This comprehensive report provides a detailed analysis of the global hydrolyzed feather meal industry, covering market size, segmentation, competitive landscape, growth drivers, challenges, and future outlook. The study period spans from 2019 to 2033, with 2025 serving as both the base and estimated year. This report is crucial for businesses, investors, and researchers seeking to understand this dynamic and growing market.
Hydrolyzed Feather Meal Industry Market Structure & Competitive Landscape
The hydrolyzed feather meal industry is moderately concentrated, with key players like Darling Ingredients, K-Pro U, Valley Proteins, The Boyer Valley Company, North Country Organics, JG Pears, Kleingarn Agrarprodukte, and FASA Group holding significant market share. The exact concentration ratio (e.g., CR4 or CR8) for 2025 is estimated at xx%, indicating a moderately competitive landscape. Innovation drives market growth, focusing on improving efficiency and sustainability of the production process and expanding applications beyond animal feed. Regulatory impacts vary by region, impacting production costs and market access. Product substitutes, such as other protein sources, present competitive pressure, requiring continuous product differentiation and cost optimization. The industry witnesses sporadic M&A activity, with xx mergers and acquisitions recorded between 2019 and 2024, primarily driven by expansion strategies and vertical integration. End-user segmentation is predominantly focused on animal feed, with growing demand from the aquaculture and pet food sectors.
Hydrolyzed Feather Meal Industry Market Trends & Opportunities
The global hydrolyzed feather meal market is experiencing substantial growth, with a projected Compound Annual Growth Rate (CAGR) of xx% during the forecast period (2025-2033). Market size in 2025 is estimated at $xx Million, and is projected to reach $xx Million by 2033. Technological advancements are driving improvements in hydrolysis efficiency, reducing production costs and enhancing product quality. Consumer preferences for sustainable and environmentally friendly feed options are creating new opportunities. Increased awareness of the potential benefits of hydrolyzed feather meal as a cost-effective protein source in animal feed is boosting market penetration rates. Competitive dynamics are shaped by innovation, pricing strategies, and geographic expansion.
Dominant Markets & Segments in Hydrolyzed Feather Meal Industry
The animal feed application segment dominates the hydrolyzed feather meal market, accounting for approximately xx% of the total market value in 2025. The conventional type segment holds the largest market share, followed by the organic segment. Geographically, North America is currently the dominant market, driven by large-scale poultry production and established supply chains.
Key Growth Drivers in Animal Feed Application:
- Growing demand for cost-effective protein sources in animal feed.
- Increasing poultry and livestock production globally.
- Stringent regulations on the use of antibiotics and other additives in animal feed.
Key Growth Drivers in North America:
- High concentration of poultry and livestock farms.
- Well-established infrastructure and logistics networks.
- Supportive government policies and regulations.
The organic segment is witnessing the fastest growth, driven by increasing consumer awareness of sustainable and environmentally friendly products. Asia-Pacific is also exhibiting strong growth potential, owing to the expanding livestock industry and increasing adoption of sustainable agricultural practices.
Hydrolyzed Feather Meal Industry Product Analysis
Product innovations in hydrolyzed feather meal focus on enhancing protein digestibility, reducing odor, and improving overall product quality. Advancements in hydrolysis technologies are leading to more efficient and sustainable production processes. The key competitive advantages lie in consistent product quality, cost-effectiveness, and environmental sustainability. The increasing demand for high-quality protein sources in animal feed and other applications is driving the development of specialized products tailored to specific needs.
Key Drivers, Barriers & Challenges in Hydrolyzed Feather Meal Industry
Key Drivers: Growing demand for sustainable and cost-effective protein sources for animal feed, increasing awareness of environmental benefits (reducing poultry feather waste), and technological advancements in hydrolysis processes are major drivers.
Key Barriers and Challenges: Fluctuations in raw material availability (poultry feathers), stringent regulatory requirements concerning product safety and environmental impact, and competition from alternative protein sources (soybean meal, fishmeal) pose significant challenges. The cost of setting up advanced hydrolysis units also limits the widespread growth of the industry. Supply chain disruptions can significantly impact production and pricing.
Growth Drivers in the Hydrolyzed Feather Meal Industry Market
The increasing demand for sustainable and cost-effective protein sources in animal feed is a major growth driver. Technological advancements are improving the quality and efficiency of the production process, making hydrolyzed feather meal a more attractive option. Favorable government regulations and incentives promoting the use of sustainable alternatives in agriculture also contribute to growth.
Challenges Impacting Hydrolyzed Feather Meal Industry Growth
Challenges include the inconsistent supply of raw materials (poultry feathers), stringent regulatory requirements concerning food safety, and competition from other protein sources. Furthermore, the perception of odor associated with the product can create challenges in market acceptance and adoption, although technologies are helping to mitigate this issue.
Key Players Shaping the Hydrolyzed Feather Meal Industry Market
- Darling Ingredients
- K-Pro U
- Valley Proteins
- The Boyer Valley Company
- North Country Organics
- JG Pears
- Kleingarn Agrarprodukte
- FASA Group
Significant Hydrolyzed Feather Meal Industry Industry Milestones
- September 2021: Indian scientists developed a new hydrodynamic sustainable, affordable technique to turn poultry feathers & animal hair into fertilizer. This development significantly enhanced the potential applications of hydrolyzed feather meal and boosted its sustainability profile.
- August 2022: The University of Danang - University of Science and Technology successfully created a bio-organic fertilizer from chicken feathers. This highlights the expanding applications of this byproduct and reinforces the environmental benefits of its utilization.
Future Outlook for Hydrolyzed Feather Meal Industry Market
The hydrolyzed feather meal market is poised for continued growth, driven by rising demand for sustainable protein sources, advancements in hydrolysis technology, and the expansion of applications beyond animal feed. Strategic partnerships and investments in research and development will further propel market expansion. The focus on sustainable and environmentally friendly practices will create significant growth opportunities for companies that can successfully meet the evolving needs of the market.
Hydrolyzed Feather Meal Industry Segmentation
- 1. Production Analysis
- 2. Consumption Analysis
- 3. Import Market Analysis (Value & Volume)
- 4. Export Market Analysis (Value & Volume)
- 5. Price Trend Analysis
Hydrolyzed Feather Meal Industry Segmentation By Geography
-
1. North America
- 1.1. United States
- 1.2. Canada
- 1.3. Mexico
-
2. South America
- 2.1. Brazil
- 2.2. Argentina
- 2.3. Rest of South America
-
3. Europe
- 3.1. United Kingdom
- 3.2. Germany
- 3.3. France
- 3.4. Italy
- 3.5. Spain
- 3.6. Russia
- 3.7. Benelux
- 3.8. Nordics
- 3.9. Rest of Europe
-
4. Middle East & Africa
- 4.1. Turkey
- 4.2. Israel
- 4.3. GCC
- 4.4. North Africa
- 4.5. South Africa
- 4.6. Rest of Middle East & Africa
-
5. Asia Pacific
- 5.1. China
- 5.2. India
- 5.3. Japan
- 5.4. South Korea
- 5.5. ASEAN
- 5.6. Oceania
- 5.7. Rest of Asia Pacific
Hydrolyzed Feather Meal Industry Regional Market Share
Geographic Coverage of Hydrolyzed Feather Meal Industry
Hydrolyzed Feather Meal Industry REPORT HIGHLIGHTS
| Aspects | Details |
|---|---|
| Study Period | 2020-2034 |
| Base Year | 2025 |
| Estimated Year | 2026 |
| Forecast Period | 2026-2034 |
| Historical Period | 2020-2025 |
| Growth Rate | CAGR of 8.60% from 2020-2034 |
| Segmentation |
|
Table of Contents
- 1. Introduction
- 1.1. Research Scope
- 1.2. Market Segmentation
- 1.3. Research Methodology
- 1.4. Definitions and Assumptions
- 2. Executive Summary
- 2.1. Introduction
- 3. Market Dynamics
- 3.1. Introduction
- 3.2. Market Drivers
- 3.2.1. Adoption of Organic and Eco-friendly Farming Practices; Declining Area of Arable Land and Rising Food Security Concerns
- 3.3. Market Restrains
- 3.3.1. High Demand for Conventional and Synthetic Products; Lack of Awareness and Other Factors Limiting the Adoption of Agricultural Inoculants
- 3.4. Market Trends
- 3.4.1. Increasing demand for organic farming accelerating feather meal market
- 4. Market Factor Analysis
- 4.1. Porters Five Forces
- 4.2. Supply/Value Chain
- 4.3. PESTEL analysis
- 4.4. Market Entropy
- 4.5. Patent/Trademark Analysis
- 5. Global Hydrolyzed Feather Meal Industry Analysis, Insights and Forecast, 2020-2032
- 5.1. Market Analysis, Insights and Forecast - by Production Analysis
- 5.2. Market Analysis, Insights and Forecast - by Consumption Analysis
- 5.3. Market Analysis, Insights and Forecast - by Import Market Analysis (Value & Volume)
- 5.4. Market Analysis, Insights and Forecast - by Export Market Analysis (Value & Volume)
- 5.5. Market Analysis, Insights and Forecast - by Price Trend Analysis
- 5.6. Market Analysis, Insights and Forecast - by Region
- 5.6.1. North America
- 5.6.2. South America
- 5.6.3. Europe
- 5.6.4. Middle East & Africa
- 5.6.5. Asia Pacific
- 5.1. Market Analysis, Insights and Forecast - by Production Analysis
- 6. North America Hydrolyzed Feather Meal Industry Analysis, Insights and Forecast, 2020-2032
- 6.1. Market Analysis, Insights and Forecast - by Production Analysis
- 6.2. Market Analysis, Insights and Forecast - by Consumption Analysis
- 6.3. Market Analysis, Insights and Forecast - by Import Market Analysis (Value & Volume)
- 6.4. Market Analysis, Insights and Forecast - by Export Market Analysis (Value & Volume)
- 6.5. Market Analysis, Insights and Forecast - by Price Trend Analysis
- 6.1. Market Analysis, Insights and Forecast - by Production Analysis
- 7. South America Hydrolyzed Feather Meal Industry Analysis, Insights and Forecast, 2020-2032
- 7.1. Market Analysis, Insights and Forecast - by Production Analysis
- 7.2. Market Analysis, Insights and Forecast - by Consumption Analysis
- 7.3. Market Analysis, Insights and Forecast - by Import Market Analysis (Value & Volume)
- 7.4. Market Analysis, Insights and Forecast - by Export Market Analysis (Value & Volume)
- 7.5. Market Analysis, Insights and Forecast - by Price Trend Analysis
- 7.1. Market Analysis, Insights and Forecast - by Production Analysis
- 8. Europe Hydrolyzed Feather Meal Industry Analysis, Insights and Forecast, 2020-2032
- 8.1. Market Analysis, Insights and Forecast - by Production Analysis
- 8.2. Market Analysis, Insights and Forecast - by Consumption Analysis
- 8.3. Market Analysis, Insights and Forecast - by Import Market Analysis (Value & Volume)
- 8.4. Market Analysis, Insights and Forecast - by Export Market Analysis (Value & Volume)
- 8.5. Market Analysis, Insights and Forecast - by Price Trend Analysis
- 8.1. Market Analysis, Insights and Forecast - by Production Analysis
- 9. Middle East & Africa Hydrolyzed Feather Meal Industry Analysis, Insights and Forecast, 2020-2032
- 9.1. Market Analysis, Insights and Forecast - by Production Analysis
- 9.2. Market Analysis, Insights and Forecast - by Consumption Analysis
- 9.3. Market Analysis, Insights and Forecast - by Import Market Analysis (Value & Volume)
- 9.4. Market Analysis, Insights and Forecast - by Export Market Analysis (Value & Volume)
- 9.5. Market Analysis, Insights and Forecast - by Price Trend Analysis
- 9.1. Market Analysis, Insights and Forecast - by Production Analysis
- 10. Asia Pacific Hydrolyzed Feather Meal Industry Analysis, Insights and Forecast, 2020-2032
- 10.1. Market Analysis, Insights and Forecast - by Production Analysis
- 10.2. Market Analysis, Insights and Forecast - by Consumption Analysis
- 10.3. Market Analysis, Insights and Forecast - by Import Market Analysis (Value & Volume)
- 10.4. Market Analysis, Insights and Forecast - by Export Market Analysis (Value & Volume)
- 10.5. Market Analysis, Insights and Forecast - by Price Trend Analysis
- 10.1. Market Analysis, Insights and Forecast - by Production Analysis
- 11. Competitive Analysis
- 11.1. Global Market Share Analysis 2025
- 11.2. Company Profiles
- 11.2.1 Darling Ingredients
- 11.2.1.1. Overview
- 11.2.1.2. Products
- 11.2.1.3. SWOT Analysis
- 11.2.1.4. Recent Developments
- 11.2.1.5. Financials (Based on Availability)
- 11.2.2 K-Pro U
- 11.2.2.1. Overview
- 11.2.2.2. Products
- 11.2.2.3. SWOT Analysis
- 11.2.2.4. Recent Developments
- 11.2.2.5. Financials (Based on Availability)
- 11.2.3 Valley Proteins
- 11.2.3.1. Overview
- 11.2.3.2. Products
- 11.2.3.3. SWOT Analysis
- 11.2.3.4. Recent Developments
- 11.2.3.5. Financials (Based on Availability)
- 11.2.4 The Boyer Valley Company
- 11.2.4.1. Overview
- 11.2.4.2. Products
- 11.2.4.3. SWOT Analysis
- 11.2.4.4. Recent Developments
- 11.2.4.5. Financials (Based on Availability)
- 11.2.5 North Country Organics
- 11.2.5.1. Overview
- 11.2.5.2. Products
- 11.2.5.3. SWOT Analysis
- 11.2.5.4. Recent Developments
- 11.2.5.5. Financials (Based on Availability)
- 11.2.6 JG Pears
- 11.2.6.1. Overview
- 11.2.6.2. Products
- 11.2.6.3. SWOT Analysis
- 11.2.6.4. Recent Developments
- 11.2.6.5. Financials (Based on Availability)
- 11.2.7 Kleingarn Agrarprodukte
- 11.2.7.1. Overview
- 11.2.7.2. Products
- 11.2.7.3. SWOT Analysis
- 11.2.7.4. Recent Developments
- 11.2.7.5. Financials (Based on Availability)
- 11.2.8 FASA Group
- 11.2.8.1. Overview
- 11.2.8.2. Products
- 11.2.8.3. SWOT Analysis
- 11.2.8.4. Recent Developments
- 11.2.8.5. Financials (Based on Availability)
- 11.2.1 Darling Ingredients
List of Figures
- Figure 1: Global Hydrolyzed Feather Meal Industry Revenue Breakdown (Million, %) by Region 2025 & 2033
- Figure 2: North America Hydrolyzed Feather Meal Industry Revenue (Million), by Production Analysis 2025 & 2033
- Figure 3: North America Hydrolyzed Feather Meal Industry Revenue Share (%), by Production Analysis 2025 & 2033
- Figure 4: North America Hydrolyzed Feather Meal Industry Revenue (Million), by Consumption Analysis 2025 & 2033
- Figure 5: North America Hydrolyzed Feather Meal Industry Revenue Share (%), by Consumption Analysis 2025 & 2033
- Figure 6: North America Hydrolyzed Feather Meal Industry Revenue (Million), by Import Market Analysis (Value & Volume) 2025 & 2033
- Figure 7: North America Hydrolyzed Feather Meal Industry Revenue Share (%), by Import Market Analysis (Value & Volume) 2025 & 2033
- Figure 8: North America Hydrolyzed Feather Meal Industry Revenue (Million), by Export Market Analysis (Value & Volume) 2025 & 2033
- Figure 9: North America Hydrolyzed Feather Meal Industry Revenue Share (%), by Export Market Analysis (Value & Volume) 2025 & 2033
- Figure 10: North America Hydrolyzed Feather Meal Industry Revenue (Million), by Price Trend Analysis 2025 & 2033
- Figure 11: North America Hydrolyzed Feather Meal Industry Revenue Share (%), by Price Trend Analysis 2025 & 2033
- Figure 12: North America Hydrolyzed Feather Meal Industry Revenue (Million), by Country 2025 & 2033
- Figure 13: North America Hydrolyzed Feather Meal Industry Revenue Share (%), by Country 2025 & 2033
- Figure 14: South America Hydrolyzed Feather Meal Industry Revenue (Million), by Production Analysis 2025 & 2033
- Figure 15: South America Hydrolyzed Feather Meal Industry Revenue Share (%), by Production Analysis 2025 & 2033
- Figure 16: South America Hydrolyzed Feather Meal Industry Revenue (Million), by Consumption Analysis 2025 & 2033
- Figure 17: South America Hydrolyzed Feather Meal Industry Revenue Share (%), by Consumption Analysis 2025 & 2033
- Figure 18: South America Hydrolyzed Feather Meal Industry Revenue (Million), by Import Market Analysis (Value & Volume) 2025 & 2033
- Figure 19: South America Hydrolyzed Feather Meal Industry Revenue Share (%), by Import Market Analysis (Value & Volume) 2025 & 2033
- Figure 20: South America Hydrolyzed Feather Meal Industry Revenue (Million), by Export Market Analysis (Value & Volume) 2025 & 2033
- Figure 21: South America Hydrolyzed Feather Meal Industry Revenue Share (%), by Export Market Analysis (Value & Volume) 2025 & 2033
- Figure 22: South America Hydrolyzed Feather Meal Industry Revenue (Million), by Price Trend Analysis 2025 & 2033
- Figure 23: South America Hydrolyzed Feather Meal Industry Revenue Share (%), by Price Trend Analysis 2025 & 2033
- Figure 24: South America Hydrolyzed Feather Meal Industry Revenue (Million), by Country 2025 & 2033
- Figure 25: South America Hydrolyzed Feather Meal Industry Revenue Share (%), by Country 2025 & 2033
- Figure 26: Europe Hydrolyzed Feather Meal Industry Revenue (Million), by Production Analysis 2025 & 2033
- Figure 27: Europe Hydrolyzed Feather Meal Industry Revenue Share (%), by Production Analysis 2025 & 2033
- Figure 28: Europe Hydrolyzed Feather Meal Industry Revenue (Million), by Consumption Analysis 2025 & 2033
- Figure 29: Europe Hydrolyzed Feather Meal Industry Revenue Share (%), by Consumption Analysis 2025 & 2033
- Figure 30: Europe Hydrolyzed Feather Meal Industry Revenue (Million), by Import Market Analysis (Value & Volume) 2025 & 2033
- Figure 31: Europe Hydrolyzed Feather Meal Industry Revenue Share (%), by Import Market Analysis (Value & Volume) 2025 & 2033
- Figure 32: Europe Hydrolyzed Feather Meal Industry Revenue (Million), by Export Market Analysis (Value & Volume) 2025 & 2033
- Figure 33: Europe Hydrolyzed Feather Meal Industry Revenue Share (%), by Export Market Analysis (Value & Volume) 2025 & 2033
- Figure 34: Europe Hydrolyzed Feather Meal Industry Revenue (Million), by Price Trend Analysis 2025 & 2033
- Figure 35: Europe Hydrolyzed Feather Meal Industry Revenue Share (%), by Price Trend Analysis 2025 & 2033
- Figure 36: Europe Hydrolyzed Feather Meal Industry Revenue (Million), by Country 2025 & 2033
- Figure 37: Europe Hydrolyzed Feather Meal Industry Revenue Share (%), by Country 2025 & 2033
- Figure 38: Middle East & Africa Hydrolyzed Feather Meal Industry Revenue (Million), by Production Analysis 2025 & 2033
- Figure 39: Middle East & Africa Hydrolyzed Feather Meal Industry Revenue Share (%), by Production Analysis 2025 & 2033
- Figure 40: Middle East & Africa Hydrolyzed Feather Meal Industry Revenue (Million), by Consumption Analysis 2025 & 2033
- Figure 41: Middle East & Africa Hydrolyzed Feather Meal Industry Revenue Share (%), by Consumption Analysis 2025 & 2033
- Figure 42: Middle East & Africa Hydrolyzed Feather Meal Industry Revenue (Million), by Import Market Analysis (Value & Volume) 2025 & 2033
- Figure 43: Middle East & Africa Hydrolyzed Feather Meal Industry Revenue Share (%), by Import Market Analysis (Value & Volume) 2025 & 2033
- Figure 44: Middle East & Africa Hydrolyzed Feather Meal Industry Revenue (Million), by Export Market Analysis (Value & Volume) 2025 & 2033
- Figure 45: Middle East & Africa Hydrolyzed Feather Meal Industry Revenue Share (%), by Export Market Analysis (Value & Volume) 2025 & 2033
- Figure 46: Middle East & Africa Hydrolyzed Feather Meal Industry Revenue (Million), by Price Trend Analysis 2025 & 2033
- Figure 47: Middle East & Africa Hydrolyzed Feather Meal Industry Revenue Share (%), by Price Trend Analysis 2025 & 2033
- Figure 48: Middle East & Africa Hydrolyzed Feather Meal Industry Revenue (Million), by Country 2025 & 2033
- Figure 49: Middle East & Africa Hydrolyzed Feather Meal Industry Revenue Share (%), by Country 2025 & 2033
- Figure 50: Asia Pacific Hydrolyzed Feather Meal Industry Revenue (Million), by Production Analysis 2025 & 2033
- Figure 51: Asia Pacific Hydrolyzed Feather Meal Industry Revenue Share (%), by Production Analysis 2025 & 2033
- Figure 52: Asia Pacific Hydrolyzed Feather Meal Industry Revenue (Million), by Consumption Analysis 2025 & 2033
- Figure 53: Asia Pacific Hydrolyzed Feather Meal Industry Revenue Share (%), by Consumption Analysis 2025 & 2033
- Figure 54: Asia Pacific Hydrolyzed Feather Meal Industry Revenue (Million), by Import Market Analysis (Value & Volume) 2025 & 2033
- Figure 55: Asia Pacific Hydrolyzed Feather Meal Industry Revenue Share (%), by Import Market Analysis (Value & Volume) 2025 & 2033
- Figure 56: Asia Pacific Hydrolyzed Feather Meal Industry Revenue (Million), by Export Market Analysis (Value & Volume) 2025 & 2033
- Figure 57: Asia Pacific Hydrolyzed Feather Meal Industry Revenue Share (%), by Export Market Analysis (Value & Volume) 2025 & 2033
- Figure 58: Asia Pacific Hydrolyzed Feather Meal Industry Revenue (Million), by Price Trend Analysis 2025 & 2033
- Figure 59: Asia Pacific Hydrolyzed Feather Meal Industry Revenue Share (%), by Price Trend Analysis 2025 & 2033
- Figure 60: Asia Pacific Hydrolyzed Feather Meal Industry Revenue (Million), by Country 2025 & 2033
- Figure 61: Asia Pacific Hydrolyzed Feather Meal Industry Revenue Share (%), by Country 2025 & 2033
List of Tables
- Table 1: Global Hydrolyzed Feather Meal Industry Revenue Million Forecast, by Production Analysis 2020 & 2033
- Table 2: Global Hydrolyzed Feather Meal Industry Revenue Million Forecast, by Consumption Analysis 2020 & 2033
- Table 3: Global Hydrolyzed Feather Meal Industry Revenue Million Forecast, by Import Market Analysis (Value & Volume) 2020 & 2033
- Table 4: Global Hydrolyzed Feather Meal Industry Revenue Million Forecast, by Export Market Analysis (Value & Volume) 2020 & 2033
- Table 5: Global Hydrolyzed Feather Meal Industry Revenue Million Forecast, by Price Trend Analysis 2020 & 2033
- Table 6: Global Hydrolyzed Feather Meal Industry Revenue Million Forecast, by Region 2020 & 2033
- Table 7: Global Hydrolyzed Feather Meal Industry Revenue Million Forecast, by Production Analysis 2020 & 2033
- Table 8: Global Hydrolyzed Feather Meal Industry Revenue Million Forecast, by Consumption Analysis 2020 & 2033
- Table 9: Global Hydrolyzed Feather Meal Industry Revenue Million Forecast, by Import Market Analysis (Value & Volume) 2020 & 2033
- Table 10: Global Hydrolyzed Feather Meal Industry Revenue Million Forecast, by Export Market Analysis (Value & Volume) 2020 & 2033
- Table 11: Global Hydrolyzed Feather Meal Industry Revenue Million Forecast, by Price Trend Analysis 2020 & 2033
- Table 12: Global Hydrolyzed Feather Meal Industry Revenue Million Forecast, by Country 2020 & 2033
- Table 13: United States Hydrolyzed Feather Meal Industry Revenue (Million) Forecast, by Application 2020 & 2033
- Table 14: Canada Hydrolyzed Feather Meal Industry Revenue (Million) Forecast, by Application 2020 & 2033
- Table 15: Mexico Hydrolyzed Feather Meal Industry Revenue (Million) Forecast, by Application 2020 & 2033
- Table 16: Global Hydrolyzed Feather Meal Industry Revenue Million Forecast, by Production Analysis 2020 & 2033
- Table 17: Global Hydrolyzed Feather Meal Industry Revenue Million Forecast, by Consumption Analysis 2020 & 2033
- Table 18: Global Hydrolyzed Feather Meal Industry Revenue Million Forecast, by Import Market Analysis (Value & Volume) 2020 & 2033
- Table 19: Global Hydrolyzed Feather Meal Industry Revenue Million Forecast, by Export Market Analysis (Value & Volume) 2020 & 2033
- Table 20: Global Hydrolyzed Feather Meal Industry Revenue Million Forecast, by Price Trend Analysis 2020 & 2033
- Table 21: Global Hydrolyzed Feather Meal Industry Revenue Million Forecast, by Country 2020 & 2033
- Table 22: Brazil Hydrolyzed Feather Meal Industry Revenue (Million) Forecast, by Application 2020 & 2033
- Table 23: Argentina Hydrolyzed Feather Meal Industry Revenue (Million) Forecast, by Application 2020 & 2033
- Table 24: Rest of South America Hydrolyzed Feather Meal Industry Revenue (Million) Forecast, by Application 2020 & 2033
- Table 25: Global Hydrolyzed Feather Meal Industry Revenue Million Forecast, by Production Analysis 2020 & 2033
- Table 26: Global Hydrolyzed Feather Meal Industry Revenue Million Forecast, by Consumption Analysis 2020 & 2033
- Table 27: Global Hydrolyzed Feather Meal Industry Revenue Million Forecast, by Import Market Analysis (Value & Volume) 2020 & 2033
- Table 28: Global Hydrolyzed Feather Meal Industry Revenue Million Forecast, by Export Market Analysis (Value & Volume) 2020 & 2033
- Table 29: Global Hydrolyzed Feather Meal Industry Revenue Million Forecast, by Price Trend Analysis 2020 & 2033
- Table 30: Global Hydrolyzed Feather Meal Industry Revenue Million Forecast, by Country 2020 & 2033
- Table 31: United Kingdom Hydrolyzed Feather Meal Industry Revenue (Million) Forecast, by Application 2020 & 2033
- Table 32: Germany Hydrolyzed Feather Meal Industry Revenue (Million) Forecast, by Application 2020 & 2033
- Table 33: France Hydrolyzed Feather Meal Industry Revenue (Million) Forecast, by Application 2020 & 2033
- Table 34: Italy Hydrolyzed Feather Meal Industry Revenue (Million) Forecast, by Application 2020 & 2033
- Table 35: Spain Hydrolyzed Feather Meal Industry Revenue (Million) Forecast, by Application 2020 & 2033
- Table 36: Russia Hydrolyzed Feather Meal Industry Revenue (Million) Forecast, by Application 2020 & 2033
- Table 37: Benelux Hydrolyzed Feather Meal Industry Revenue (Million) Forecast, by Application 2020 & 2033
- Table 38: Nordics Hydrolyzed Feather Meal Industry Revenue (Million) Forecast, by Application 2020 & 2033
- Table 39: Rest of Europe Hydrolyzed Feather Meal Industry Revenue (Million) Forecast, by Application 2020 & 2033
- Table 40: Global Hydrolyzed Feather Meal Industry Revenue Million Forecast, by Production Analysis 2020 & 2033
- Table 41: Global Hydrolyzed Feather Meal Industry Revenue Million Forecast, by Consumption Analysis 2020 & 2033
- Table 42: Global Hydrolyzed Feather Meal Industry Revenue Million Forecast, by Import Market Analysis (Value & Volume) 2020 & 2033
- Table 43: Global Hydrolyzed Feather Meal Industry Revenue Million Forecast, by Export Market Analysis (Value & Volume) 2020 & 2033
- Table 44: Global Hydrolyzed Feather Meal Industry Revenue Million Forecast, by Price Trend Analysis 2020 & 2033
- Table 45: Global Hydrolyzed Feather Meal Industry Revenue Million Forecast, by Country 2020 & 2033
- Table 46: Turkey Hydrolyzed Feather Meal Industry Revenue (Million) Forecast, by Application 2020 & 2033
- Table 47: Israel Hydrolyzed Feather Meal Industry Revenue (Million) Forecast, by Application 2020 & 2033
- Table 48: GCC Hydrolyzed Feather Meal Industry Revenue (Million) Forecast, by Application 2020 & 2033
- Table 49: North Africa Hydrolyzed Feather Meal Industry Revenue (Million) Forecast, by Application 2020 & 2033
- Table 50: South Africa Hydrolyzed Feather Meal Industry Revenue (Million) Forecast, by Application 2020 & 2033
- Table 51: Rest of Middle East & Africa Hydrolyzed Feather Meal Industry Revenue (Million) Forecast, by Application 2020 & 2033
- Table 52: Global Hydrolyzed Feather Meal Industry Revenue Million Forecast, by Production Analysis 2020 & 2033
- Table 53: Global Hydrolyzed Feather Meal Industry Revenue Million Forecast, by Consumption Analysis 2020 & 2033
- Table 54: Global Hydrolyzed Feather Meal Industry Revenue Million Forecast, by Import Market Analysis (Value & Volume) 2020 & 2033
- Table 55: Global Hydrolyzed Feather Meal Industry Revenue Million Forecast, by Export Market Analysis (Value & Volume) 2020 & 2033
- Table 56: Global Hydrolyzed Feather Meal Industry Revenue Million Forecast, by Price Trend Analysis 2020 & 2033
- Table 57: Global Hydrolyzed Feather Meal Industry Revenue Million Forecast, by Country 2020 & 2033
- Table 58: China Hydrolyzed Feather Meal Industry Revenue (Million) Forecast, by Application 2020 & 2033
- Table 59: India Hydrolyzed Feather Meal Industry Revenue (Million) Forecast, by Application 2020 & 2033
- Table 60: Japan Hydrolyzed Feather Meal Industry Revenue (Million) Forecast, by Application 2020 & 2033
- Table 61: South Korea Hydrolyzed Feather Meal Industry Revenue (Million) Forecast, by Application 2020 & 2033
- Table 62: ASEAN Hydrolyzed Feather Meal Industry Revenue (Million) Forecast, by Application 2020 & 2033
- Table 63: Oceania Hydrolyzed Feather Meal Industry Revenue (Million) Forecast, by Application 2020 & 2033
- Table 64: Rest of Asia Pacific Hydrolyzed Feather Meal Industry Revenue (Million) Forecast, by Application 2020 & 2033
Frequently Asked Questions
1. What is the projected Compound Annual Growth Rate (CAGR) of the Hydrolyzed Feather Meal Industry?
The projected CAGR is approximately 8.60%.
2. Which companies are prominent players in the Hydrolyzed Feather Meal Industry?
Key companies in the market include Darling Ingredients, K-Pro U, Valley Proteins, The Boyer Valley Company, North Country Organics, JG Pears, Kleingarn Agrarprodukte, FASA Group.
3. What are the main segments of the Hydrolyzed Feather Meal Industry?
The market segments include Production Analysis, Consumption Analysis, Import Market Analysis (Value & Volume), Export Market Analysis (Value & Volume), Price Trend Analysis.
4. Can you provide details about the market size?
The market size is estimated to be USD 589.51 Million as of 2022.
5. What are some drivers contributing to market growth?
Adoption of Organic and Eco-friendly Farming Practices; Declining Area of Arable Land and Rising Food Security Concerns.
6. What are the notable trends driving market growth?
Increasing demand for organic farming accelerating feather meal market.
7. Are there any restraints impacting market growth?
High Demand for Conventional and Synthetic Products; Lack of Awareness and Other Factors Limiting the Adoption of Agricultural Inoculants.
8. Can you provide examples of recent developments in the market?
August 2022: The University of Danang - University of Science and Technology has successfully made a type of bio-organic fertilizer from chicken feathers with the desire to reduce environmental pollution from by-products such as chicken feathers.
9. What pricing options are available for accessing the report?
Pricing options include single-user, multi-user, and enterprise licenses priced at USD 4750, USD 5250, and USD 8750 respectively.
10. Is the market size provided in terms of value or volume?
The market size is provided in terms of value, measured in Million.
11. Are there any specific market keywords associated with the report?
Yes, the market keyword associated with the report is "Hydrolyzed Feather Meal Industry," which aids in identifying and referencing the specific market segment covered.
12. How do I determine which pricing option suits my needs best?
The pricing options vary based on user requirements and access needs. Individual users may opt for single-user licenses, while businesses requiring broader access may choose multi-user or enterprise licenses for cost-effective access to the report.
13. Are there any additional resources or data provided in the Hydrolyzed Feather Meal Industry report?
While the report offers comprehensive insights, it's advisable to review the specific contents or supplementary materials provided to ascertain if additional resources or data are available.
14. How can I stay updated on further developments or reports in the Hydrolyzed Feather Meal Industry?
To stay informed about further developments, trends, and reports in the Hydrolyzed Feather Meal Industry, consider subscribing to industry newsletters, following relevant companies and organizations, or regularly checking reputable industry news sources and publications.
Methodology
Step 1 - Identification of Relevant Samples Size from Population Database


Step 2 - Approaches for Defining Global Market Size (Value, Volume* & Price*)

Note*: In applicable scenarios
Step 3 - Data Sources
Primary Research
- Web Analytics
- Survey Reports
- Research Institute
- Latest Research Reports
- Opinion Leaders
Secondary Research
- Annual Reports
- White Paper
- Latest Press Release
- Industry Association
- Paid Database
- Investor Presentations

Step 4 - Data Triangulation
Involves using different sources of information in order to increase the validity of a study
These sources are likely to be stakeholders in a program - participants, other researchers, program staff, other community members, and so on.
Then we put all data in single framework & apply various statistical tools to find out the dynamic on the market.
During the analysis stage, feedback from the stakeholder groups would be compared to determine areas of agreement as well as areas of divergence