

Key Insights
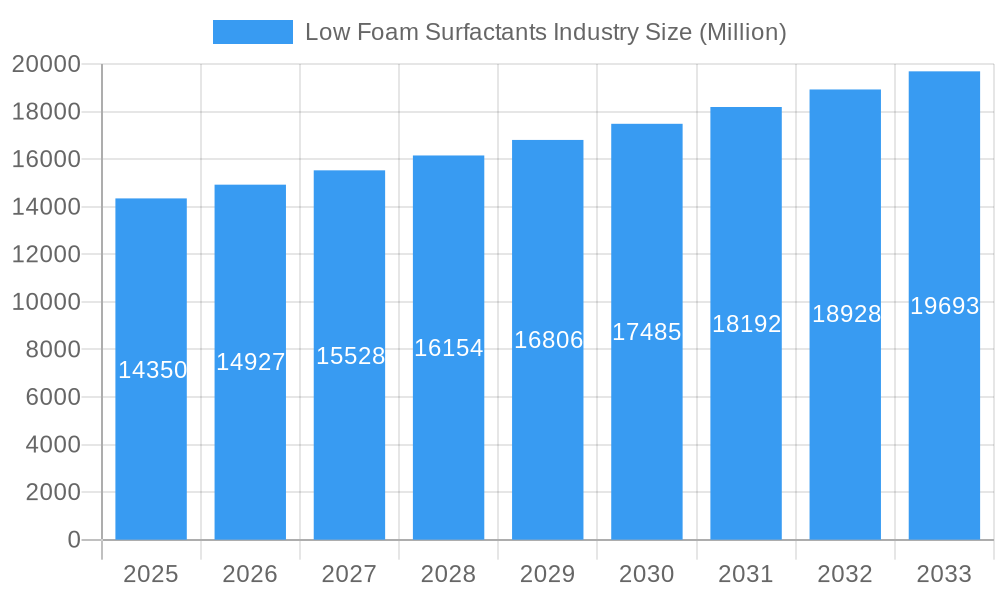
The low foam surfactants market, valued at $14.35 billion in 2025, exhibits robust growth potential, projected to expand at a compound annual growth rate (CAGR) exceeding 4% from 2025 to 2033. This expansion is driven by increasing demand across diverse end-use industries. The agrochemicals sector, leveraging low foam surfactants for effective pesticide and herbicide formulations, contributes significantly to market growth. Similarly, the detergents and cleaning agents industry relies heavily on these surfactants to achieve efficient cleaning without excessive foaming, leading to increased adoption. The food and dairy processing sector utilizes low foam surfactants for sanitation and cleaning, further bolstering market demand. Technological advancements in surfactant chemistry, focused on enhancing performance and biodegradability, are key trends shaping the market landscape. However, stringent environmental regulations regarding surfactant composition and potential health impacts pose challenges to market growth. The market is segmented by surfactant type (amphoteric, cationic, non-ionic) and end-use industry, with a geographically diverse landscape. Major players such as AkzoNobel, Solvay, BASF, and Evonik are driving innovation and expanding their market presence through strategic partnerships and product diversification. The Asia-Pacific region, particularly China and India, demonstrates substantial growth potential due to rapid industrialization and increasing consumer demand for cleaning and personal care products.
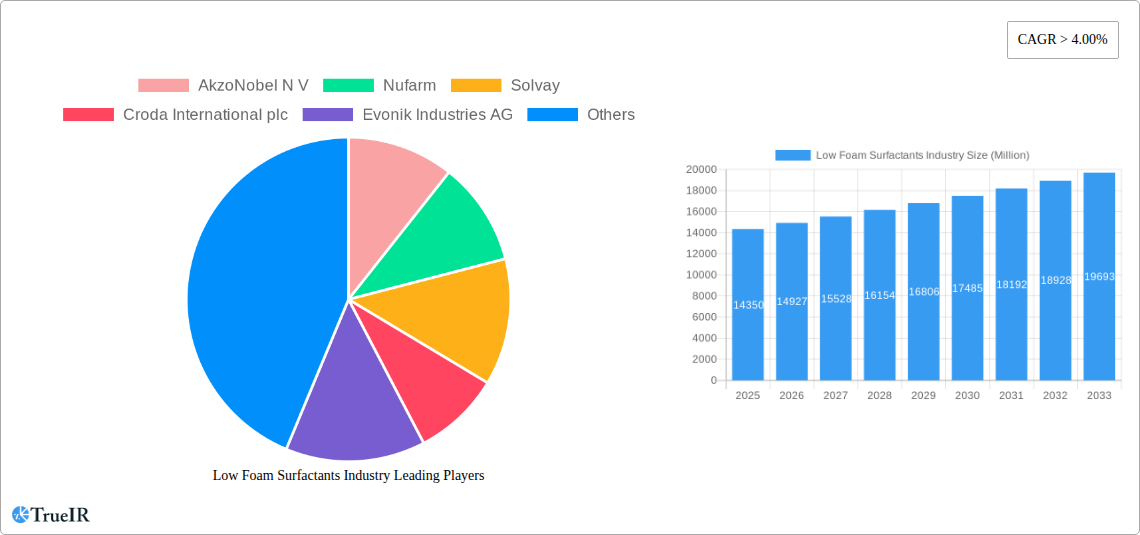
Low Foam Surfactants Industry Market Size (In Billion)
The competitive landscape is characterized by a mix of established multinational corporations and regional players. While established companies benefit from strong brand recognition and extensive distribution networks, smaller companies are focusing on niche applications and sustainable solutions to gain market share. Future growth will likely be influenced by the increasing adoption of sustainable and biodegradable surfactants, driven by growing environmental awareness and stricter regulations. Furthermore, the development of novel surfactant formulations with enhanced performance characteristics will also contribute to market expansion. The market's success hinges on navigating the delicate balance between satisfying the demand for efficient cleaning solutions and adhering to environmental and safety standards.
Low Foam Surfactants Industry Company Market Share
Low Foam Surfactants Industry Market Report: 2019-2033
This comprehensive report provides a detailed analysis of the global low foam surfactants market, offering invaluable insights for businesses, investors, and researchers. The study period covers 2019-2033, with a base year of 2025 and a forecast period of 2025-2033. The report leverages extensive market research to deliver a dynamic and data-driven overview of this crucial industry segment, projecting a market value of xx Million by 2033.
Low Foam Surfactants Industry Market Structure & Competitive Landscape
The low foam surfactants market is moderately concentrated, with several major players holding significant market share. The Herfindahl-Hirschman Index (HHI) for 2024 is estimated at xx, indicating a moderately consolidated market. Innovation is a key driver, with companies investing heavily in R&D to develop new, high-performance surfactants with improved properties and sustainability profiles. Regulatory pressures, particularly concerning environmental impact and safety, are shaping industry practices and product development. Product substitutes, such as alternative cleaning agents, pose a competitive threat, although the superior performance and versatility of low foam surfactants often maintain market dominance.
- Market Concentration: HHI of xx in 2024; Top 5 players hold approximately xx% of the market share.
- Innovation Drivers: Focus on bio-based surfactants, improved performance characteristics (e.g., enhanced cleaning power, reduced environmental impact), and customized formulations for specific applications.
- Regulatory Impacts: Increasingly stringent environmental regulations are driving the adoption of more sustainable and biodegradable surfactants.
- Product Substitutes: Alternative cleaning agents and technologies present a moderate level of competitive pressure.
- End-user Segmentation: The market is diversified across various end-user industries with significant contributions from detergents & cleaning agents, agrochemicals, and oilfield chemicals.
- M&A Trends: A moderate number of mergers and acquisitions occurred during the historical period (2019-2024), mostly focused on expanding product portfolios and geographical reach. The total value of M&A deals within the period is estimated at xx Million.
Low Foam Surfactants Industry Market Trends & Opportunities
The global low foam surfactants market is experiencing robust growth, driven by increasing demand from various end-user industries. The market size was valued at xx Million in 2024 and is projected to reach xx Million by 2033, exhibiting a Compound Annual Growth Rate (CAGR) of xx% during the forecast period. Technological advancements, particularly in the development of bio-based and high-performance surfactants, are key drivers. Consumer preference for eco-friendly and sustainable products is further fueling demand. Intense competition among established players and emerging companies is shaping market dynamics, fostering innovation and driving down prices. Market penetration rates vary across different regions and end-user segments. The highest penetration rates are observed in the developed regions, notably in North America and Europe, while developing economies are showing significant growth potential.
Dominant Markets & Segments in Low Foam Surfactants Industry
The North American region currently holds the largest market share, followed by Europe and Asia-Pacific. Within the segments, non-ionic surfactants dominate in terms of volume, driven by their versatility and cost-effectiveness. However, the amphoteric and cationic segments are experiencing faster growth rates due to their superior performance characteristics in specific applications.
- Leading Region: North America
- Leading Country: United States
- Dominant Type: Non-ionic
- Fastest-Growing Type: Amphoteric
- Largest End-User: Detergents and Cleaning Agents
- Key Growth Drivers (North America): Strong consumer demand for cleaning products, presence of major manufacturers, and well-established distribution channels.
- Key Growth Drivers (Europe): Stringent environmental regulations favoring bio-based surfactants and increasing demand for sustainable cleaning solutions.
- Key Growth Drivers (Asia-Pacific): Rapid economic growth, urbanization, and rising disposable incomes driving demand for cleaning and personal care products.
Low Foam Surfactants Industry Product Analysis
Product innovations focus on improving surfactant performance, enhancing sustainability profiles, and developing specialized formulations for niche applications. Technological advancements such as the incorporation of nanotechnology and bio-based components are enhancing the efficacy and environmental friendliness of low foam surfactants. The competitive advantage lies in offering superior performance, cost-effectiveness, and sustainability in a specific application.
Key Drivers, Barriers & Challenges in Low Foam Surfactants Industry
Key Drivers: Growing demand across various end-user sectors, increasing focus on sustainable and eco-friendly products, technological advancements, stringent environmental regulations driving the adoption of biodegradable surfactants.
Challenges: Fluctuations in raw material prices, stringent regulatory compliance requirements, intense competition, and potential supply chain disruptions. The impact of these factors is estimated to reduce the market growth by approximately xx% during the forecast period.
Growth Drivers in the Low Foam Surfactants Industry Market
The market is propelled by rising demand from various sectors, increasing emphasis on sustainability, and ongoing technological advancements resulting in superior product performance and reduced environmental impact. Government regulations favoring eco-friendly options further contribute to market expansion.
Challenges Impacting Low Foam Surfactants Industry Growth
Significant challenges include price volatility of raw materials, intricate regulatory landscape, and stiff competition from both established players and new entrants. Supply chain vulnerabilities and economic downturns can also negatively impact market growth.
Key Players Shaping the Low Foam Surfactants Industry Market
- AkzoNobel N V
- Nufarm
- Solvay
- Croda International plc
- Evonik Industries AG
- BASF SE
- Huntsman International LLC
- Dow
- KAO CORPORATION
- Oxiteno SA
- Stepan Company
- Clariant AG
Significant Low Foam Surfactants Industry Industry Milestones
- February 2022: Clariant launched a 100% bio-based surfactant range, significantly boosting the market's sustainability focus.
- April 2022: BASF SE expanded its high-performance nonionic surfactant line (Dehypound M and Dehypound HDG), enhancing multi-application cleaning capabilities.
Future Outlook for Low Foam Surfactants Industry Market
The low foam surfactants market is poised for continued growth, driven by innovation, sustainability concerns, and increasing demand across diverse sectors. Strategic partnerships, product diversification, and expansion into emerging markets present significant growth opportunities. The market's future is bright, with further expansion expected across various regions and applications.
Low Foam Surfactants Industry Segmentation
-
1. Type
- 1.1. Amphoteric
- 1.2. Cationic
- 1.3. Non-ionic
-
2. End-user Industry
- 2.1. Agrochemicals
- 2.2. Food and Dairy Process Cleaners
- 2.3. Detergents and Cleaning Agents
- 2.4. Pulp and Paper
- 2.5. Metal Cleaning and Metal Working Fluids
- 2.6. Oilfield Chemicals
- 2.7. Others (Textiles, Personal care, etc.)
Low Foam Surfactants Industry Segmentation By Geography
-
1. Asia Pacific
- 1.1. China
- 1.2. India
- 1.3. Japan
- 1.4. South Korea
- 1.5. Rest of Asia Pacific
-
2. North America
- 2.1. United States
- 2.2. Canada
- 2.3. Mexico
-
3. Europe
- 3.1. Germany
- 3.2. United Kingdom
- 3.3. Italy
- 3.4. France
- 3.5. Rest of Europe
-
4. South America
- 4.1. Brazil
- 4.2. Argentina
- 4.3. Rest of South America
-
5. Middle East and Africa
- 5.1. Saudi Arabia
- 5.2. South Africa
- 5.3. Rest of Middle East and Africa
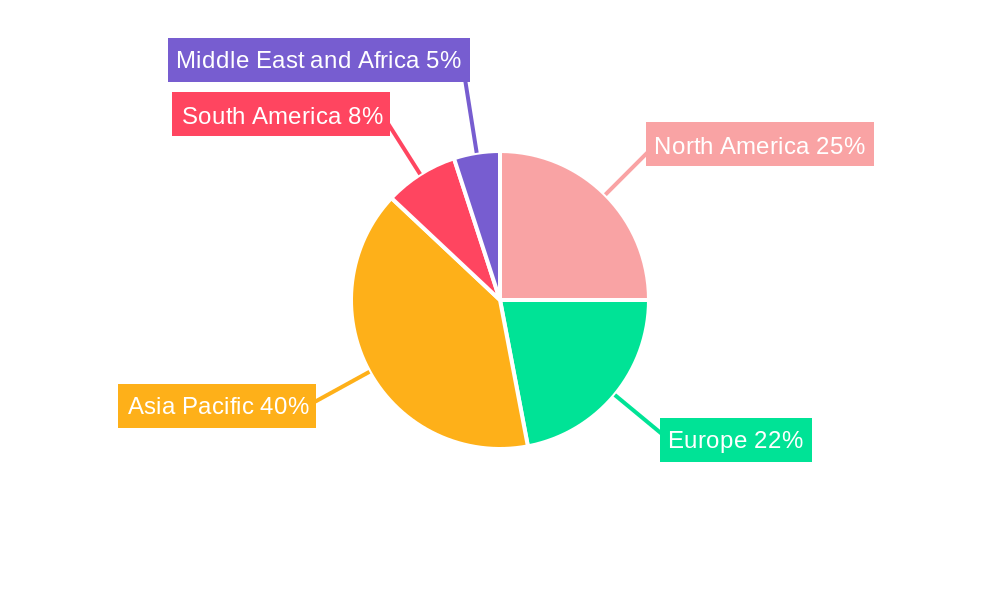
Low Foam Surfactants Industry Regional Market Share
Geographic Coverage of Low Foam Surfactants Industry
Low Foam Surfactants Industry REPORT HIGHLIGHTS
| Aspects | Details |
|---|---|
| Study Period | 2020-2034 |
| Base Year | 2025 |
| Estimated Year | 2026 |
| Forecast Period | 2026-2034 |
| Historical Period | 2020-2025 |
| Growth Rate | CAGR of > 4.00% from 2020-2034 |
| Segmentation |
|
Table of Contents
- 1. Introduction
- 1.1. Research Scope
- 1.2. Market Segmentation
- 1.3. Research Objective
- 1.4. Definitions and Assumptions
- 2. Executive Summary
- 2.1. Market Snapshot
- 3. Market Dynamics
- 3.1. Market Drivers
- 3.2. Market Restrains
- 3.3. Market Trends
- 3.4. Market Opportunities
- 4. Market Factor Analysis
- 4.1. Porters Five Forces
- 4.1.1. Bargaining Power of Suppliers
- 4.1.2. Bargaining Power of Buyers
- 4.1.3. Threat of New Entrants
- 4.1.4. Threat of Substitutes
- 4.1.5. Competitive Rivalry
- 4.2. PESTEL analysis
- 4.3. BCG Analysis
- 4.3.1. Stars (High Growth, High Market Share)
- 4.3.2. Cash Cows (Low Growth, High Market Share)
- 4.3.3. Question Mark (High Growth, Low Market Share)
- 4.3.4. Dogs (Low Growth, Low Market Share)
- 4.4. Ansoff Matrix Analysis
- 4.5. Supply Chain Analysis
- 4.6. Regulatory Landscape
- 4.7. Current Market Potential and Opportunity Assessment (TAM–SAM–SOM Framework)
- 4.8. TIR Analyst Note
- 4.1. Porters Five Forces
- 5. Market Analysis, Insights and Forecast 2021-2033
- 5.1. Market Analysis, Insights and Forecast - by Type
- 5.1.1. Amphoteric
- 5.1.2. Cationic
- 5.1.3. Non-ionic
- 5.2. Market Analysis, Insights and Forecast - by End-user Industry
- 5.2.1. Agrochemicals
- 5.2.2. Food and Dairy Process Cleaners
- 5.2.3. Detergents and Cleaning Agents
- 5.2.4. Pulp and Paper
- 5.2.5. Metal Cleaning and Metal Working Fluids
- 5.2.6. Oilfield Chemicals
- 5.2.7. Others (Textiles, Personal care, etc.)
- 5.3. Market Analysis, Insights and Forecast - by Region
- 5.3.1. Asia Pacific
- 5.3.2. North America
- 5.3.3. Europe
- 5.3.4. South America
- 5.3.5. Middle East and Africa
- 5.1. Market Analysis, Insights and Forecast - by Type
- 6. Global Low Foam Surfactants Industry Analysis, Insights and Forecast, 2021-2033
- 6.1. Market Analysis, Insights and Forecast - by Type
- 6.1.1. Amphoteric
- 6.1.2. Cationic
- 6.1.3. Non-ionic
- 6.2. Market Analysis, Insights and Forecast - by End-user Industry
- 6.2.1. Agrochemicals
- 6.2.2. Food and Dairy Process Cleaners
- 6.2.3. Detergents and Cleaning Agents
- 6.2.4. Pulp and Paper
- 6.2.5. Metal Cleaning and Metal Working Fluids
- 6.2.6. Oilfield Chemicals
- 6.2.7. Others (Textiles, Personal care, etc.)
- 6.1. Market Analysis, Insights and Forecast - by Type
- 7. Asia Pacific Low Foam Surfactants Industry Analysis, Insights and Forecast, 2020-2032
- 7.1. Market Analysis, Insights and Forecast - by Type
- 7.1.1. Amphoteric
- 7.1.2. Cationic
- 7.1.3. Non-ionic
- 7.2. Market Analysis, Insights and Forecast - by End-user Industry
- 7.2.1. Agrochemicals
- 7.2.2. Food and Dairy Process Cleaners
- 7.2.3. Detergents and Cleaning Agents
- 7.2.4. Pulp and Paper
- 7.2.5. Metal Cleaning and Metal Working Fluids
- 7.2.6. Oilfield Chemicals
- 7.2.7. Others (Textiles, Personal care, etc.)
- 7.1. Market Analysis, Insights and Forecast - by Type
- 8. North America Low Foam Surfactants Industry Analysis, Insights and Forecast, 2020-2032
- 8.1. Market Analysis, Insights and Forecast - by Type
- 8.1.1. Amphoteric
- 8.1.2. Cationic
- 8.1.3. Non-ionic
- 8.2. Market Analysis, Insights and Forecast - by End-user Industry
- 8.2.1. Agrochemicals
- 8.2.2. Food and Dairy Process Cleaners
- 8.2.3. Detergents and Cleaning Agents
- 8.2.4. Pulp and Paper
- 8.2.5. Metal Cleaning and Metal Working Fluids
- 8.2.6. Oilfield Chemicals
- 8.2.7. Others (Textiles, Personal care, etc.)
- 8.1. Market Analysis, Insights and Forecast - by Type
- 9. Europe Low Foam Surfactants Industry Analysis, Insights and Forecast, 2020-2032
- 9.1. Market Analysis, Insights and Forecast - by Type
- 9.1.1. Amphoteric
- 9.1.2. Cationic
- 9.1.3. Non-ionic
- 9.2. Market Analysis, Insights and Forecast - by End-user Industry
- 9.2.1. Agrochemicals
- 9.2.2. Food and Dairy Process Cleaners
- 9.2.3. Detergents and Cleaning Agents
- 9.2.4. Pulp and Paper
- 9.2.5. Metal Cleaning and Metal Working Fluids
- 9.2.6. Oilfield Chemicals
- 9.2.7. Others (Textiles, Personal care, etc.)
- 9.1. Market Analysis, Insights and Forecast - by Type
- 10. South America Low Foam Surfactants Industry Analysis, Insights and Forecast, 2020-2032
- 10.1. Market Analysis, Insights and Forecast - by Type
- 10.1.1. Amphoteric
- 10.1.2. Cationic
- 10.1.3. Non-ionic
- 10.2. Market Analysis, Insights and Forecast - by End-user Industry
- 10.2.1. Agrochemicals
- 10.2.2. Food and Dairy Process Cleaners
- 10.2.3. Detergents and Cleaning Agents
- 10.2.4. Pulp and Paper
- 10.2.5. Metal Cleaning and Metal Working Fluids
- 10.2.6. Oilfield Chemicals
- 10.2.7. Others (Textiles, Personal care, etc.)
- 10.1. Market Analysis, Insights and Forecast - by Type
- 11. Middle East and Africa Low Foam Surfactants Industry Analysis, Insights and Forecast, 2020-2032
- 11.1. Market Analysis, Insights and Forecast - by Type
- 11.1.1. Amphoteric
- 11.1.2. Cationic
- 11.1.3. Non-ionic
- 11.2. Market Analysis, Insights and Forecast - by End-user Industry
- 11.2.1. Agrochemicals
- 11.2.2. Food and Dairy Process Cleaners
- 11.2.3. Detergents and Cleaning Agents
- 11.2.4. Pulp and Paper
- 11.2.5. Metal Cleaning and Metal Working Fluids
- 11.2.6. Oilfield Chemicals
- 11.2.7. Others (Textiles, Personal care, etc.)
- 11.1. Market Analysis, Insights and Forecast - by Type
- 12. Competitive Analysis
- 12.1. Company Profiles
- 12.1.1 AkzoNobel N V
- 12.1.1.1. Company Overview
- 12.1.1.2. Products
- 12.1.1.3. Company Financials
- 12.1.1.4. SWOT Analysis
- 12.1.2 Nufarm
- 12.1.2.1. Company Overview
- 12.1.2.2. Products
- 12.1.2.3. Company Financials
- 12.1.2.4. SWOT Analysis
- 12.1.3 Solvay
- 12.1.3.1. Company Overview
- 12.1.3.2. Products
- 12.1.3.3. Company Financials
- 12.1.3.4. SWOT Analysis
- 12.1.4 Croda International plc
- 12.1.4.1. Company Overview
- 12.1.4.2. Products
- 12.1.4.3. Company Financials
- 12.1.4.4. SWOT Analysis
- 12.1.5 Evonik Industries AG
- 12.1.5.1. Company Overview
- 12.1.5.2. Products
- 12.1.5.3. Company Financials
- 12.1.5.4. SWOT Analysis
- 12.1.6 BASF SE
- 12.1.6.1. Company Overview
- 12.1.6.2. Products
- 12.1.6.3. Company Financials
- 12.1.6.4. SWOT Analysis
- 12.1.7 Huntsman International LLC
- 12.1.7.1. Company Overview
- 12.1.7.2. Products
- 12.1.7.3. Company Financials
- 12.1.7.4. SWOT Analysis
- 12.1.8 Dow
- 12.1.8.1. Company Overview
- 12.1.8.2. Products
- 12.1.8.3. Company Financials
- 12.1.8.4. SWOT Analysis
- 12.1.9 KAO CORPORATION
- 12.1.9.1. Company Overview
- 12.1.9.2. Products
- 12.1.9.3. Company Financials
- 12.1.9.4. SWOT Analysis
- 12.1.10 Oxiteno SA
- 12.1.10.1. Company Overview
- 12.1.10.2. Products
- 12.1.10.3. Company Financials
- 12.1.10.4. SWOT Analysis
- 12.1.11 Stepan Company*List Not Exhaustive
- 12.1.11.1. Company Overview
- 12.1.11.2. Products
- 12.1.11.3. Company Financials
- 12.1.11.4. SWOT Analysis
- 12.1.12 Clariant AG
- 12.1.12.1. Company Overview
- 12.1.12.2. Products
- 12.1.12.3. Company Financials
- 12.1.12.4. SWOT Analysis
- 12.1.1 AkzoNobel N V
- 12.2. Market Entropy
- 12.2.1 Company's Key Areas Served
- 12.2.2 Recent Developments
- 12.3. Company Market Share Analysis 2025
- 12.3.1 Top 5 Companies Market Share Analysis
- 12.3.2 Top 3 Companies Market Share Analysis
- 12.4. List of Potential Customers
- 13. Research Methodology
List of Figures
- Figure 1: Global Low Foam Surfactants Industry Revenue Breakdown (Million, %) by Region 2025 & 2033
- Figure 2: Global Low Foam Surfactants Industry Volume Breakdown (liter , %) by Region 2025 & 2033
- Figure 3: Asia Pacific Low Foam Surfactants Industry Revenue (Million), by Type 2025 & 2033
- Figure 4: Asia Pacific Low Foam Surfactants Industry Volume (liter ), by Type 2025 & 2033
- Figure 5: Asia Pacific Low Foam Surfactants Industry Revenue Share (%), by Type 2025 & 2033
- Figure 6: Asia Pacific Low Foam Surfactants Industry Volume Share (%), by Type 2025 & 2033
- Figure 7: Asia Pacific Low Foam Surfactants Industry Revenue (Million), by End-user Industry 2025 & 2033
- Figure 8: Asia Pacific Low Foam Surfactants Industry Volume (liter ), by End-user Industry 2025 & 2033
- Figure 9: Asia Pacific Low Foam Surfactants Industry Revenue Share (%), by End-user Industry 2025 & 2033
- Figure 10: Asia Pacific Low Foam Surfactants Industry Volume Share (%), by End-user Industry 2025 & 2033
- Figure 11: Asia Pacific Low Foam Surfactants Industry Revenue (Million), by Country 2025 & 2033
- Figure 12: Asia Pacific Low Foam Surfactants Industry Volume (liter ), by Country 2025 & 2033
- Figure 13: Asia Pacific Low Foam Surfactants Industry Revenue Share (%), by Country 2025 & 2033
- Figure 14: Asia Pacific Low Foam Surfactants Industry Volume Share (%), by Country 2025 & 2033
- Figure 15: North America Low Foam Surfactants Industry Revenue (Million), by Type 2025 & 2033
- Figure 16: North America Low Foam Surfactants Industry Volume (liter ), by Type 2025 & 2033
- Figure 17: North America Low Foam Surfactants Industry Revenue Share (%), by Type 2025 & 2033
- Figure 18: North America Low Foam Surfactants Industry Volume Share (%), by Type 2025 & 2033
- Figure 19: North America Low Foam Surfactants Industry Revenue (Million), by End-user Industry 2025 & 2033
- Figure 20: North America Low Foam Surfactants Industry Volume (liter ), by End-user Industry 2025 & 2033
- Figure 21: North America Low Foam Surfactants Industry Revenue Share (%), by End-user Industry 2025 & 2033
- Figure 22: North America Low Foam Surfactants Industry Volume Share (%), by End-user Industry 2025 & 2033
- Figure 23: North America Low Foam Surfactants Industry Revenue (Million), by Country 2025 & 2033
- Figure 24: North America Low Foam Surfactants Industry Volume (liter ), by Country 2025 & 2033
- Figure 25: North America Low Foam Surfactants Industry Revenue Share (%), by Country 2025 & 2033
- Figure 26: North America Low Foam Surfactants Industry Volume Share (%), by Country 2025 & 2033
- Figure 27: Europe Low Foam Surfactants Industry Revenue (Million), by Type 2025 & 2033
- Figure 28: Europe Low Foam Surfactants Industry Volume (liter ), by Type 2025 & 2033
- Figure 29: Europe Low Foam Surfactants Industry Revenue Share (%), by Type 2025 & 2033
- Figure 30: Europe Low Foam Surfactants Industry Volume Share (%), by Type 2025 & 2033
- Figure 31: Europe Low Foam Surfactants Industry Revenue (Million), by End-user Industry 2025 & 2033
- Figure 32: Europe Low Foam Surfactants Industry Volume (liter ), by End-user Industry 2025 & 2033
- Figure 33: Europe Low Foam Surfactants Industry Revenue Share (%), by End-user Industry 2025 & 2033
- Figure 34: Europe Low Foam Surfactants Industry Volume Share (%), by End-user Industry 2025 & 2033
- Figure 35: Europe Low Foam Surfactants Industry Revenue (Million), by Country 2025 & 2033
- Figure 36: Europe Low Foam Surfactants Industry Volume (liter ), by Country 2025 & 2033
- Figure 37: Europe Low Foam Surfactants Industry Revenue Share (%), by Country 2025 & 2033
- Figure 38: Europe Low Foam Surfactants Industry Volume Share (%), by Country 2025 & 2033
- Figure 39: South America Low Foam Surfactants Industry Revenue (Million), by Type 2025 & 2033
- Figure 40: South America Low Foam Surfactants Industry Volume (liter ), by Type 2025 & 2033
- Figure 41: South America Low Foam Surfactants Industry Revenue Share (%), by Type 2025 & 2033
- Figure 42: South America Low Foam Surfactants Industry Volume Share (%), by Type 2025 & 2033
- Figure 43: South America Low Foam Surfactants Industry Revenue (Million), by End-user Industry 2025 & 2033
- Figure 44: South America Low Foam Surfactants Industry Volume (liter ), by End-user Industry 2025 & 2033
- Figure 45: South America Low Foam Surfactants Industry Revenue Share (%), by End-user Industry 2025 & 2033
- Figure 46: South America Low Foam Surfactants Industry Volume Share (%), by End-user Industry 2025 & 2033
- Figure 47: South America Low Foam Surfactants Industry Revenue (Million), by Country 2025 & 2033
- Figure 48: South America Low Foam Surfactants Industry Volume (liter ), by Country 2025 & 2033
- Figure 49: South America Low Foam Surfactants Industry Revenue Share (%), by Country 2025 & 2033
- Figure 50: South America Low Foam Surfactants Industry Volume Share (%), by Country 2025 & 2033
- Figure 51: Middle East and Africa Low Foam Surfactants Industry Revenue (Million), by Type 2025 & 2033
- Figure 52: Middle East and Africa Low Foam Surfactants Industry Volume (liter ), by Type 2025 & 2033
- Figure 53: Middle East and Africa Low Foam Surfactants Industry Revenue Share (%), by Type 2025 & 2033
- Figure 54: Middle East and Africa Low Foam Surfactants Industry Volume Share (%), by Type 2025 & 2033
- Figure 55: Middle East and Africa Low Foam Surfactants Industry Revenue (Million), by End-user Industry 2025 & 2033
- Figure 56: Middle East and Africa Low Foam Surfactants Industry Volume (liter ), by End-user Industry 2025 & 2033
- Figure 57: Middle East and Africa Low Foam Surfactants Industry Revenue Share (%), by End-user Industry 2025 & 2033
- Figure 58: Middle East and Africa Low Foam Surfactants Industry Volume Share (%), by End-user Industry 2025 & 2033
- Figure 59: Middle East and Africa Low Foam Surfactants Industry Revenue (Million), by Country 2025 & 2033
- Figure 60: Middle East and Africa Low Foam Surfactants Industry Volume (liter ), by Country 2025 & 2033
- Figure 61: Middle East and Africa Low Foam Surfactants Industry Revenue Share (%), by Country 2025 & 2033
- Figure 62: Middle East and Africa Low Foam Surfactants Industry Volume Share (%), by Country 2025 & 2033
List of Tables
- Table 1: Global Low Foam Surfactants Industry Revenue Million Forecast, by Type 2020 & 2033
- Table 2: Global Low Foam Surfactants Industry Volume liter Forecast, by Type 2020 & 2033
- Table 3: Global Low Foam Surfactants Industry Revenue Million Forecast, by End-user Industry 2020 & 2033
- Table 4: Global Low Foam Surfactants Industry Volume liter Forecast, by End-user Industry 2020 & 2033
- Table 5: Global Low Foam Surfactants Industry Revenue Million Forecast, by Region 2020 & 2033
- Table 6: Global Low Foam Surfactants Industry Volume liter Forecast, by Region 2020 & 2033
- Table 7: Global Low Foam Surfactants Industry Revenue Million Forecast, by Type 2020 & 2033
- Table 8: Global Low Foam Surfactants Industry Volume liter Forecast, by Type 2020 & 2033
- Table 9: Global Low Foam Surfactants Industry Revenue Million Forecast, by End-user Industry 2020 & 2033
- Table 10: Global Low Foam Surfactants Industry Volume liter Forecast, by End-user Industry 2020 & 2033
- Table 11: Global Low Foam Surfactants Industry Revenue Million Forecast, by Country 2020 & 2033
- Table 12: Global Low Foam Surfactants Industry Volume liter Forecast, by Country 2020 & 2033
- Table 13: China Low Foam Surfactants Industry Revenue (Million) Forecast, by Application 2020 & 2033
- Table 14: China Low Foam Surfactants Industry Volume (liter ) Forecast, by Application 2020 & 2033
- Table 15: India Low Foam Surfactants Industry Revenue (Million) Forecast, by Application 2020 & 2033
- Table 16: India Low Foam Surfactants Industry Volume (liter ) Forecast, by Application 2020 & 2033
- Table 17: Japan Low Foam Surfactants Industry Revenue (Million) Forecast, by Application 2020 & 2033
- Table 18: Japan Low Foam Surfactants Industry Volume (liter ) Forecast, by Application 2020 & 2033
- Table 19: South Korea Low Foam Surfactants Industry Revenue (Million) Forecast, by Application 2020 & 2033
- Table 20: South Korea Low Foam Surfactants Industry Volume (liter ) Forecast, by Application 2020 & 2033
- Table 21: Rest of Asia Pacific Low Foam Surfactants Industry Revenue (Million) Forecast, by Application 2020 & 2033
- Table 22: Rest of Asia Pacific Low Foam Surfactants Industry Volume (liter ) Forecast, by Application 2020 & 2033
- Table 23: Global Low Foam Surfactants Industry Revenue Million Forecast, by Type 2020 & 2033
- Table 24: Global Low Foam Surfactants Industry Volume liter Forecast, by Type 2020 & 2033
- Table 25: Global Low Foam Surfactants Industry Revenue Million Forecast, by End-user Industry 2020 & 2033
- Table 26: Global Low Foam Surfactants Industry Volume liter Forecast, by End-user Industry 2020 & 2033
- Table 27: Global Low Foam Surfactants Industry Revenue Million Forecast, by Country 2020 & 2033
- Table 28: Global Low Foam Surfactants Industry Volume liter Forecast, by Country 2020 & 2033
- Table 29: United States Low Foam Surfactants Industry Revenue (Million) Forecast, by Application 2020 & 2033
- Table 30: United States Low Foam Surfactants Industry Volume (liter ) Forecast, by Application 2020 & 2033
- Table 31: Canada Low Foam Surfactants Industry Revenue (Million) Forecast, by Application 2020 & 2033
- Table 32: Canada Low Foam Surfactants Industry Volume (liter ) Forecast, by Application 2020 & 2033
- Table 33: Mexico Low Foam Surfactants Industry Revenue (Million) Forecast, by Application 2020 & 2033
- Table 34: Mexico Low Foam Surfactants Industry Volume (liter ) Forecast, by Application 2020 & 2033
- Table 35: Global Low Foam Surfactants Industry Revenue Million Forecast, by Type 2020 & 2033
- Table 36: Global Low Foam Surfactants Industry Volume liter Forecast, by Type 2020 & 2033
- Table 37: Global Low Foam Surfactants Industry Revenue Million Forecast, by End-user Industry 2020 & 2033
- Table 38: Global Low Foam Surfactants Industry Volume liter Forecast, by End-user Industry 2020 & 2033
- Table 39: Global Low Foam Surfactants Industry Revenue Million Forecast, by Country 2020 & 2033
- Table 40: Global Low Foam Surfactants Industry Volume liter Forecast, by Country 2020 & 2033
- Table 41: Germany Low Foam Surfactants Industry Revenue (Million) Forecast, by Application 2020 & 2033
- Table 42: Germany Low Foam Surfactants Industry Volume (liter ) Forecast, by Application 2020 & 2033
- Table 43: United Kingdom Low Foam Surfactants Industry Revenue (Million) Forecast, by Application 2020 & 2033
- Table 44: United Kingdom Low Foam Surfactants Industry Volume (liter ) Forecast, by Application 2020 & 2033
- Table 45: Italy Low Foam Surfactants Industry Revenue (Million) Forecast, by Application 2020 & 2033
- Table 46: Italy Low Foam Surfactants Industry Volume (liter ) Forecast, by Application 2020 & 2033
- Table 47: France Low Foam Surfactants Industry Revenue (Million) Forecast, by Application 2020 & 2033
- Table 48: France Low Foam Surfactants Industry Volume (liter ) Forecast, by Application 2020 & 2033
- Table 49: Rest of Europe Low Foam Surfactants Industry Revenue (Million) Forecast, by Application 2020 & 2033
- Table 50: Rest of Europe Low Foam Surfactants Industry Volume (liter ) Forecast, by Application 2020 & 2033
- Table 51: Global Low Foam Surfactants Industry Revenue Million Forecast, by Type 2020 & 2033
- Table 52: Global Low Foam Surfactants Industry Volume liter Forecast, by Type 2020 & 2033
- Table 53: Global Low Foam Surfactants Industry Revenue Million Forecast, by End-user Industry 2020 & 2033
- Table 54: Global Low Foam Surfactants Industry Volume liter Forecast, by End-user Industry 2020 & 2033
- Table 55: Global Low Foam Surfactants Industry Revenue Million Forecast, by Country 2020 & 2033
- Table 56: Global Low Foam Surfactants Industry Volume liter Forecast, by Country 2020 & 2033
- Table 57: Brazil Low Foam Surfactants Industry Revenue (Million) Forecast, by Application 2020 & 2033
- Table 58: Brazil Low Foam Surfactants Industry Volume (liter ) Forecast, by Application 2020 & 2033
- Table 59: Argentina Low Foam Surfactants Industry Revenue (Million) Forecast, by Application 2020 & 2033
- Table 60: Argentina Low Foam Surfactants Industry Volume (liter ) Forecast, by Application 2020 & 2033
- Table 61: Rest of South America Low Foam Surfactants Industry Revenue (Million) Forecast, by Application 2020 & 2033
- Table 62: Rest of South America Low Foam Surfactants Industry Volume (liter ) Forecast, by Application 2020 & 2033
- Table 63: Global Low Foam Surfactants Industry Revenue Million Forecast, by Type 2020 & 2033
- Table 64: Global Low Foam Surfactants Industry Volume liter Forecast, by Type 2020 & 2033
- Table 65: Global Low Foam Surfactants Industry Revenue Million Forecast, by End-user Industry 2020 & 2033
- Table 66: Global Low Foam Surfactants Industry Volume liter Forecast, by End-user Industry 2020 & 2033
- Table 67: Global Low Foam Surfactants Industry Revenue Million Forecast, by Country 2020 & 2033
- Table 68: Global Low Foam Surfactants Industry Volume liter Forecast, by Country 2020 & 2033
- Table 69: Saudi Arabia Low Foam Surfactants Industry Revenue (Million) Forecast, by Application 2020 & 2033
- Table 70: Saudi Arabia Low Foam Surfactants Industry Volume (liter ) Forecast, by Application 2020 & 2033
- Table 71: South Africa Low Foam Surfactants Industry Revenue (Million) Forecast, by Application 2020 & 2033
- Table 72: South Africa Low Foam Surfactants Industry Volume (liter ) Forecast, by Application 2020 & 2033
- Table 73: Rest of Middle East and Africa Low Foam Surfactants Industry Revenue (Million) Forecast, by Application 2020 & 2033
- Table 74: Rest of Middle East and Africa Low Foam Surfactants Industry Volume (liter ) Forecast, by Application 2020 & 2033
Frequently Asked Questions
1. What is the projected Compound Annual Growth Rate (CAGR) of the Low Foam Surfactants Industry?
The projected CAGR is approximately > 4.00%.
2. Which companies are prominent players in the Low Foam Surfactants Industry?
Key companies in the market include AkzoNobel N V, Nufarm, Solvay, Croda International plc, Evonik Industries AG, BASF SE, Huntsman International LLC, Dow, KAO CORPORATION, Oxiteno SA, Stepan Company*List Not Exhaustive, Clariant AG.
3. What are the main segments of the Low Foam Surfactants Industry?
The market segments include Type, End-user Industry.
4. Can you provide details about the market size?
The market size is estimated to be USD 14.35 Million as of 2022.
5. What are some drivers contributing to market growth?
Significant Growth in Detergents and Cleaning Agents; Increased Demand for Sustainable Surfactants; The rising demand for personal care products.
6. What are the notable trends driving market growth?
Detergents and Cleaning Agents End-user Industry Segment to Dominate the Market.
7. Are there any restraints impacting market growth?
The Stringent Enviornmental Regulations; The Availability of Other Substitutes.
8. Can you provide examples of recent developments in the market?
April 2022: BASF SE announced the expansion of a new line of products, such as Dehypound M and Dehypound HDG. These high-performance nonionic surfactant blends are used for multi-soil, multi-application cleaning, and degreasing.
9. What pricing options are available for accessing the report?
Pricing options include single-user, multi-user, and enterprise licenses priced at USD 4750, USD 5250, and USD 8750 respectively.
10. Is the market size provided in terms of value or volume?
The market size is provided in terms of value, measured in Million and volume, measured in liter .
11. Are there any specific market keywords associated with the report?
Yes, the market keyword associated with the report is "Low Foam Surfactants Industry," which aids in identifying and referencing the specific market segment covered.
12. How do I determine which pricing option suits my needs best?
The pricing options vary based on user requirements and access needs. Individual users may opt for single-user licenses, while businesses requiring broader access may choose multi-user or enterprise licenses for cost-effective access to the report.
13. Are there any additional resources or data provided in the Low Foam Surfactants Industry report?
While the report offers comprehensive insights, it's advisable to review the specific contents or supplementary materials provided to ascertain if additional resources or data are available.
14. How can I stay updated on further developments or reports in the Low Foam Surfactants Industry?
To stay informed about further developments, trends, and reports in the Low Foam Surfactants Industry, consider subscribing to industry newsletters, following relevant companies and organizations, or regularly checking reputable industry news sources and publications.
Methodology
Step 1 - Identification of Relevant Samples Size from Population Database


Step 2 - Approaches for Defining Global Market Size (Value, Volume* & Price*)

Note*: In applicable scenarios
Step 3 - Data Sources
Primary Research
- Web Analytics
- Survey Reports
- Research Institute
- Latest Research Reports
- Opinion Leaders
Secondary Research
- Annual Reports
- White Paper
- Latest Press Release
- Industry Association
- Paid Database
- Investor Presentations

Step 4 - Data Triangulation
Involves using different sources of information in order to increase the validity of a study
These sources are likely to be stakeholders in a program - participants, other researchers, program staff, other community members, and so on.
Then we put all data in single framework & apply various statistical tools to find out the dynamic on the market.
During the analysis stage, feedback from the stakeholder groups would be compared to determine areas of agreement as well as areas of divergence