

Key Insights
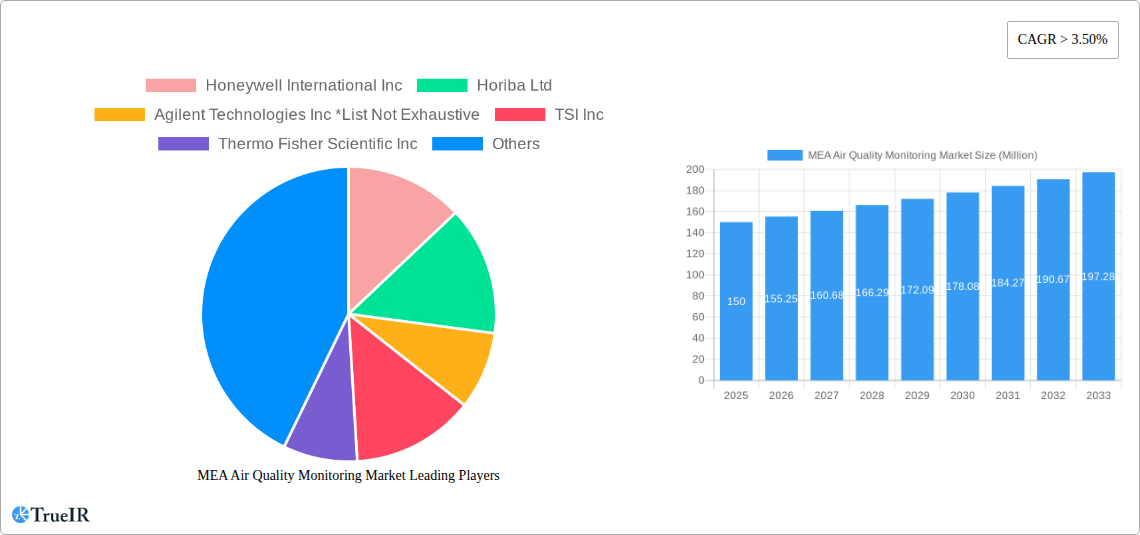
The MEA Air Quality Monitoring Market is poised for substantial expansion, fueled by escalating environmental consciousness, robust regulatory frameworks, and burgeoning industrialization across the Middle East and Africa. The market, valued at approximately $5.5 billion in 2025, is projected to witness a Compound Annual Growth Rate (CAGR) of 6.2% from 2025 to 2033. Key growth catalysts include the rising incidence of respiratory ailments linked to air pollution and heightened public and governmental emphasis on air quality improvement. Significant infrastructure development and industrial activities in nations like the UAE and Saudi Arabia are further amplifying the demand for advanced air quality monitoring solutions. The market is segmented by product type (indoor and outdoor monitors), sampling method (continuous, manual, intermittent), pollutant type (chemical, physical, biological), and end-user (residential, commercial, power generation, petrochemicals, etc.). The continuous monitoring segment is anticipated to lead, offering real-time data crucial for effective pollution management. Chemical pollutants are expected to constitute a major share, reflecting prevalent industrial emissions. Leading market participants, including Honeywell, Horiba, Agilent Technologies, TSI, Thermo Fisher Scientific, Emerson Electric, Siemens, 3M, and Teledyne Technologies, are driving innovation and strategic collaborations that shape the competitive landscape.
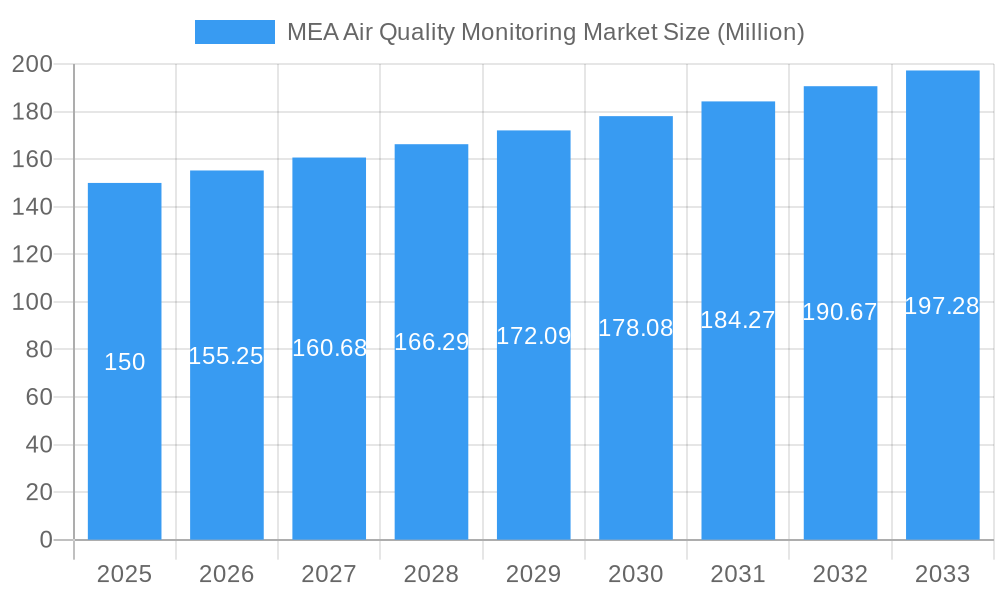
MEA Air Quality Monitoring Market Market Size (In Billion)
Market expansion will be shaped by several influencing factors. While increased government investments in environmental protection initiatives will propel market growth, challenges such as high upfront costs for sophisticated monitoring systems and limited awareness in specific areas may present impediments. However, the growing integration of smart city concepts and the escalating need for precise pollution data for effective environmental management are expected to mitigate these restraints. The adoption of cutting-edge technologies, including IoT-enabled sensors and advanced data analytics, will further accelerate market growth, facilitating more efficient monitoring and pollution control strategies. The MEA region, particularly the UAE and Saudi Arabia, will remain pivotal contributors to market expansion, driven by their economic dynamism and proactive environmental policies. Future growth will also likely be propelled by increased demand from the power generation and petrochemical sectors, in response to stringent emission regulations.
MEA Air Quality Monitoring Market Company Market Share
MEA Air Quality Monitoring Market: A Comprehensive Report (2019-2033)
This dynamic report provides a detailed analysis of the Middle East and Africa (MEA) Air Quality Monitoring Market, offering invaluable insights for industry stakeholders, investors, and policymakers. With a comprehensive study period spanning 2019-2033 (base year 2025, forecast period 2025-2033), this report leverages extensive market research and data analysis to illuminate key trends, opportunities, and challenges within this rapidly evolving sector. The market is expected to reach xx Million by 2033, exhibiting a compelling CAGR of xx%.
MEA Air Quality Monitoring Market Structure & Competitive Landscape
The MEA air quality monitoring market exhibits a moderately consolidated structure, with several key players dominating specific segments. The market concentration ratio (CR4) is estimated at xx%, indicating a presence of both established multinational corporations and specialized regional players. Innovation is a key driver, with companies continually developing advanced sensors, data analytics capabilities, and network connectivity solutions. Stringent government regulations concerning air pollution, particularly in the UAE and other GCC nations, exert a significant influence, pushing for stricter monitoring standards and driving market growth. While there are limited direct substitutes for dedicated air quality monitoring systems, cost-effective solutions and competitive pressures may influence market share dynamics. The market is segmented by product type (indoor and outdoor monitors), sampling method (continuous, manual, and intermittent), pollutant type (chemical, physical, and biological), and end-user (residential and commercial, power generation, petrochemicals, and other end-users). Mergers and acquisitions (M&A) activity has been relatively moderate in recent years, with a reported xx Million in M&A volume between 2021 and 2023, suggesting potential for future consolidation.
- Market Concentration: CR4 estimated at xx%
- Innovation Drivers: Advanced sensors, data analytics, network connectivity
- Regulatory Impacts: Stringent regulations driving demand for advanced monitoring
- Product Substitutes: Limited direct substitutes, but cost-effective solutions emerging
- End-User Segmentation: Diverse applications across various sectors
- M&A Trends: Moderate activity, with potential for future consolidation
MEA Air Quality Monitoring Market Market Trends & Opportunities
The MEA air quality monitoring market is experiencing robust growth driven by increasing urbanization, industrialization, and growing awareness of air pollution's health and environmental consequences. The market is witnessing a significant shift towards advanced technologies, such as IoT-enabled sensors and AI-powered data analytics, enabling real-time monitoring and predictive capabilities. Consumer preferences are leaning towards user-friendly, cost-effective solutions with reliable data accuracy. Competitive dynamics are characterized by product differentiation, technological innovation, and strategic partnerships. The market penetration rate for advanced monitoring solutions is currently estimated at xx%, projected to reach xx% by 2033. The market size is expected to grow from xx Million in 2025 to xx Million in 2033, fuelled by several factors including increased government investment in environmental monitoring infrastructure.
Dominant Markets & Segments in MEA Air Quality Monitoring Market
The UAE and Saudi Arabia represent the dominant markets within the MEA region, driven by substantial investments in infrastructure development, stringent environmental regulations, and increasing public awareness regarding air quality. The outdoor monitoring segment holds the largest market share, reflecting the greater prevalence of outdoor pollution sources. Continuous monitoring methods are experiencing higher adoption rates due to their ability to provide real-time data. Chemical pollutants constitute the most significant segment by pollutant type, reflecting prevalent industrial emissions and vehicular traffic. Power generation and petrochemicals are key end-user segments contributing to substantial demand.
- Key Growth Drivers:
- Substantial investments in environmental monitoring infrastructure
- Stringent environmental regulations and policies
- Growing awareness of air pollution's health and environmental impacts
- Technological advancements in monitoring systems
MEA Air Quality Monitoring Market Product Analysis
The MEA air quality monitoring market showcases a wide array of products, ranging from basic, portable devices to sophisticated, network-connected systems capable of real-time data acquisition and analysis. Continuous improvements in sensor technology, particularly in terms of accuracy, sensitivity, and longevity, are driving market innovation. The integration of advanced data analytics and IoT technologies enhances the capabilities of monitoring systems, allowing for predictive modeling and early warning systems. Market success hinges on product reliability, data accuracy, ease of use, and cost-effectiveness.
Key Drivers, Barriers & Challenges in MEA Air Quality Monitoring Market
Key Drivers: Stringent government regulations to improve air quality, rapid industrialization and urbanization leading to increased pollution levels, and technological advancements providing more accurate and efficient monitoring systems.
Challenges: High initial investment costs for advanced monitoring systems, a shortage of skilled technicians and operators, and challenges in data management and analysis due to the complexity of data generated by large monitoring networks. Furthermore, supply chain disruptions and geopolitical factors can impact the availability and cost of components, impacting market growth.
Growth Drivers in the MEA Air Quality Monitoring Market Market
The MEA air quality monitoring market's growth is fueled by several factors. Government initiatives like the UAE's National Air Quality Agenda 2031, and specific projects like Ajman Free Zone's implementation of AirSense technology, are significantly driving demand. The rising awareness of air pollution's health effects, coupled with investments in smart city infrastructure, further strengthens market momentum.
Challenges Impacting MEA Air Quality Monitoring Market Growth
Challenges include the high initial investment required for sophisticated monitoring equipment, potential regulatory complexities, and difficulties in establishing robust data management systems to process large datasets. Supply chain disruptions and the need for skilled workforce development also act as impediments.
Key Players Shaping the MEA Air Quality Monitoring Market Market
Significant MEA Air Quality Monitoring Market Industry Milestones
- July 2022: Ajman Free Zone implements AirSense technology for air quality monitoring.
- June 2022: UAE launches National Air Quality Agenda 2031.
- March 2022: Abu Dhabi expands its air monitoring network to 22 monitors.
Future Outlook for MEA Air Quality Monitoring Market Market
The MEA air quality monitoring market is poised for continued growth, driven by sustained investments in infrastructure, stringent environmental regulations, and technological advancements. Strategic partnerships between governments, private sector companies, and research institutions are likely to enhance market development. The increasing adoption of smart city initiatives and growing awareness of air pollution's health implications present lucrative opportunities for market expansion.
MEA Air Quality Monitoring Market Segmentation
-
1. Product Type
- 1.1. Indoor Monitor
- 1.2. Outdoor Monitor
-
2. Sampling Method
- 2.1. Continuous
- 2.2. Manual
- 2.3. Intermittent
-
3. Pollutant Type
- 3.1. Chemical Pollutants
- 3.2. Physical Pollutants
- 3.3. Biological Pollutants
-
4. End User
- 4.1. Residential and Commercial
- 4.2. Power Generation
- 4.3. Petrochemicals
- 4.4. Other End Users
-
5. Geography
- 5.1. Saudi Arabia
- 5.2. United Arab Emirates
- 5.3. Rest of Middle-East and Africa
MEA Air Quality Monitoring Market Segmentation By Geography
- 1. Saudi Arabia
- 2. United Arab Emirates
- 3. Rest of Middle East and Africa
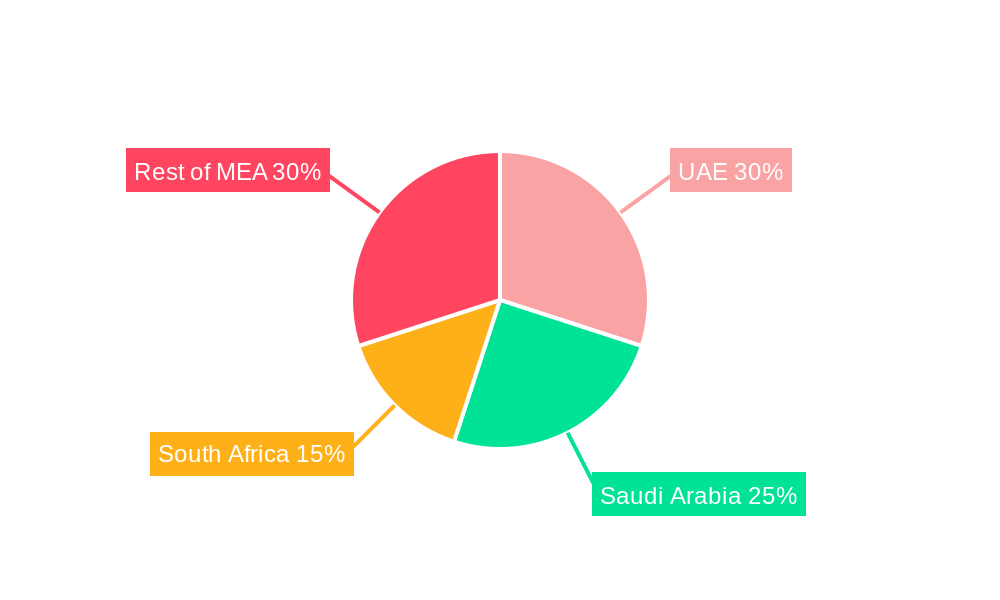
MEA Air Quality Monitoring Market Regional Market Share
Geographic Coverage of MEA Air Quality Monitoring Market
MEA Air Quality Monitoring Market REPORT HIGHLIGHTS
| Aspects | Details |
|---|---|
| Study Period | 2020-2034 |
| Base Year | 2025 |
| Estimated Year | 2026 |
| Forecast Period | 2026-2034 |
| Historical Period | 2020-2025 |
| Growth Rate | CAGR of 6.2% from 2020-2034 |
| Segmentation |
|
Table of Contents
- 1. Introduction
- 1.1. Research Scope
- 1.2. Market Segmentation
- 1.3. Research Objective
- 1.4. Definitions and Assumptions
- 2. Executive Summary
- 2.1. Market Snapshot
- 3. Market Dynamics
- 3.1. Market Drivers
- 3.2. Market Restrains
- 3.3. Market Trends
- 3.4. Market Opportunities
- 4. Market Factor Analysis
- 4.1. Porters Five Forces
- 4.1.1. Bargaining Power of Suppliers
- 4.1.2. Bargaining Power of Buyers
- 4.1.3. Threat of New Entrants
- 4.1.4. Threat of Substitutes
- 4.1.5. Competitive Rivalry
- 4.2. PESTEL analysis
- 4.3. BCG Analysis
- 4.3.1. Stars (High Growth, High Market Share)
- 4.3.2. Cash Cows (Low Growth, High Market Share)
- 4.3.3. Question Mark (High Growth, Low Market Share)
- 4.3.4. Dogs (Low Growth, Low Market Share)
- 4.4. Ansoff Matrix Analysis
- 4.5. Supply Chain Analysis
- 4.6. Regulatory Landscape
- 4.7. Current Market Potential and Opportunity Assessment (TAM–SAM–SOM Framework)
- 4.8. TIR Analyst Note
- 4.1. Porters Five Forces
- 5. Market Analysis, Insights and Forecast 2021-2033
- 5.1. Market Analysis, Insights and Forecast - by Product Type
- 5.1.1. Indoor Monitor
- 5.1.2. Outdoor Monitor
- 5.2. Market Analysis, Insights and Forecast - by Sampling Method
- 5.2.1. Continuous
- 5.2.2. Manual
- 5.2.3. Intermittent
- 5.3. Market Analysis, Insights and Forecast - by Pollutant Type
- 5.3.1. Chemical Pollutants
- 5.3.2. Physical Pollutants
- 5.3.3. Biological Pollutants
- 5.4. Market Analysis, Insights and Forecast - by End User
- 5.4.1. Residential and Commercial
- 5.4.2. Power Generation
- 5.4.3. Petrochemicals
- 5.4.4. Other End Users
- 5.5. Market Analysis, Insights and Forecast - by Geography
- 5.5.1. Saudi Arabia
- 5.5.2. United Arab Emirates
- 5.5.3. Rest of Middle-East and Africa
- 5.6. Market Analysis, Insights and Forecast - by Region
- 5.6.1. Saudi Arabia
- 5.6.2. United Arab Emirates
- 5.6.3. Rest of Middle East and Africa
- 5.1. Market Analysis, Insights and Forecast - by Product Type
- 6. MEA Air Quality Monitoring Market Analysis, Insights and Forecast, 2021-2033
- 6.1. Market Analysis, Insights and Forecast - by Product Type
- 6.1.1. Indoor Monitor
- 6.1.2. Outdoor Monitor
- 6.2. Market Analysis, Insights and Forecast - by Sampling Method
- 6.2.1. Continuous
- 6.2.2. Manual
- 6.2.3. Intermittent
- 6.3. Market Analysis, Insights and Forecast - by Pollutant Type
- 6.3.1. Chemical Pollutants
- 6.3.2. Physical Pollutants
- 6.3.3. Biological Pollutants
- 6.4. Market Analysis, Insights and Forecast - by End User
- 6.4.1. Residential and Commercial
- 6.4.2. Power Generation
- 6.4.3. Petrochemicals
- 6.4.4. Other End Users
- 6.5. Market Analysis, Insights and Forecast - by Geography
- 6.5.1. Saudi Arabia
- 6.5.2. United Arab Emirates
- 6.5.3. Rest of Middle-East and Africa
- 6.1. Market Analysis, Insights and Forecast - by Product Type
- 7. Saudi Arabia MEA Air Quality Monitoring Market Analysis, Insights and Forecast, 2020-2032
- 7.1. Market Analysis, Insights and Forecast - by Product Type
- 7.1.1. Indoor Monitor
- 7.1.2. Outdoor Monitor
- 7.2. Market Analysis, Insights and Forecast - by Sampling Method
- 7.2.1. Continuous
- 7.2.2. Manual
- 7.2.3. Intermittent
- 7.3. Market Analysis, Insights and Forecast - by Pollutant Type
- 7.3.1. Chemical Pollutants
- 7.3.2. Physical Pollutants
- 7.3.3. Biological Pollutants
- 7.4. Market Analysis, Insights and Forecast - by End User
- 7.4.1. Residential and Commercial
- 7.4.2. Power Generation
- 7.4.3. Petrochemicals
- 7.4.4. Other End Users
- 7.5. Market Analysis, Insights and Forecast - by Geography
- 7.5.1. Saudi Arabia
- 7.5.2. United Arab Emirates
- 7.5.3. Rest of Middle-East and Africa
- 7.1. Market Analysis, Insights and Forecast - by Product Type
- 8. United Arab Emirates MEA Air Quality Monitoring Market Analysis, Insights and Forecast, 2020-2032
- 8.1. Market Analysis, Insights and Forecast - by Product Type
- 8.1.1. Indoor Monitor
- 8.1.2. Outdoor Monitor
- 8.2. Market Analysis, Insights and Forecast - by Sampling Method
- 8.2.1. Continuous
- 8.2.2. Manual
- 8.2.3. Intermittent
- 8.3. Market Analysis, Insights and Forecast - by Pollutant Type
- 8.3.1. Chemical Pollutants
- 8.3.2. Physical Pollutants
- 8.3.3. Biological Pollutants
- 8.4. Market Analysis, Insights and Forecast - by End User
- 8.4.1. Residential and Commercial
- 8.4.2. Power Generation
- 8.4.3. Petrochemicals
- 8.4.4. Other End Users
- 8.5. Market Analysis, Insights and Forecast - by Geography
- 8.5.1. Saudi Arabia
- 8.5.2. United Arab Emirates
- 8.5.3. Rest of Middle-East and Africa
- 8.1. Market Analysis, Insights and Forecast - by Product Type
- 9. Rest of Middle East and Africa MEA Air Quality Monitoring Market Analysis, Insights and Forecast, 2020-2032
- 9.1. Market Analysis, Insights and Forecast - by Product Type
- 9.1.1. Indoor Monitor
- 9.1.2. Outdoor Monitor
- 9.2. Market Analysis, Insights and Forecast - by Sampling Method
- 9.2.1. Continuous
- 9.2.2. Manual
- 9.2.3. Intermittent
- 9.3. Market Analysis, Insights and Forecast - by Pollutant Type
- 9.3.1. Chemical Pollutants
- 9.3.2. Physical Pollutants
- 9.3.3. Biological Pollutants
- 9.4. Market Analysis, Insights and Forecast - by End User
- 9.4.1. Residential and Commercial
- 9.4.2. Power Generation
- 9.4.3. Petrochemicals
- 9.4.4. Other End Users
- 9.5. Market Analysis, Insights and Forecast - by Geography
- 9.5.1. Saudi Arabia
- 9.5.2. United Arab Emirates
- 9.5.3. Rest of Middle-East and Africa
- 9.1. Market Analysis, Insights and Forecast - by Product Type
- 10. Competitive Analysis
- 10.1. Company Profiles
- 10.1.1 Honeywell International Inc
- 10.1.1.1. Company Overview
- 10.1.1.2. Products
- 10.1.1.3. Company Financials
- 10.1.1.4. SWOT Analysis
- 10.1.2 Horiba Ltd
- 10.1.2.1. Company Overview
- 10.1.2.2. Products
- 10.1.2.3. Company Financials
- 10.1.2.4. SWOT Analysis
- 10.1.3 Agilent Technologies Inc *List Not Exhaustive
- 10.1.3.1. Company Overview
- 10.1.3.2. Products
- 10.1.3.3. Company Financials
- 10.1.3.4. SWOT Analysis
- 10.1.4 TSI Inc
- 10.1.4.1. Company Overview
- 10.1.4.2. Products
- 10.1.4.3. Company Financials
- 10.1.4.4. SWOT Analysis
- 10.1.5 Thermo Fisher Scientific Inc
- 10.1.5.1. Company Overview
- 10.1.5.2. Products
- 10.1.5.3. Company Financials
- 10.1.5.4. SWOT Analysis
- 10.1.6 Emerson Electric Co
- 10.1.6.1. Company Overview
- 10.1.6.2. Products
- 10.1.6.3. Company Financials
- 10.1.6.4. SWOT Analysis
- 10.1.7 Siemens AG
- 10.1.7.1. Company Overview
- 10.1.7.2. Products
- 10.1.7.3. Company Financials
- 10.1.7.4. SWOT Analysis
- 10.1.8 3M Co
- 10.1.8.1. Company Overview
- 10.1.8.2. Products
- 10.1.8.3. Company Financials
- 10.1.8.4. SWOT Analysis
- 10.1.9 Teledyne Technologies Inc
- 10.1.9.1. Company Overview
- 10.1.9.2. Products
- 10.1.9.3. Company Financials
- 10.1.9.4. SWOT Analysis
- 10.1.1 Honeywell International Inc
- 10.2. Market Entropy
- 10.2.1 Company's Key Areas Served
- 10.2.2 Recent Developments
- 10.3. Company Market Share Analysis 2025
- 10.3.1 Top 5 Companies Market Share Analysis
- 10.3.2 Top 3 Companies Market Share Analysis
- 10.4. List of Potential Customers
- 11. Research Methodology
List of Figures
- Figure 1: MEA Air Quality Monitoring Market Revenue Breakdown (billion, %) by Product 2025 & 2033
- Figure 2: MEA Air Quality Monitoring Market Share (%) by Company 2025
List of Tables
- Table 1: MEA Air Quality Monitoring Market Revenue billion Forecast, by Product Type 2020 & 2033
- Table 2: MEA Air Quality Monitoring Market Revenue billion Forecast, by Sampling Method 2020 & 2033
- Table 3: MEA Air Quality Monitoring Market Revenue billion Forecast, by Pollutant Type 2020 & 2033
- Table 4: MEA Air Quality Monitoring Market Revenue billion Forecast, by End User 2020 & 2033
- Table 5: MEA Air Quality Monitoring Market Revenue billion Forecast, by Geography 2020 & 2033
- Table 6: MEA Air Quality Monitoring Market Revenue billion Forecast, by Region 2020 & 2033
- Table 7: MEA Air Quality Monitoring Market Revenue billion Forecast, by Product Type 2020 & 2033
- Table 8: MEA Air Quality Monitoring Market Revenue billion Forecast, by Sampling Method 2020 & 2033
- Table 9: MEA Air Quality Monitoring Market Revenue billion Forecast, by Pollutant Type 2020 & 2033
- Table 10: MEA Air Quality Monitoring Market Revenue billion Forecast, by End User 2020 & 2033
- Table 11: MEA Air Quality Monitoring Market Revenue billion Forecast, by Geography 2020 & 2033
- Table 12: MEA Air Quality Monitoring Market Revenue billion Forecast, by Country 2020 & 2033
- Table 13: MEA Air Quality Monitoring Market Revenue billion Forecast, by Product Type 2020 & 2033
- Table 14: MEA Air Quality Monitoring Market Revenue billion Forecast, by Sampling Method 2020 & 2033
- Table 15: MEA Air Quality Monitoring Market Revenue billion Forecast, by Pollutant Type 2020 & 2033
- Table 16: MEA Air Quality Monitoring Market Revenue billion Forecast, by End User 2020 & 2033
- Table 17: MEA Air Quality Monitoring Market Revenue billion Forecast, by Geography 2020 & 2033
- Table 18: MEA Air Quality Monitoring Market Revenue billion Forecast, by Country 2020 & 2033
- Table 19: MEA Air Quality Monitoring Market Revenue billion Forecast, by Product Type 2020 & 2033
- Table 20: MEA Air Quality Monitoring Market Revenue billion Forecast, by Sampling Method 2020 & 2033
- Table 21: MEA Air Quality Monitoring Market Revenue billion Forecast, by Pollutant Type 2020 & 2033
- Table 22: MEA Air Quality Monitoring Market Revenue billion Forecast, by End User 2020 & 2033
- Table 23: MEA Air Quality Monitoring Market Revenue billion Forecast, by Geography 2020 & 2033
- Table 24: MEA Air Quality Monitoring Market Revenue billion Forecast, by Country 2020 & 2033
Frequently Asked Questions
1. What is the projected Compound Annual Growth Rate (CAGR) of the MEA Air Quality Monitoring Market?
The projected CAGR is approximately 6.2%.
2. Which companies are prominent players in the MEA Air Quality Monitoring Market?
Key companies in the market include Honeywell International Inc, Horiba Ltd, Agilent Technologies Inc *List Not Exhaustive, TSI Inc, Thermo Fisher Scientific Inc, Emerson Electric Co, Siemens AG, 3M Co, Teledyne Technologies Inc.
3. What are the main segments of the MEA Air Quality Monitoring Market?
The market segments include Product Type, Sampling Method, Pollutant Type, End User, Geography.
4. Can you provide details about the market size?
The market size is estimated to be USD 5.5 billion as of 2022.
5. What are some drivers contributing to market growth?
4.; Increasing Awareness and Favorable Government Policies and Non-government Initiatives for Curbing Air Pollution.
6. What are the notable trends driving market growth?
The Outdoor Monitor Segment is Expected to be the Fastest growing Segment.
7. Are there any restraints impacting market growth?
4.; High Costs of Air Quality Monitoring Systems.
8. Can you provide examples of recent developments in the market?
July 2022: Ajman Free Zone established an ambient air quality monitoring system in Gate 2 of its industrial sector in collaboration with the Municipality and Planning Department of Ajman. As part of the project, the free zone implemented cutting-edge AirSense technology to measure and evaluate the industrial area's pollution levels by current international regulations.
9. What pricing options are available for accessing the report?
Pricing options include single-user, multi-user, and enterprise licenses priced at USD 4750, USD 5250, and USD 8750 respectively.
10. Is the market size provided in terms of value or volume?
The market size is provided in terms of value, measured in billion.
11. Are there any specific market keywords associated with the report?
Yes, the market keyword associated with the report is "MEA Air Quality Monitoring Market," which aids in identifying and referencing the specific market segment covered.
12. How do I determine which pricing option suits my needs best?
The pricing options vary based on user requirements and access needs. Individual users may opt for single-user licenses, while businesses requiring broader access may choose multi-user or enterprise licenses for cost-effective access to the report.
13. Are there any additional resources or data provided in the MEA Air Quality Monitoring Market report?
While the report offers comprehensive insights, it's advisable to review the specific contents or supplementary materials provided to ascertain if additional resources or data are available.
14. How can I stay updated on further developments or reports in the MEA Air Quality Monitoring Market?
To stay informed about further developments, trends, and reports in the MEA Air Quality Monitoring Market, consider subscribing to industry newsletters, following relevant companies and organizations, or regularly checking reputable industry news sources and publications.
Methodology
Step 1 - Identification of Relevant Samples Size from Population Database


Step 2 - Approaches for Defining Global Market Size (Value, Volume* & Price*)

Note*: In applicable scenarios
Step 3 - Data Sources
Primary Research
- Web Analytics
- Survey Reports
- Research Institute
- Latest Research Reports
- Opinion Leaders
Secondary Research
- Annual Reports
- White Paper
- Latest Press Release
- Industry Association
- Paid Database
- Investor Presentations

Step 4 - Data Triangulation
Involves using different sources of information in order to increase the validity of a study
These sources are likely to be stakeholders in a program - participants, other researchers, program staff, other community members, and so on.
Then we put all data in single framework & apply various statistical tools to find out the dynamic on the market.
During the analysis stage, feedback from the stakeholder groups would be compared to determine areas of agreement as well as areas of divergence