

Key Insights
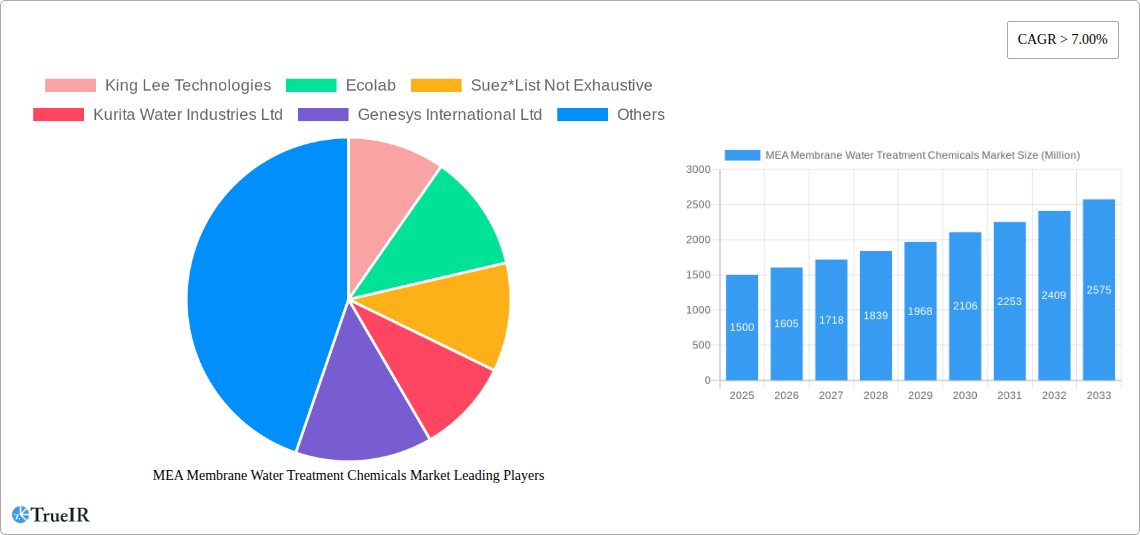
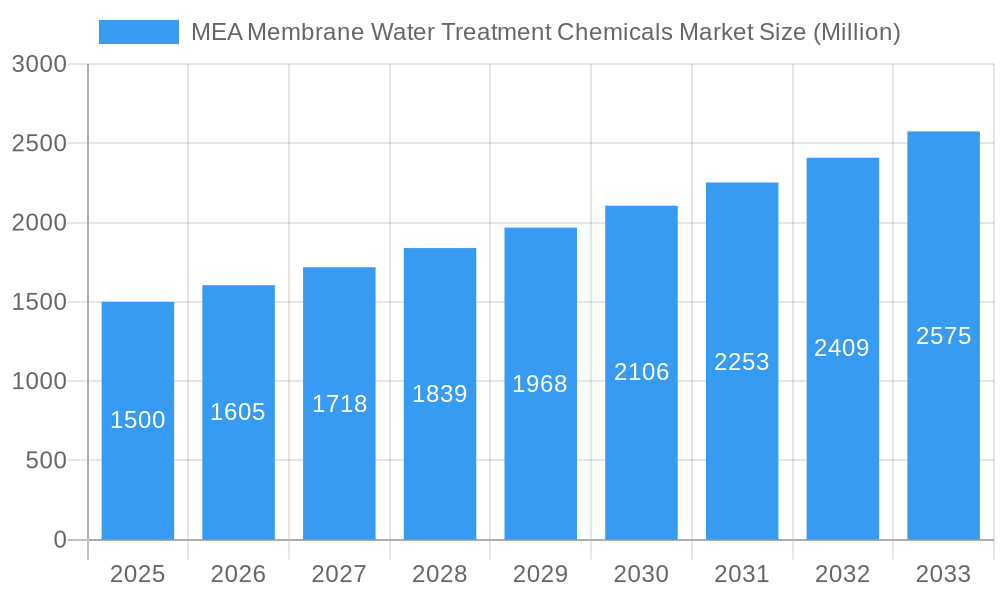
The MEA Membrane Water Treatment Chemicals market is poised for significant expansion, projected to reach $2.4 billion by 2025, with a Compound Annual Growth Rate (CAGR) of 6.1%. This growth is propelled by escalating water scarcity, stringent environmental mandates, and the burgeoning desalination and industrial sectors across the Middle East and Africa. Key growth drivers include population expansion, rapid urbanization, and industrial development in nations such as Saudi Arabia and the UAE, intensifying water demand and necessitating advanced treatment technologies. The market also benefits from a rising emphasis on water reuse and recycling for sustainable water management. The market is segmented by chemical type, including pre-treatment, biological controllers, and other specialty chemicals, and by end-user industry, encompassing food and beverage, desalination, healthcare, municipal, chemicals, power, and others. Desalination plants, critical for water supply in the region, contribute substantially to market growth due to their high chemical consumption. The increasing adoption of membrane technologies like reverse osmosis and ultrafiltration further stimulates demand for associated chemicals. While economic volatility presents potential challenges, substantial government investment in water infrastructure and continuous innovation in sustainable water treatment solutions ensure a positive long-term outlook.
MEA Membrane Water Treatment Chemicals Market Market Size (In Billion)
The competitive environment features a blend of international and regional enterprises, including prominent players like Ecolab, Suez, and Kurita Water Industries. Strategic collaborations, mergers, and acquisitions are expected to reshape market dynamics. Furthermore, the growing demand for eco-friendly chemicals and sustainable water treatment practices is influencing product innovation and market trends. The UAE and Saudi Arabia currently lead the MEA market, driven by substantial investments in water infrastructure and desalination projects. While other countries demonstrate growth potential, their market contribution is currently smaller. The forecast period from 2025 to 2033 anticipates sustained expansion, fueled by robust sectoral growth and ongoing initiatives to combat water scarcity throughout the Middle East and Africa.
MEA Membrane Water Treatment Chemicals Market Company Market Share
MEA Membrane Water Treatment Chemicals Market: A Comprehensive Report (2019-2033)
This comprehensive report provides a detailed analysis of the MEA Membrane Water Treatment Chemicals Market, offering invaluable insights for industry stakeholders, investors, and researchers. Covering the period from 2019 to 2033, with 2025 as the base year, this study unveils market dynamics, competitive landscapes, and future growth potential. The report leverages extensive data analysis to forecast market trends and identify key opportunities within the MEA region.
MEA Membrane Water Treatment Chemicals Market Structure & Competitive Landscape
The MEA Membrane Water Treatment Chemicals market exhibits a moderately concentrated structure, with several multinational corporations and regional players vying for market share. The Herfindahl-Hirschman Index (HHI) for 2024 is estimated at xx, indicating a moderately concentrated market. Innovation is a crucial driver, with companies investing heavily in research and development to create more efficient and sustainable chemical solutions. Stringent environmental regulations across the MEA region are also significantly impacting the market, favoring companies that offer environmentally friendly products. Product substitution, primarily from bio-based alternatives, is also emerging as a factor. The market is segmented by chemical type (pre-treatment, biological controllers, other chemical types) and end-user industry (food and beverage processing, desalination, healthcare, municipal, chemicals, power, other end-user industries).
Mergers and acquisitions (M&A) activity has been significant, with notable deals like the USD 5.25 billion acquisition of Solenis by Platinum Equity in November 2021 significantly reshaping the competitive landscape. This consolidation trend is expected to continue, driven by the need for companies to expand their geographical reach and product portfolios.
- Market Concentration: Moderately concentrated, HHI (2024) estimated at xx.
- Innovation Drivers: Development of sustainable and efficient water treatment chemicals.
- Regulatory Impacts: Stringent environmental regulations influencing product choices.
- Product Substitutes: Emergence of bio-based alternatives.
- End-User Segmentation: Significant diversity across various industries.
- M&A Trends: Consolidation driven by expansion and portfolio diversification. (e.g., Solenis acquisition).
MEA Membrane Water Treatment Chemicals Market Market Trends & Opportunities
The MEA Membrane Water Treatment Chemicals market is poised for substantial expansion, with projections indicating it will reach a valuation of [Insert Specific Market Value Here, e.g., USD X Billion] by 2033. This growth trajectory is expected to be underpinned by a Compound Annual Growth Rate (CAGR) of approximately [Insert Specific CAGR Here, e.g., XX%] during the forecast period of 2025-2033. Several key factors are fueling this upward trend. The escalating global concern over water scarcity, particularly in the arid regions of the Middle East and Africa, is a primary driver. Concurrently, the demand for high-purity water across diverse industrial sectors, including petrochemicals, power generation, and food and beverage, is on a continuous rise. Governments across the MEA region are increasingly prioritizing water security through robust initiatives aimed at promoting water conservation, implementing efficient water management strategies, and encouraging the adoption of advanced water treatment technologies. Technological advancements are also playing a pivotal role, with significant innovations in membrane filtration technologies – such as reverse osmosis, ultrafiltration, and nanofiltration – leading to more effective and cost-efficient treatment processes. The development of novel, high-performance chemical formulations, including antiscalants, biocides, and cleaning agents, specifically designed for membrane systems, further bolsters market growth. A growing consumer and industrial preference for environmentally friendly and sustainable water treatment solutions is also a considerable influence, pushing manufacturers towards greener chemical options. The competitive landscape is dynamic and highly competitive, characterized by the strategic endeavors of major industry players. These companies are actively engaged in groundbreaking product innovation, relentless cost optimization strategies, and the formation of strategic alliances and partnerships to solidify their market position and expand their geographical reach. Market penetration rates exhibit considerable variation across different sub-segments and geographical areas. Developed economies within the MEA region are witnessing higher adoption rates, while developing regions present significant untapped growth potential for membrane water treatment chemicals.
Dominant Markets & Segments in MEA Membrane Water Treatment Chemicals Market
The desalination segment holds the largest market share within the end-user industry segment, driven by the growing need for freshwater in water-scarce regions. The pre-treatment chemicals segment dominates the chemical type category, owing to their crucial role in optimizing membrane performance.
- Leading Region: The GCC region is expected to dominate, driven by substantial investments in desalination infrastructure.
- Leading Country: Saudi Arabia and UAE are leading countries within the GCC, due to water scarcity issues.
- Dominant Chemical Type: Pre-treatment chemicals account for the largest market share.
- Key Growth Drivers:
- Increasing water scarcity across the MEA region.
- Substantial investments in desalination and water treatment infrastructure.
- Government initiatives promoting water conservation and efficient water management.
- Growing demand from various end-user industries.
MEA Membrane Water Treatment Chemicals Market Product Analysis
The MEA membrane water treatment chemicals market showcases diverse products tailored to specific applications, including pre-treatment chemicals for removing impurities, biocides to prevent microbial growth, and other specialized chemicals for enhancing membrane performance. Innovation focuses on developing environmentally benign, high-performance chemicals with reduced environmental footprint and improved efficacy. These advancements cater to growing industry demand for sustainable and cost-effective solutions addressing water scarcity and stringent regulatory requirements.
Key Drivers, Barriers & Challenges in MEA Membrane Water Treatment Chemicals Market
Key Drivers: Growing water scarcity, increasing industrialization and urbanization, stringent environmental regulations promoting water reuse and recycling, and rising government investments in water infrastructure projects are key drivers.
Challenges: Fluctuations in raw material prices, supply chain disruptions, stringent regulatory compliance requirements, and intense competition among numerous players pose significant challenges. These challenges can lead to price volatility and hinder market growth. The impact of these challenges can be quantified by analyzing their effects on profit margins and market expansion rates. For instance, increased raw material costs can directly reduce profit margins, while regulatory hurdles might delay product launches and market entry.
Growth Drivers in the MEA Membrane Water Treatment Chemicals Market Market
The MEA membrane water treatment chemicals market is propelled by a confluence of powerful growth drivers. The persistent and increasing water scarcity across the region remains a paramount concern, necessitating advanced treatment solutions. Significant investments in large-scale desalination plants, crucial for augmenting freshwater supply, directly translate into higher demand for specialized membrane treatment chemicals. Furthermore, a tightening regulatory framework and increasingly stringent environmental regulations concerning water discharge quality and resource management are compelling industries to adopt more effective and compliant water treatment practices, thereby boosting the market for membrane chemicals. Technological advancements continue to be a significant catalyst. Innovations in membrane materials and configurations are enhancing performance and longevity, while the concurrent development of advanced chemical formulations, tailored to optimize membrane operations and extend their lifespan, are key contributors to market expansion. Government policies and initiatives actively promoting water conservation, the implementation of smart water management systems, and the incentivization of eco-friendly water treatment technologies are further solidifying the growth trajectory of this market.
Challenges Impacting MEA Membrane Water Treatment Chemicals Market Growth
Despite the robust growth potential, the MEA membrane water treatment chemicals market faces several significant challenges that could impede its expansion. The inherent volatility in the prices of raw materials, which are crucial for the production of these chemicals, can lead to unpredictable cost fluctuations and impact profit margins. Potential disruptions in global and regional supply chains, stemming from geopolitical factors, logistical issues, or unforeseen events, can affect the availability and timely delivery of essential chemicals. Navigating complex and evolving regulatory compliance requirements across different countries within the MEA region can be challenging and resource-intensive for market players. Moreover, the market is characterized by intense competition, not only among established global leaders but also from emerging local and regional players, which can lead to price pressures and necessitate continuous innovation and differentiation.
Significant MEA Membrane Water Treatment Chemicals Market Industry Milestones
- November 2021: Platinum Equity's acquisition of Solenis, significantly expanding its global presence and product portfolio. This merger significantly altered the competitive landscape, increasing Solenis's market share and production capacity.
Future Outlook for MEA Membrane Water Treatment Chemicals Market Market
The MEA membrane water treatment chemicals market is exceptionally well-positioned for sustained and accelerated growth in the foreseeable future. The persistent and deepening water scarcity, coupled with the expanding industrial and economic activities across the region, will continue to drive the demand for advanced water treatment solutions. Significant government and private sector investments in developing and upgrading water infrastructure, including desalination facilities and wastewater treatment plants, will create substantial market opportunities. The future of this market will be intrinsically shaped by strategic collaborations between chemical manufacturers, membrane providers, and end-users, fostering innovation and tailored solutions. Continuous technological advancements will focus on developing more efficient, cost-effective, and environmentally sustainable chemical formulations that enhance membrane performance, reduce fouling, and minimize operational downtime. The increasing global emphasis on sustainability and circular economy principles will further propel the demand for "green" chemicals and advanced treatment processes that minimize environmental impact. Opportunities abound for market players to cater to the specific water treatment needs of various industries, develop chemicals that offer superior performance and economic benefits, and contribute to the growing demand for eco-friendly and responsible water management solutions. The market is anticipated to witness remarkable expansion, particularly within the rapidly developing economies and emerging industrial hubs located throughout the MEA region.
MEA Membrane Water Treatment Chemicals Market Segmentation
-
1. Chemical Type
- 1.1. Pre-treatment
- 1.2. Biological Controllers
- 1.3. Other Chemical Types
-
2. End-user Industry
- 2.1. Food and Beverage Processing
- 2.2. Desalination
- 2.3. Healthcare
- 2.4. Municipal
- 2.5. Chemicals
- 2.6. Power
- 2.7. Other End-user Industries
-
3. Geography
- 3.1. Saudi Arabia
- 3.2. South Africa
- 3.3. Qatar
- 3.4. United Arab Emirates
- 3.5. Egypt
- 3.6. Rest of Middle-East and Africa
MEA Membrane Water Treatment Chemicals Market Segmentation By Geography
- 1. Saudi Arabia
- 2. South Africa
- 3. Qatar
- 4. United Arab Emirates
- 5. Egypt
- 6. Rest of Middle East and Africa
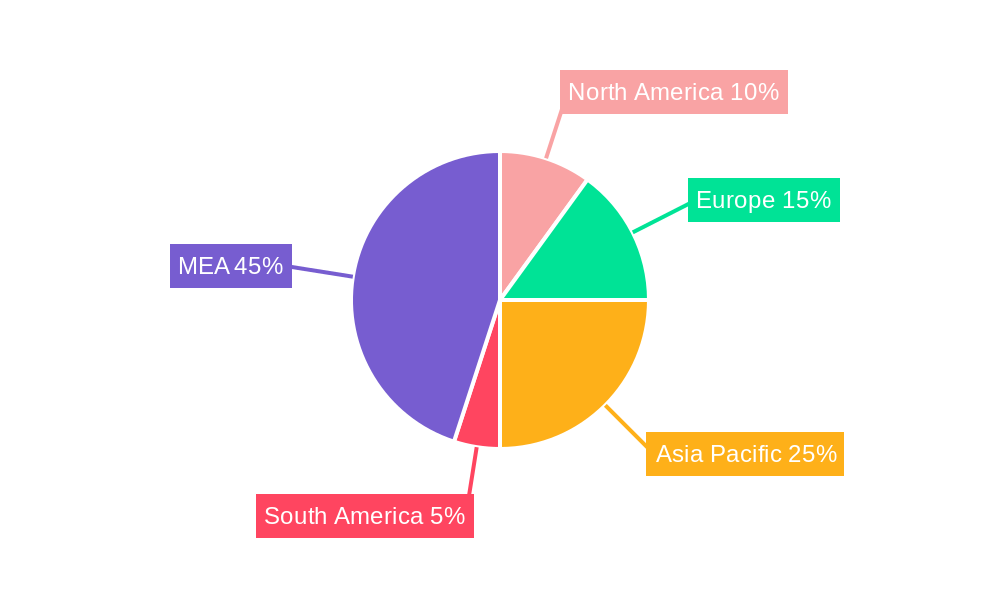
MEA Membrane Water Treatment Chemicals Market Regional Market Share
Geographic Coverage of MEA Membrane Water Treatment Chemicals Market
MEA Membrane Water Treatment Chemicals Market REPORT HIGHLIGHTS
| Aspects | Details |
|---|---|
| Study Period | 2020-2034 |
| Base Year | 2025 |
| Estimated Year | 2026 |
| Forecast Period | 2026-2034 |
| Historical Period | 2020-2025 |
| Growth Rate | CAGR of 6.1% from 2020-2034 |
| Segmentation |
|
Table of Contents
- 1. Introduction
- 1.1. Research Scope
- 1.2. Market Segmentation
- 1.3. Research Objective
- 1.4. Definitions and Assumptions
- 2. Executive Summary
- 2.1. Market Snapshot
- 3. Market Dynamics
- 3.1. Market Drivers
- 3.2. Market Restrains
- 3.3. Market Trends
- 3.4. Market Opportunities
- 4. Market Factor Analysis
- 4.1. Porters Five Forces
- 4.1.1. Bargaining Power of Suppliers
- 4.1.2. Bargaining Power of Buyers
- 4.1.3. Threat of New Entrants
- 4.1.4. Threat of Substitutes
- 4.1.5. Competitive Rivalry
- 4.2. PESTEL analysis
- 4.3. BCG Analysis
- 4.3.1. Stars (High Growth, High Market Share)
- 4.3.2. Cash Cows (Low Growth, High Market Share)
- 4.3.3. Question Mark (High Growth, Low Market Share)
- 4.3.4. Dogs (Low Growth, Low Market Share)
- 4.4. Ansoff Matrix Analysis
- 4.5. Supply Chain Analysis
- 4.6. Regulatory Landscape
- 4.7. Current Market Potential and Opportunity Assessment (TAM–SAM–SOM Framework)
- 4.8. TIR Analyst Note
- 4.1. Porters Five Forces
- 5. Market Analysis, Insights and Forecast 2021-2033
- 5.1. Market Analysis, Insights and Forecast - by Chemical Type
- 5.1.1. Pre-treatment
- 5.1.2. Biological Controllers
- 5.1.3. Other Chemical Types
- 5.2. Market Analysis, Insights and Forecast - by End-user Industry
- 5.2.1. Food and Beverage Processing
- 5.2.2. Desalination
- 5.2.3. Healthcare
- 5.2.4. Municipal
- 5.2.5. Chemicals
- 5.2.6. Power
- 5.2.7. Other End-user Industries
- 5.3. Market Analysis, Insights and Forecast - by Geography
- 5.3.1. Saudi Arabia
- 5.3.2. South Africa
- 5.3.3. Qatar
- 5.3.4. United Arab Emirates
- 5.3.5. Egypt
- 5.3.6. Rest of Middle-East and Africa
- 5.4. Market Analysis, Insights and Forecast - by Region
- 5.4.1. Saudi Arabia
- 5.4.2. South Africa
- 5.4.3. Qatar
- 5.4.4. United Arab Emirates
- 5.4.5. Egypt
- 5.4.6. Rest of Middle East and Africa
- 5.1. Market Analysis, Insights and Forecast - by Chemical Type
- 6. Global MEA Membrane Water Treatment Chemicals Market Analysis, Insights and Forecast, 2021-2033
- 6.1. Market Analysis, Insights and Forecast - by Chemical Type
- 6.1.1. Pre-treatment
- 6.1.2. Biological Controllers
- 6.1.3. Other Chemical Types
- 6.2. Market Analysis, Insights and Forecast - by End-user Industry
- 6.2.1. Food and Beverage Processing
- 6.2.2. Desalination
- 6.2.3. Healthcare
- 6.2.4. Municipal
- 6.2.5. Chemicals
- 6.2.6. Power
- 6.2.7. Other End-user Industries
- 6.3. Market Analysis, Insights and Forecast - by Geography
- 6.3.1. Saudi Arabia
- 6.3.2. South Africa
- 6.3.3. Qatar
- 6.3.4. United Arab Emirates
- 6.3.5. Egypt
- 6.3.6. Rest of Middle-East and Africa
- 6.1. Market Analysis, Insights and Forecast - by Chemical Type
- 7. Saudi Arabia MEA Membrane Water Treatment Chemicals Market Analysis, Insights and Forecast, 2020-2032
- 7.1. Market Analysis, Insights and Forecast - by Chemical Type
- 7.1.1. Pre-treatment
- 7.1.2. Biological Controllers
- 7.1.3. Other Chemical Types
- 7.2. Market Analysis, Insights and Forecast - by End-user Industry
- 7.2.1. Food and Beverage Processing
- 7.2.2. Desalination
- 7.2.3. Healthcare
- 7.2.4. Municipal
- 7.2.5. Chemicals
- 7.2.6. Power
- 7.2.7. Other End-user Industries
- 7.3. Market Analysis, Insights and Forecast - by Geography
- 7.3.1. Saudi Arabia
- 7.3.2. South Africa
- 7.3.3. Qatar
- 7.3.4. United Arab Emirates
- 7.3.5. Egypt
- 7.3.6. Rest of Middle-East and Africa
- 7.1. Market Analysis, Insights and Forecast - by Chemical Type
- 8. South Africa MEA Membrane Water Treatment Chemicals Market Analysis, Insights and Forecast, 2020-2032
- 8.1. Market Analysis, Insights and Forecast - by Chemical Type
- 8.1.1. Pre-treatment
- 8.1.2. Biological Controllers
- 8.1.3. Other Chemical Types
- 8.2. Market Analysis, Insights and Forecast - by End-user Industry
- 8.2.1. Food and Beverage Processing
- 8.2.2. Desalination
- 8.2.3. Healthcare
- 8.2.4. Municipal
- 8.2.5. Chemicals
- 8.2.6. Power
- 8.2.7. Other End-user Industries
- 8.3. Market Analysis, Insights and Forecast - by Geography
- 8.3.1. Saudi Arabia
- 8.3.2. South Africa
- 8.3.3. Qatar
- 8.3.4. United Arab Emirates
- 8.3.5. Egypt
- 8.3.6. Rest of Middle-East and Africa
- 8.1. Market Analysis, Insights and Forecast - by Chemical Type
- 9. Qatar MEA Membrane Water Treatment Chemicals Market Analysis, Insights and Forecast, 2020-2032
- 9.1. Market Analysis, Insights and Forecast - by Chemical Type
- 9.1.1. Pre-treatment
- 9.1.2. Biological Controllers
- 9.1.3. Other Chemical Types
- 9.2. Market Analysis, Insights and Forecast - by End-user Industry
- 9.2.1. Food and Beverage Processing
- 9.2.2. Desalination
- 9.2.3. Healthcare
- 9.2.4. Municipal
- 9.2.5. Chemicals
- 9.2.6. Power
- 9.2.7. Other End-user Industries
- 9.3. Market Analysis, Insights and Forecast - by Geography
- 9.3.1. Saudi Arabia
- 9.3.2. South Africa
- 9.3.3. Qatar
- 9.3.4. United Arab Emirates
- 9.3.5. Egypt
- 9.3.6. Rest of Middle-East and Africa
- 9.1. Market Analysis, Insights and Forecast - by Chemical Type
- 10. United Arab Emirates MEA Membrane Water Treatment Chemicals Market Analysis, Insights and Forecast, 2020-2032
- 10.1. Market Analysis, Insights and Forecast - by Chemical Type
- 10.1.1. Pre-treatment
- 10.1.2. Biological Controllers
- 10.1.3. Other Chemical Types
- 10.2. Market Analysis, Insights and Forecast - by End-user Industry
- 10.2.1. Food and Beverage Processing
- 10.2.2. Desalination
- 10.2.3. Healthcare
- 10.2.4. Municipal
- 10.2.5. Chemicals
- 10.2.6. Power
- 10.2.7. Other End-user Industries
- 10.3. Market Analysis, Insights and Forecast - by Geography
- 10.3.1. Saudi Arabia
- 10.3.2. South Africa
- 10.3.3. Qatar
- 10.3.4. United Arab Emirates
- 10.3.5. Egypt
- 10.3.6. Rest of Middle-East and Africa
- 10.1. Market Analysis, Insights and Forecast - by Chemical Type
- 11. Egypt MEA Membrane Water Treatment Chemicals Market Analysis, Insights and Forecast, 2020-2032
- 11.1. Market Analysis, Insights and Forecast - by Chemical Type
- 11.1.1. Pre-treatment
- 11.1.2. Biological Controllers
- 11.1.3. Other Chemical Types
- 11.2. Market Analysis, Insights and Forecast - by End-user Industry
- 11.2.1. Food and Beverage Processing
- 11.2.2. Desalination
- 11.2.3. Healthcare
- 11.2.4. Municipal
- 11.2.5. Chemicals
- 11.2.6. Power
- 11.2.7. Other End-user Industries
- 11.3. Market Analysis, Insights and Forecast - by Geography
- 11.3.1. Saudi Arabia
- 11.3.2. South Africa
- 11.3.3. Qatar
- 11.3.4. United Arab Emirates
- 11.3.5. Egypt
- 11.3.6. Rest of Middle-East and Africa
- 11.1. Market Analysis, Insights and Forecast - by Chemical Type
- 12. Rest of Middle East and Africa MEA Membrane Water Treatment Chemicals Market Analysis, Insights and Forecast, 2020-2032
- 12.1. Market Analysis, Insights and Forecast - by Chemical Type
- 12.1.1. Pre-treatment
- 12.1.2. Biological Controllers
- 12.1.3. Other Chemical Types
- 12.2. Market Analysis, Insights and Forecast - by End-user Industry
- 12.2.1. Food and Beverage Processing
- 12.2.2. Desalination
- 12.2.3. Healthcare
- 12.2.4. Municipal
- 12.2.5. Chemicals
- 12.2.6. Power
- 12.2.7. Other End-user Industries
- 12.3. Market Analysis, Insights and Forecast - by Geography
- 12.3.1. Saudi Arabia
- 12.3.2. South Africa
- 12.3.3. Qatar
- 12.3.4. United Arab Emirates
- 12.3.5. Egypt
- 12.3.6. Rest of Middle-East and Africa
- 12.1. Market Analysis, Insights and Forecast - by Chemical Type
- 13. Competitive Analysis
- 13.1. Company Profiles
- 13.1.1 King Lee Technologies
- 13.1.1.1. Company Overview
- 13.1.1.2. Products
- 13.1.1.3. Company Financials
- 13.1.1.4. SWOT Analysis
- 13.1.2 Ecolab
- 13.1.2.1. Company Overview
- 13.1.2.2. Products
- 13.1.2.3. Company Financials
- 13.1.2.4. SWOT Analysis
- 13.1.3 Suez*List Not Exhaustive
- 13.1.3.1. Company Overview
- 13.1.3.2. Products
- 13.1.3.3. Company Financials
- 13.1.3.4. SWOT Analysis
- 13.1.4 Kurita Water Industries Ltd
- 13.1.4.1. Company Overview
- 13.1.4.2. Products
- 13.1.4.3. Company Financials
- 13.1.4.4. SWOT Analysis
- 13.1.5 Genesys International Ltd
- 13.1.5.1. Company Overview
- 13.1.5.2. Products
- 13.1.5.3. Company Financials
- 13.1.5.4. SWOT Analysis
- 13.1.6 Italmatch Chemicals SpA
- 13.1.6.1. Company Overview
- 13.1.6.2. Products
- 13.1.6.3. Company Financials
- 13.1.6.4. SWOT Analysis
- 13.1.7 Kemira
- 13.1.7.1. Company Overview
- 13.1.7.2. Products
- 13.1.7.3. Company Financials
- 13.1.7.4. SWOT Analysis
- 13.1.8 Dow
- 13.1.8.1. Company Overview
- 13.1.8.2. Products
- 13.1.8.3. Company Financials
- 13.1.8.4. SWOT Analysis
- 13.1.9 Solenis
- 13.1.9.1. Company Overview
- 13.1.9.2. Products
- 13.1.9.3. Company Financials
- 13.1.9.4. SWOT Analysis
- 13.1.10 AES Arabia Ltd
- 13.1.10.1. Company Overview
- 13.1.10.2. Products
- 13.1.10.3. Company Financials
- 13.1.10.4. SWOT Analysis
- 13.1.11 Toray
- 13.1.11.1. Company Overview
- 13.1.11.2. Products
- 13.1.11.3. Company Financials
- 13.1.11.4. SWOT Analysis
- 13.1.1 King Lee Technologies
- 13.2. Market Entropy
- 13.2.1 Company's Key Areas Served
- 13.2.2 Recent Developments
- 13.3. Company Market Share Analysis 2025
- 13.3.1 Top 5 Companies Market Share Analysis
- 13.3.2 Top 3 Companies Market Share Analysis
- 13.4. List of Potential Customers
- 14. Research Methodology
List of Figures
- Figure 1: Global MEA Membrane Water Treatment Chemicals Market Revenue Breakdown (billion, %) by Region 2025 & 2033
- Figure 2: Saudi Arabia MEA Membrane Water Treatment Chemicals Market Revenue (billion), by Chemical Type 2025 & 2033
- Figure 3: Saudi Arabia MEA Membrane Water Treatment Chemicals Market Revenue Share (%), by Chemical Type 2025 & 2033
- Figure 4: Saudi Arabia MEA Membrane Water Treatment Chemicals Market Revenue (billion), by End-user Industry 2025 & 2033
- Figure 5: Saudi Arabia MEA Membrane Water Treatment Chemicals Market Revenue Share (%), by End-user Industry 2025 & 2033
- Figure 6: Saudi Arabia MEA Membrane Water Treatment Chemicals Market Revenue (billion), by Geography 2025 & 2033
- Figure 7: Saudi Arabia MEA Membrane Water Treatment Chemicals Market Revenue Share (%), by Geography 2025 & 2033
- Figure 8: Saudi Arabia MEA Membrane Water Treatment Chemicals Market Revenue (billion), by Country 2025 & 2033
- Figure 9: Saudi Arabia MEA Membrane Water Treatment Chemicals Market Revenue Share (%), by Country 2025 & 2033
- Figure 10: South Africa MEA Membrane Water Treatment Chemicals Market Revenue (billion), by Chemical Type 2025 & 2033
- Figure 11: South Africa MEA Membrane Water Treatment Chemicals Market Revenue Share (%), by Chemical Type 2025 & 2033
- Figure 12: South Africa MEA Membrane Water Treatment Chemicals Market Revenue (billion), by End-user Industry 2025 & 2033
- Figure 13: South Africa MEA Membrane Water Treatment Chemicals Market Revenue Share (%), by End-user Industry 2025 & 2033
- Figure 14: South Africa MEA Membrane Water Treatment Chemicals Market Revenue (billion), by Geography 2025 & 2033
- Figure 15: South Africa MEA Membrane Water Treatment Chemicals Market Revenue Share (%), by Geography 2025 & 2033
- Figure 16: South Africa MEA Membrane Water Treatment Chemicals Market Revenue (billion), by Country 2025 & 2033
- Figure 17: South Africa MEA Membrane Water Treatment Chemicals Market Revenue Share (%), by Country 2025 & 2033
- Figure 18: Qatar MEA Membrane Water Treatment Chemicals Market Revenue (billion), by Chemical Type 2025 & 2033
- Figure 19: Qatar MEA Membrane Water Treatment Chemicals Market Revenue Share (%), by Chemical Type 2025 & 2033
- Figure 20: Qatar MEA Membrane Water Treatment Chemicals Market Revenue (billion), by End-user Industry 2025 & 2033
- Figure 21: Qatar MEA Membrane Water Treatment Chemicals Market Revenue Share (%), by End-user Industry 2025 & 2033
- Figure 22: Qatar MEA Membrane Water Treatment Chemicals Market Revenue (billion), by Geography 2025 & 2033
- Figure 23: Qatar MEA Membrane Water Treatment Chemicals Market Revenue Share (%), by Geography 2025 & 2033
- Figure 24: Qatar MEA Membrane Water Treatment Chemicals Market Revenue (billion), by Country 2025 & 2033
- Figure 25: Qatar MEA Membrane Water Treatment Chemicals Market Revenue Share (%), by Country 2025 & 2033
- Figure 26: United Arab Emirates MEA Membrane Water Treatment Chemicals Market Revenue (billion), by Chemical Type 2025 & 2033
- Figure 27: United Arab Emirates MEA Membrane Water Treatment Chemicals Market Revenue Share (%), by Chemical Type 2025 & 2033
- Figure 28: United Arab Emirates MEA Membrane Water Treatment Chemicals Market Revenue (billion), by End-user Industry 2025 & 2033
- Figure 29: United Arab Emirates MEA Membrane Water Treatment Chemicals Market Revenue Share (%), by End-user Industry 2025 & 2033
- Figure 30: United Arab Emirates MEA Membrane Water Treatment Chemicals Market Revenue (billion), by Geography 2025 & 2033
- Figure 31: United Arab Emirates MEA Membrane Water Treatment Chemicals Market Revenue Share (%), by Geography 2025 & 2033
- Figure 32: United Arab Emirates MEA Membrane Water Treatment Chemicals Market Revenue (billion), by Country 2025 & 2033
- Figure 33: United Arab Emirates MEA Membrane Water Treatment Chemicals Market Revenue Share (%), by Country 2025 & 2033
- Figure 34: Egypt MEA Membrane Water Treatment Chemicals Market Revenue (billion), by Chemical Type 2025 & 2033
- Figure 35: Egypt MEA Membrane Water Treatment Chemicals Market Revenue Share (%), by Chemical Type 2025 & 2033
- Figure 36: Egypt MEA Membrane Water Treatment Chemicals Market Revenue (billion), by End-user Industry 2025 & 2033
- Figure 37: Egypt MEA Membrane Water Treatment Chemicals Market Revenue Share (%), by End-user Industry 2025 & 2033
- Figure 38: Egypt MEA Membrane Water Treatment Chemicals Market Revenue (billion), by Geography 2025 & 2033
- Figure 39: Egypt MEA Membrane Water Treatment Chemicals Market Revenue Share (%), by Geography 2025 & 2033
- Figure 40: Egypt MEA Membrane Water Treatment Chemicals Market Revenue (billion), by Country 2025 & 2033
- Figure 41: Egypt MEA Membrane Water Treatment Chemicals Market Revenue Share (%), by Country 2025 & 2033
- Figure 42: Rest of Middle East and Africa MEA Membrane Water Treatment Chemicals Market Revenue (billion), by Chemical Type 2025 & 2033
- Figure 43: Rest of Middle East and Africa MEA Membrane Water Treatment Chemicals Market Revenue Share (%), by Chemical Type 2025 & 2033
- Figure 44: Rest of Middle East and Africa MEA Membrane Water Treatment Chemicals Market Revenue (billion), by End-user Industry 2025 & 2033
- Figure 45: Rest of Middle East and Africa MEA Membrane Water Treatment Chemicals Market Revenue Share (%), by End-user Industry 2025 & 2033
- Figure 46: Rest of Middle East and Africa MEA Membrane Water Treatment Chemicals Market Revenue (billion), by Geography 2025 & 2033
- Figure 47: Rest of Middle East and Africa MEA Membrane Water Treatment Chemicals Market Revenue Share (%), by Geography 2025 & 2033
- Figure 48: Rest of Middle East and Africa MEA Membrane Water Treatment Chemicals Market Revenue (billion), by Country 2025 & 2033
- Figure 49: Rest of Middle East and Africa MEA Membrane Water Treatment Chemicals Market Revenue Share (%), by Country 2025 & 2033
List of Tables
- Table 1: Global MEA Membrane Water Treatment Chemicals Market Revenue billion Forecast, by Chemical Type 2020 & 2033
- Table 2: Global MEA Membrane Water Treatment Chemicals Market Revenue billion Forecast, by End-user Industry 2020 & 2033
- Table 3: Global MEA Membrane Water Treatment Chemicals Market Revenue billion Forecast, by Geography 2020 & 2033
- Table 4: Global MEA Membrane Water Treatment Chemicals Market Revenue billion Forecast, by Region 2020 & 2033
- Table 5: Global MEA Membrane Water Treatment Chemicals Market Revenue billion Forecast, by Chemical Type 2020 & 2033
- Table 6: Global MEA Membrane Water Treatment Chemicals Market Revenue billion Forecast, by End-user Industry 2020 & 2033
- Table 7: Global MEA Membrane Water Treatment Chemicals Market Revenue billion Forecast, by Geography 2020 & 2033
- Table 8: Global MEA Membrane Water Treatment Chemicals Market Revenue billion Forecast, by Country 2020 & 2033
- Table 9: Global MEA Membrane Water Treatment Chemicals Market Revenue billion Forecast, by Chemical Type 2020 & 2033
- Table 10: Global MEA Membrane Water Treatment Chemicals Market Revenue billion Forecast, by End-user Industry 2020 & 2033
- Table 11: Global MEA Membrane Water Treatment Chemicals Market Revenue billion Forecast, by Geography 2020 & 2033
- Table 12: Global MEA Membrane Water Treatment Chemicals Market Revenue billion Forecast, by Country 2020 & 2033
- Table 13: Global MEA Membrane Water Treatment Chemicals Market Revenue billion Forecast, by Chemical Type 2020 & 2033
- Table 14: Global MEA Membrane Water Treatment Chemicals Market Revenue billion Forecast, by End-user Industry 2020 & 2033
- Table 15: Global MEA Membrane Water Treatment Chemicals Market Revenue billion Forecast, by Geography 2020 & 2033
- Table 16: Global MEA Membrane Water Treatment Chemicals Market Revenue billion Forecast, by Country 2020 & 2033
- Table 17: Global MEA Membrane Water Treatment Chemicals Market Revenue billion Forecast, by Chemical Type 2020 & 2033
- Table 18: Global MEA Membrane Water Treatment Chemicals Market Revenue billion Forecast, by End-user Industry 2020 & 2033
- Table 19: Global MEA Membrane Water Treatment Chemicals Market Revenue billion Forecast, by Geography 2020 & 2033
- Table 20: Global MEA Membrane Water Treatment Chemicals Market Revenue billion Forecast, by Country 2020 & 2033
- Table 21: Global MEA Membrane Water Treatment Chemicals Market Revenue billion Forecast, by Chemical Type 2020 & 2033
- Table 22: Global MEA Membrane Water Treatment Chemicals Market Revenue billion Forecast, by End-user Industry 2020 & 2033
- Table 23: Global MEA Membrane Water Treatment Chemicals Market Revenue billion Forecast, by Geography 2020 & 2033
- Table 24: Global MEA Membrane Water Treatment Chemicals Market Revenue billion Forecast, by Country 2020 & 2033
- Table 25: Global MEA Membrane Water Treatment Chemicals Market Revenue billion Forecast, by Chemical Type 2020 & 2033
- Table 26: Global MEA Membrane Water Treatment Chemicals Market Revenue billion Forecast, by End-user Industry 2020 & 2033
- Table 27: Global MEA Membrane Water Treatment Chemicals Market Revenue billion Forecast, by Geography 2020 & 2033
- Table 28: Global MEA Membrane Water Treatment Chemicals Market Revenue billion Forecast, by Country 2020 & 2033
Frequently Asked Questions
1. What is the projected Compound Annual Growth Rate (CAGR) of the MEA Membrane Water Treatment Chemicals Market?
The projected CAGR is approximately 6.1%.
2. Which companies are prominent players in the MEA Membrane Water Treatment Chemicals Market?
Key companies in the market include King Lee Technologies, Ecolab, Suez*List Not Exhaustive, Kurita Water Industries Ltd, Genesys International Ltd, Italmatch Chemicals SpA, Kemira, Dow, Solenis, AES Arabia Ltd, Toray.
3. What are the main segments of the MEA Membrane Water Treatment Chemicals Market?
The market segments include Chemical Type, End-user Industry, Geography.
4. Can you provide details about the market size?
The market size is estimated to be USD 2.4 billion as of 2022.
5. What are some drivers contributing to market growth?
Growing Demand for Freshwater; Other Drivers.
6. What are the notable trends driving market growth?
The Desalination Industry is Expected to Dominate the Market.
7. Are there any restraints impacting market growth?
High Capital Cost; Other Restraints.
8. Can you provide examples of recent developments in the market?
In November 2021, Platinum Equity bought Solenis, a prominent worldwide manufacturer of specialty chemicals, from Clayton, Dubilier & Rice (CD&R) and BASF in a USD 5.25 billion deal. Solenis has been fully exited by both CD&R and BASF. Solenis has amalgamated with Sigura Water, an existing Platinum Equity portfolio firm, as part of the transaction. Solenis is expanding its portfolio by acquiring Sigura's residential and commercial pool water and spa treatment sectors. As a result of the transaction, Solenis will now have a worldwide presence of 120 countries, 47 production locations, and over 6,000 people.
9. What pricing options are available for accessing the report?
Pricing options include single-user, multi-user, and enterprise licenses priced at USD 4750, USD 5250, and USD 8750 respectively.
10. Is the market size provided in terms of value or volume?
The market size is provided in terms of value, measured in billion.
11. Are there any specific market keywords associated with the report?
Yes, the market keyword associated with the report is "MEA Membrane Water Treatment Chemicals Market," which aids in identifying and referencing the specific market segment covered.
12. How do I determine which pricing option suits my needs best?
The pricing options vary based on user requirements and access needs. Individual users may opt for single-user licenses, while businesses requiring broader access may choose multi-user or enterprise licenses for cost-effective access to the report.
13. Are there any additional resources or data provided in the MEA Membrane Water Treatment Chemicals Market report?
While the report offers comprehensive insights, it's advisable to review the specific contents or supplementary materials provided to ascertain if additional resources or data are available.
14. How can I stay updated on further developments or reports in the MEA Membrane Water Treatment Chemicals Market?
To stay informed about further developments, trends, and reports in the MEA Membrane Water Treatment Chemicals Market, consider subscribing to industry newsletters, following relevant companies and organizations, or regularly checking reputable industry news sources and publications.
Methodology
Step 1 - Identification of Relevant Samples Size from Population Database


Step 2 - Approaches for Defining Global Market Size (Value, Volume* & Price*)

Note*: In applicable scenarios
Step 3 - Data Sources
Primary Research
- Web Analytics
- Survey Reports
- Research Institute
- Latest Research Reports
- Opinion Leaders
Secondary Research
- Annual Reports
- White Paper
- Latest Press Release
- Industry Association
- Paid Database
- Investor Presentations

Step 4 - Data Triangulation
Involves using different sources of information in order to increase the validity of a study
These sources are likely to be stakeholders in a program - participants, other researchers, program staff, other community members, and so on.
Then we put all data in single framework & apply various statistical tools to find out the dynamic on the market.
During the analysis stage, feedback from the stakeholder groups would be compared to determine areas of agreement as well as areas of divergence