

Key Insights
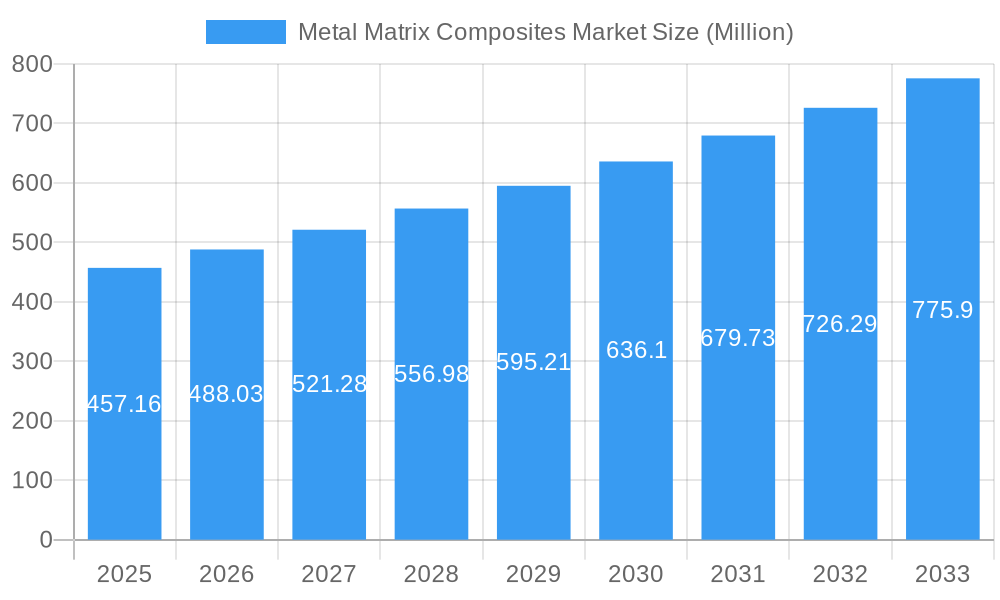
The Metal Matrix Composites (MMC) market, valued at $457.16 million in 2025, is projected to experience robust growth, driven by increasing demand across diverse sectors. The Compound Annual Growth Rate (CAGR) of 6.49% from 2025 to 2033 indicates a significant expansion, fueled primarily by the automotive, aerospace, and energy industries. Lightweighting initiatives in automotive manufacturing, the need for high-performance materials in aerospace applications, and the growing adoption of MMCs in renewable energy technologies are key drivers. Furthermore, ongoing research and development efforts focused on enhancing the properties of MMCs, such as improving their strength, durability, and thermal conductivity, are contributing to market expansion. While challenges such as the relatively high cost of production and potential processing complexities might act as restraints, ongoing innovations and increasing demand are expected to mitigate these factors. The market is segmented by material type (aluminum, magnesium, titanium, etc.), application (aerospace, automotive, electronics, etc.), and region. Leading companies such as 3A Composites, 3M (Ceradyne Inc), and others are actively engaged in developing and supplying advanced MMC solutions to meet growing market demands, fostering innovation and competition within the sector.
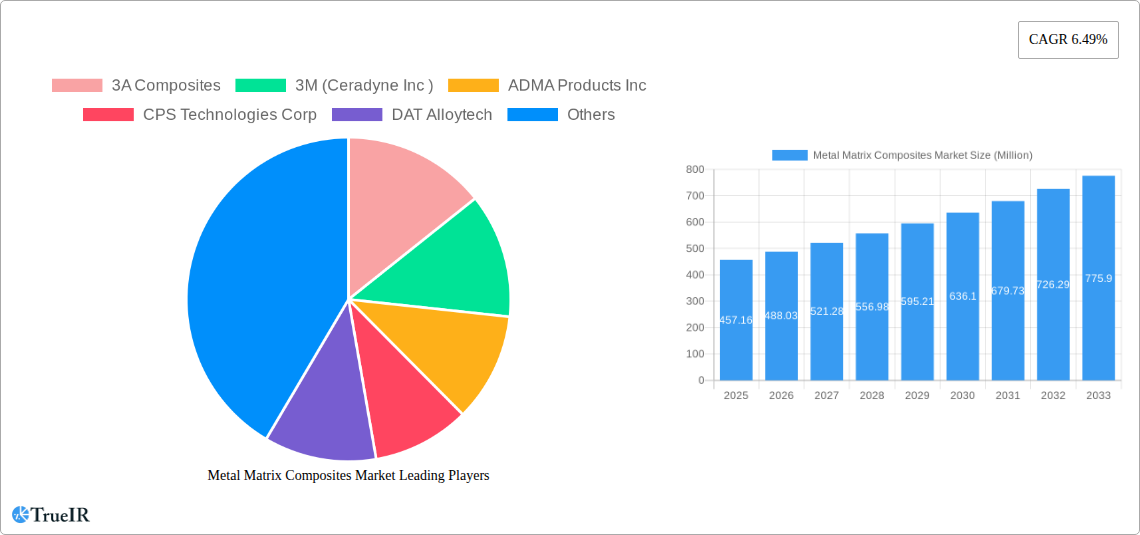
Metal Matrix Composites Market Market Size (In Million)
The forecast period of 2025-2033 presents promising opportunities for the MMC market. Continued technological advancements in manufacturing techniques are anticipated to reduce production costs and improve the overall efficiency of MMCs. Moreover, government initiatives promoting the use of lightweight and high-performance materials in various industries will further propel market growth. This positive outlook, coupled with rising investments in research and development, suggests a sustained period of expansion for the MMC market, creating attractive prospects for existing players and new entrants alike. Strategic partnerships and collaborations among manufacturers, researchers, and end-users are anticipated to accelerate innovation and drive market penetration in emerging applications.
Metal Matrix Composites Market Company Market Share
Metal Matrix Composites Market Report: A Comprehensive Analysis (2019-2033)
This dynamic report provides a comprehensive analysis of the Metal Matrix Composites (MMC) market, offering invaluable insights for industry stakeholders. Leveraging extensive research and data analysis spanning the period 2019-2033 (study period), with a focus on the base year 2025 and forecast period 2025-2033, this report unveils key market trends, growth drivers, and challenges shaping the future of MMCs. The report meticulously analyzes market size, segmentation, competitive landscape, and future opportunities, equipping readers with the knowledge needed to make informed strategic decisions. The estimated market size in 2025 is valued at xx Million.
Metal Matrix Composites Market Structure & Competitive Landscape
The Metal Matrix Composites market exhibits a moderately concentrated structure, with a handful of large players holding significant market share. However, the presence of numerous smaller companies indicates a dynamic and competitive landscape. Innovation plays a crucial role, driving the development of advanced MMCs with enhanced properties. Regulatory frameworks, particularly those concerning material safety and environmental impact, significantly influence market dynamics. Product substitutes, such as advanced polymers and ceramics, pose competitive challenges. The end-user segmentation is diverse, encompassing aerospace, automotive, energy, and electronics industries. Mergers and acquisitions (M&A) activity is moderate, with key players strategically acquiring smaller companies to expand their product portfolios and market reach.
- Market Concentration: The Herfindahl-Hirschman Index (HHI) is estimated at xx, indicating a moderately concentrated market.
- Innovation Drivers: Advancements in materials science, particularly in the development of high-performance matrix materials and reinforcement phases, are driving innovation.
- Regulatory Impacts: Stringent safety and environmental regulations influence material selection and manufacturing processes.
- Product Substitutes: Advanced polymers and ceramics compete with MMCs in specific applications.
- End-User Segmentation: Significant demand comes from aerospace (xx Million), automotive (xx Million), and energy (xx Million) sectors.
- M&A Trends: An average of xx M&A deals per year were recorded during the historical period (2019-2024), with a total deal value of approximately xx Million.
Metal Matrix Composites Market Trends & Opportunities
The Metal Matrix Composites market is experiencing substantial growth, driven by increasing demand from diverse sectors. The market is projected to exhibit a Compound Annual Growth Rate (CAGR) of xx% during the forecast period (2025-2033). Technological advancements, particularly in additive manufacturing and nanocomposite development, are expanding the applications of MMCs. Consumer preferences for lightweight, high-strength materials in various end-use products are fueling market expansion. Intense competition among manufacturers necessitates continuous product innovation and cost optimization. The market penetration rate of MMCs in key industries, such as aerospace and automotive, is gradually increasing, signifying the growing acceptance of these materials.
Dominant Markets & Segments in Metal Matrix Composites Market
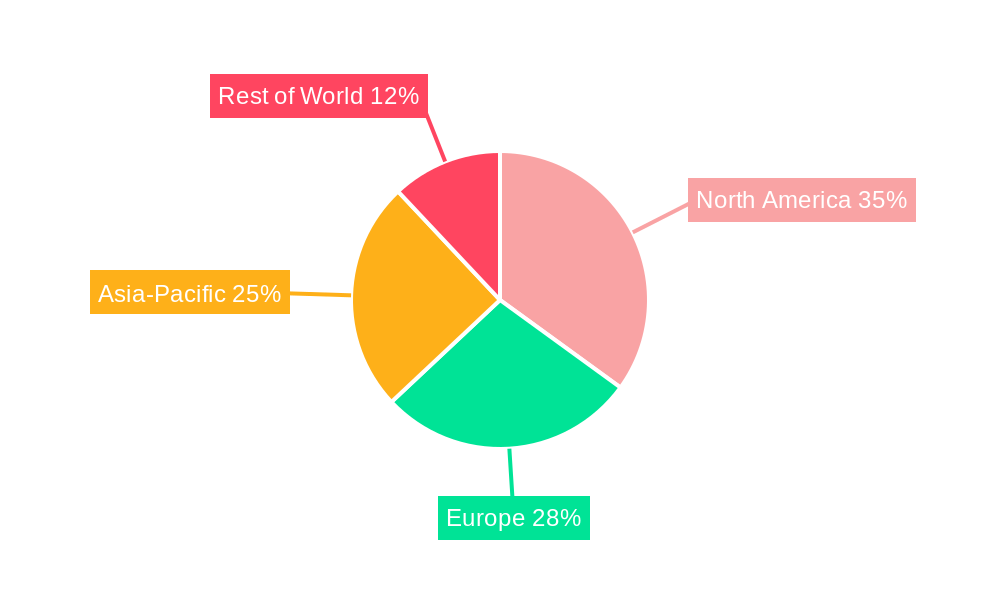
The aerospace sector currently represents the dominant segment in the MMC market, driven by the stringent requirements for lightweight, high-strength materials in aircraft and spacecraft components. North America and Europe are the leading regional markets, owing to the presence of established aerospace and automotive industries. Asia-Pacific is projected to show significant growth in the forecast period.
Key Growth Drivers in Aerospace:
- Stringent weight reduction requirements in aerospace applications.
- Increased demand for high-performance components with superior strength and durability.
- Government initiatives and funding for aerospace research and development.
Key Growth Drivers in Automotive:
- Growing demand for lightweight vehicles to enhance fuel efficiency.
- Rising adoption of electric vehicles necessitates the use of materials with high electrical conductivity.
- Stringent regulations related to vehicle emissions and safety.
Regional Market Dominance: North America holds the largest market share, followed by Europe, with Asia-Pacific showing the fastest growth potential.
Metal Matrix Composites Market Product Analysis
Metal Matrix Composites encompass a wide range of materials, including aluminum matrix composites (AMCs), titanium matrix composites (TMCs), and others. Innovations focus on tailoring the properties of MMCs for specific applications through advanced reinforcement techniques and matrix alloying. This enables the production of MMCs with superior strength-to-weight ratios, enhanced thermal conductivity, and improved wear resistance. The market fit of MMCs is steadily improving as their unique properties offer advantages over conventional materials in high-performance applications.
Key Drivers, Barriers & Challenges in Metal Matrix Composites Market
Key Drivers:
- Technological advancements: Development of novel matrix materials and reinforcement strategies.
- Growing demand from diverse sectors: Aerospace, automotive, and energy industries drive market expansion.
- Stringent regulatory requirements: Push for lightweight, high-performance materials.
Challenges:
- High manufacturing costs: Complex processing techniques lead to higher production expenses.
- Supply chain disruptions: Dependence on specific raw materials can disrupt supply and raise prices.
- Competition from alternative materials: Polymers and ceramics provide alternatives in certain applications.
- Limited availability of skilled labor: Specialized skills are needed for processing and manufacturing.
Growth Drivers in the Metal Matrix Composites Market Market
Technological advancements in materials science, coupled with increasing demand from high-growth industries like aerospace and automotive, are key growth drivers. Government regulations favoring lightweight and high-performance materials are also accelerating market expansion. Furthermore, ongoing research and development efforts are leading to the discovery of innovative composite materials with enhanced properties, further fueling market growth.
Challenges Impacting Metal Matrix Composites Market Growth
High manufacturing costs and the complexity of processing techniques are major barriers. Supply chain vulnerabilities and the availability of specialized raw materials also pose challenges. Intense competition from substitute materials and the need for skilled labor add to the market’s complexities.
Key Players Shaping the Metal Matrix Composites Market Market
- 3A Composites
- 3M (Ceradyne Inc)
- ADMA Products Inc
- CPS Technologies Corp
- DAT Alloytech
- Denka Company Limited
- GKN Sinter Metals Engineering GmbH
- Hitachi Metals Ltd
- Materion Corporation
- MTC Powder Solutions AB
- Plansee Group
- Sumitomo Electric Industries Ltd
- Thermal Transfer Composites LLC
- TISICS Ltd
Significant Metal Matrix Composites Market Industry Milestones
- January 2022: Plansee Group acquired Mi-Tech Tungsten Metals, expanding its market position for tungsten products in North America.
- March 2021: Alvant and 3M established a strategic partnership to advance metal matrix composite technology.
Future Outlook for Metal Matrix Composites Market Market
The Metal Matrix Composites market is poised for continued growth, driven by technological innovations and increasing demand from diverse industries. Strategic partnerships and collaborations among industry players are expected to further accelerate market expansion. The development of novel materials with enhanced properties, coupled with cost-effective manufacturing techniques, will unlock new opportunities and applications for MMCs. The market is projected to witness significant expansion, particularly in the aerospace, automotive, and energy sectors.
Metal Matrix Composites Market Segmentation
-
1. Type
- 1.1. Nickel
- 1.2. Aluminium
- 1.3. Refractory
- 1.4. Other Types
-
2. Fillers
- 2.1. Silicon Carbide
- 2.2. Aluminum Oxide
- 2.3. Titanium Carbide
- 2.4. Other Fillers
-
3. End-user Industry
- 3.1. Automotive and Locomotive
- 3.2. Electrical and Electronics
- 3.3. Aerospace and Defense
- 3.4. Industrial
- 3.5. Other End-user Industries
Metal Matrix Composites Market Segmentation By Geography
-
1. Asia Pacific
- 1.1. China
- 1.2. India
- 1.3. Japan
- 1.4. South Korea
- 1.5. Rest of Asia Pacific
-
2. North America
- 2.1. United States
- 2.2. Canada
- 2.3. Mexico
-
3. Europe
- 3.1. Germany
- 3.2. United Kingdom
- 3.3. Italy
- 3.4. France
- 3.5. Spain
- 3.6. Rest of Europe
-
4. South America
- 4.1. Brazil
- 4.2. Argentina
- 4.3. Rest of South America
-
5. Middle East and Africa
- 5.1. Saudi Arabia
- 5.2. South Africa
- 5.3. Rest of Middle East and Africa
Metal Matrix Composites Market Regional Market Share
Geographic Coverage of Metal Matrix Composites Market
Metal Matrix Composites Market REPORT HIGHLIGHTS
| Aspects | Details |
|---|---|
| Study Period | 2020-2034 |
| Base Year | 2025 |
| Estimated Year | 2026 |
| Forecast Period | 2026-2034 |
| Historical Period | 2020-2025 |
| Growth Rate | CAGR of 6.49% from 2020-2034 |
| Segmentation |
|
Table of Contents
- 1. Introduction
- 1.1. Research Scope
- 1.2. Market Segmentation
- 1.3. Research Objective
- 1.4. Definitions and Assumptions
- 2. Executive Summary
- 2.1. Market Snapshot
- 3. Market Dynamics
- 3.1. Market Drivers
- 3.2. Market Restrains
- 3.3. Market Trends
- 3.4. Market Opportunities
- 4. Market Factor Analysis
- 4.1. Porters Five Forces
- 4.1.1. Bargaining Power of Suppliers
- 4.1.2. Bargaining Power of Buyers
- 4.1.3. Threat of New Entrants
- 4.1.4. Threat of Substitutes
- 4.1.5. Competitive Rivalry
- 4.2. PESTEL analysis
- 4.3. BCG Analysis
- 4.3.1. Stars (High Growth, High Market Share)
- 4.3.2. Cash Cows (Low Growth, High Market Share)
- 4.3.3. Question Mark (High Growth, Low Market Share)
- 4.3.4. Dogs (Low Growth, Low Market Share)
- 4.4. Ansoff Matrix Analysis
- 4.5. Supply Chain Analysis
- 4.6. Regulatory Landscape
- 4.7. Current Market Potential and Opportunity Assessment (TAM–SAM–SOM Framework)
- 4.8. TIR Analyst Note
- 4.1. Porters Five Forces
- 5. Market Analysis, Insights and Forecast 2021-2033
- 5.1. Market Analysis, Insights and Forecast - by Type
- 5.1.1. Nickel
- 5.1.2. Aluminium
- 5.1.3. Refractory
- 5.1.4. Other Types
- 5.2. Market Analysis, Insights and Forecast - by Fillers
- 5.2.1. Silicon Carbide
- 5.2.2. Aluminum Oxide
- 5.2.3. Titanium Carbide
- 5.2.4. Other Fillers
- 5.3. Market Analysis, Insights and Forecast - by End-user Industry
- 5.3.1. Automotive and Locomotive
- 5.3.2. Electrical and Electronics
- 5.3.3. Aerospace and Defense
- 5.3.4. Industrial
- 5.3.5. Other End-user Industries
- 5.4. Market Analysis, Insights and Forecast - by Region
- 5.4.1. Asia Pacific
- 5.4.2. North America
- 5.4.3. Europe
- 5.4.4. South America
- 5.4.5. Middle East and Africa
- 5.1. Market Analysis, Insights and Forecast - by Type
- 6. Global Metal Matrix Composites Market Analysis, Insights and Forecast, 2021-2033
- 6.1. Market Analysis, Insights and Forecast - by Type
- 6.1.1. Nickel
- 6.1.2. Aluminium
- 6.1.3. Refractory
- 6.1.4. Other Types
- 6.2. Market Analysis, Insights and Forecast - by Fillers
- 6.2.1. Silicon Carbide
- 6.2.2. Aluminum Oxide
- 6.2.3. Titanium Carbide
- 6.2.4. Other Fillers
- 6.3. Market Analysis, Insights and Forecast - by End-user Industry
- 6.3.1. Automotive and Locomotive
- 6.3.2. Electrical and Electronics
- 6.3.3. Aerospace and Defense
- 6.3.4. Industrial
- 6.3.5. Other End-user Industries
- 6.1. Market Analysis, Insights and Forecast - by Type
- 7. Asia Pacific Metal Matrix Composites Market Analysis, Insights and Forecast, 2020-2032
- 7.1. Market Analysis, Insights and Forecast - by Type
- 7.1.1. Nickel
- 7.1.2. Aluminium
- 7.1.3. Refractory
- 7.1.4. Other Types
- 7.2. Market Analysis, Insights and Forecast - by Fillers
- 7.2.1. Silicon Carbide
- 7.2.2. Aluminum Oxide
- 7.2.3. Titanium Carbide
- 7.2.4. Other Fillers
- 7.3. Market Analysis, Insights and Forecast - by End-user Industry
- 7.3.1. Automotive and Locomotive
- 7.3.2. Electrical and Electronics
- 7.3.3. Aerospace and Defense
- 7.3.4. Industrial
- 7.3.5. Other End-user Industries
- 7.1. Market Analysis, Insights and Forecast - by Type
- 8. North America Metal Matrix Composites Market Analysis, Insights and Forecast, 2020-2032
- 8.1. Market Analysis, Insights and Forecast - by Type
- 8.1.1. Nickel
- 8.1.2. Aluminium
- 8.1.3. Refractory
- 8.1.4. Other Types
- 8.2. Market Analysis, Insights and Forecast - by Fillers
- 8.2.1. Silicon Carbide
- 8.2.2. Aluminum Oxide
- 8.2.3. Titanium Carbide
- 8.2.4. Other Fillers
- 8.3. Market Analysis, Insights and Forecast - by End-user Industry
- 8.3.1. Automotive and Locomotive
- 8.3.2. Electrical and Electronics
- 8.3.3. Aerospace and Defense
- 8.3.4. Industrial
- 8.3.5. Other End-user Industries
- 8.1. Market Analysis, Insights and Forecast - by Type
- 9. Europe Metal Matrix Composites Market Analysis, Insights and Forecast, 2020-2032
- 9.1. Market Analysis, Insights and Forecast - by Type
- 9.1.1. Nickel
- 9.1.2. Aluminium
- 9.1.3. Refractory
- 9.1.4. Other Types
- 9.2. Market Analysis, Insights and Forecast - by Fillers
- 9.2.1. Silicon Carbide
- 9.2.2. Aluminum Oxide
- 9.2.3. Titanium Carbide
- 9.2.4. Other Fillers
- 9.3. Market Analysis, Insights and Forecast - by End-user Industry
- 9.3.1. Automotive and Locomotive
- 9.3.2. Electrical and Electronics
- 9.3.3. Aerospace and Defense
- 9.3.4. Industrial
- 9.3.5. Other End-user Industries
- 9.1. Market Analysis, Insights and Forecast - by Type
- 10. South America Metal Matrix Composites Market Analysis, Insights and Forecast, 2020-2032
- 10.1. Market Analysis, Insights and Forecast - by Type
- 10.1.1. Nickel
- 10.1.2. Aluminium
- 10.1.3. Refractory
- 10.1.4. Other Types
- 10.2. Market Analysis, Insights and Forecast - by Fillers
- 10.2.1. Silicon Carbide
- 10.2.2. Aluminum Oxide
- 10.2.3. Titanium Carbide
- 10.2.4. Other Fillers
- 10.3. Market Analysis, Insights and Forecast - by End-user Industry
- 10.3.1. Automotive and Locomotive
- 10.3.2. Electrical and Electronics
- 10.3.3. Aerospace and Defense
- 10.3.4. Industrial
- 10.3.5. Other End-user Industries
- 10.1. Market Analysis, Insights and Forecast - by Type
- 11. Middle East and Africa Metal Matrix Composites Market Analysis, Insights and Forecast, 2020-2032
- 11.1. Market Analysis, Insights and Forecast - by Type
- 11.1.1. Nickel
- 11.1.2. Aluminium
- 11.1.3. Refractory
- 11.1.4. Other Types
- 11.2. Market Analysis, Insights and Forecast - by Fillers
- 11.2.1. Silicon Carbide
- 11.2.2. Aluminum Oxide
- 11.2.3. Titanium Carbide
- 11.2.4. Other Fillers
- 11.3. Market Analysis, Insights and Forecast - by End-user Industry
- 11.3.1. Automotive and Locomotive
- 11.3.2. Electrical and Electronics
- 11.3.3. Aerospace and Defense
- 11.3.4. Industrial
- 11.3.5. Other End-user Industries
- 11.1. Market Analysis, Insights and Forecast - by Type
- 12. Competitive Analysis
- 12.1. Company Profiles
- 12.1.1 3A Composites
- 12.1.1.1. Company Overview
- 12.1.1.2. Products
- 12.1.1.3. Company Financials
- 12.1.1.4. SWOT Analysis
- 12.1.2 3M (Ceradyne Inc )
- 12.1.2.1. Company Overview
- 12.1.2.2. Products
- 12.1.2.3. Company Financials
- 12.1.2.4. SWOT Analysis
- 12.1.3 ADMA Products Inc
- 12.1.3.1. Company Overview
- 12.1.3.2. Products
- 12.1.3.3. Company Financials
- 12.1.3.4. SWOT Analysis
- 12.1.4 CPS Technologies Corp
- 12.1.4.1. Company Overview
- 12.1.4.2. Products
- 12.1.4.3. Company Financials
- 12.1.4.4. SWOT Analysis
- 12.1.5 DAT Alloytech
- 12.1.5.1. Company Overview
- 12.1.5.2. Products
- 12.1.5.3. Company Financials
- 12.1.5.4. SWOT Analysis
- 12.1.6 Denka Company Limited
- 12.1.6.1. Company Overview
- 12.1.6.2. Products
- 12.1.6.3. Company Financials
- 12.1.6.4. SWOT Analysis
- 12.1.7 GKN Sinter Metals Engineering GmbH
- 12.1.7.1. Company Overview
- 12.1.7.2. Products
- 12.1.7.3. Company Financials
- 12.1.7.4. SWOT Analysis
- 12.1.8 Hitachi Metals Ltd
- 12.1.8.1. Company Overview
- 12.1.8.2. Products
- 12.1.8.3. Company Financials
- 12.1.8.4. SWOT Analysis
- 12.1.9 Materion Corporation
- 12.1.9.1. Company Overview
- 12.1.9.2. Products
- 12.1.9.3. Company Financials
- 12.1.9.4. SWOT Analysis
- 12.1.10 MTC Powder Solutions AB
- 12.1.10.1. Company Overview
- 12.1.10.2. Products
- 12.1.10.3. Company Financials
- 12.1.10.4. SWOT Analysis
- 12.1.11 Plansee Group
- 12.1.11.1. Company Overview
- 12.1.11.2. Products
- 12.1.11.3. Company Financials
- 12.1.11.4. SWOT Analysis
- 12.1.12 Sumitomo Electric Industries Ltd
- 12.1.12.1. Company Overview
- 12.1.12.2. Products
- 12.1.12.3. Company Financials
- 12.1.12.4. SWOT Analysis
- 12.1.13 Thermal Transfer Composites LLC
- 12.1.13.1. Company Overview
- 12.1.13.2. Products
- 12.1.13.3. Company Financials
- 12.1.13.4. SWOT Analysis
- 12.1.14 TISICS Ltd*List Not Exhaustive
- 12.1.14.1. Company Overview
- 12.1.14.2. Products
- 12.1.14.3. Company Financials
- 12.1.14.4. SWOT Analysis
- 12.1.1 3A Composites
- 12.2. Market Entropy
- 12.2.1 Company's Key Areas Served
- 12.2.2 Recent Developments
- 12.3. Company Market Share Analysis 2025
- 12.3.1 Top 5 Companies Market Share Analysis
- 12.3.2 Top 3 Companies Market Share Analysis
- 12.4. List of Potential Customers
- 13. Research Methodology
List of Figures
- Figure 1: Global Metal Matrix Composites Market Revenue Breakdown (Million, %) by Region 2025 & 2033
- Figure 2: Global Metal Matrix Composites Market Volume Breakdown (Million, %) by Region 2025 & 2033
- Figure 3: Asia Pacific Metal Matrix Composites Market Revenue (Million), by Type 2025 & 2033
- Figure 4: Asia Pacific Metal Matrix Composites Market Volume (Million), by Type 2025 & 2033
- Figure 5: Asia Pacific Metal Matrix Composites Market Revenue Share (%), by Type 2025 & 2033
- Figure 6: Asia Pacific Metal Matrix Composites Market Volume Share (%), by Type 2025 & 2033
- Figure 7: Asia Pacific Metal Matrix Composites Market Revenue (Million), by Fillers 2025 & 2033
- Figure 8: Asia Pacific Metal Matrix Composites Market Volume (Million), by Fillers 2025 & 2033
- Figure 9: Asia Pacific Metal Matrix Composites Market Revenue Share (%), by Fillers 2025 & 2033
- Figure 10: Asia Pacific Metal Matrix Composites Market Volume Share (%), by Fillers 2025 & 2033
- Figure 11: Asia Pacific Metal Matrix Composites Market Revenue (Million), by End-user Industry 2025 & 2033
- Figure 12: Asia Pacific Metal Matrix Composites Market Volume (Million), by End-user Industry 2025 & 2033
- Figure 13: Asia Pacific Metal Matrix Composites Market Revenue Share (%), by End-user Industry 2025 & 2033
- Figure 14: Asia Pacific Metal Matrix Composites Market Volume Share (%), by End-user Industry 2025 & 2033
- Figure 15: Asia Pacific Metal Matrix Composites Market Revenue (Million), by Country 2025 & 2033
- Figure 16: Asia Pacific Metal Matrix Composites Market Volume (Million), by Country 2025 & 2033
- Figure 17: Asia Pacific Metal Matrix Composites Market Revenue Share (%), by Country 2025 & 2033
- Figure 18: Asia Pacific Metal Matrix Composites Market Volume Share (%), by Country 2025 & 2033
- Figure 19: North America Metal Matrix Composites Market Revenue (Million), by Type 2025 & 2033
- Figure 20: North America Metal Matrix Composites Market Volume (Million), by Type 2025 & 2033
- Figure 21: North America Metal Matrix Composites Market Revenue Share (%), by Type 2025 & 2033
- Figure 22: North America Metal Matrix Composites Market Volume Share (%), by Type 2025 & 2033
- Figure 23: North America Metal Matrix Composites Market Revenue (Million), by Fillers 2025 & 2033
- Figure 24: North America Metal Matrix Composites Market Volume (Million), by Fillers 2025 & 2033
- Figure 25: North America Metal Matrix Composites Market Revenue Share (%), by Fillers 2025 & 2033
- Figure 26: North America Metal Matrix Composites Market Volume Share (%), by Fillers 2025 & 2033
- Figure 27: North America Metal Matrix Composites Market Revenue (Million), by End-user Industry 2025 & 2033
- Figure 28: North America Metal Matrix Composites Market Volume (Million), by End-user Industry 2025 & 2033
- Figure 29: North America Metal Matrix Composites Market Revenue Share (%), by End-user Industry 2025 & 2033
- Figure 30: North America Metal Matrix Composites Market Volume Share (%), by End-user Industry 2025 & 2033
- Figure 31: North America Metal Matrix Composites Market Revenue (Million), by Country 2025 & 2033
- Figure 32: North America Metal Matrix Composites Market Volume (Million), by Country 2025 & 2033
- Figure 33: North America Metal Matrix Composites Market Revenue Share (%), by Country 2025 & 2033
- Figure 34: North America Metal Matrix Composites Market Volume Share (%), by Country 2025 & 2033
- Figure 35: Europe Metal Matrix Composites Market Revenue (Million), by Type 2025 & 2033
- Figure 36: Europe Metal Matrix Composites Market Volume (Million), by Type 2025 & 2033
- Figure 37: Europe Metal Matrix Composites Market Revenue Share (%), by Type 2025 & 2033
- Figure 38: Europe Metal Matrix Composites Market Volume Share (%), by Type 2025 & 2033
- Figure 39: Europe Metal Matrix Composites Market Revenue (Million), by Fillers 2025 & 2033
- Figure 40: Europe Metal Matrix Composites Market Volume (Million), by Fillers 2025 & 2033
- Figure 41: Europe Metal Matrix Composites Market Revenue Share (%), by Fillers 2025 & 2033
- Figure 42: Europe Metal Matrix Composites Market Volume Share (%), by Fillers 2025 & 2033
- Figure 43: Europe Metal Matrix Composites Market Revenue (Million), by End-user Industry 2025 & 2033
- Figure 44: Europe Metal Matrix Composites Market Volume (Million), by End-user Industry 2025 & 2033
- Figure 45: Europe Metal Matrix Composites Market Revenue Share (%), by End-user Industry 2025 & 2033
- Figure 46: Europe Metal Matrix Composites Market Volume Share (%), by End-user Industry 2025 & 2033
- Figure 47: Europe Metal Matrix Composites Market Revenue (Million), by Country 2025 & 2033
- Figure 48: Europe Metal Matrix Composites Market Volume (Million), by Country 2025 & 2033
- Figure 49: Europe Metal Matrix Composites Market Revenue Share (%), by Country 2025 & 2033
- Figure 50: Europe Metal Matrix Composites Market Volume Share (%), by Country 2025 & 2033
- Figure 51: South America Metal Matrix Composites Market Revenue (Million), by Type 2025 & 2033
- Figure 52: South America Metal Matrix Composites Market Volume (Million), by Type 2025 & 2033
- Figure 53: South America Metal Matrix Composites Market Revenue Share (%), by Type 2025 & 2033
- Figure 54: South America Metal Matrix Composites Market Volume Share (%), by Type 2025 & 2033
- Figure 55: South America Metal Matrix Composites Market Revenue (Million), by Fillers 2025 & 2033
- Figure 56: South America Metal Matrix Composites Market Volume (Million), by Fillers 2025 & 2033
- Figure 57: South America Metal Matrix Composites Market Revenue Share (%), by Fillers 2025 & 2033
- Figure 58: South America Metal Matrix Composites Market Volume Share (%), by Fillers 2025 & 2033
- Figure 59: South America Metal Matrix Composites Market Revenue (Million), by End-user Industry 2025 & 2033
- Figure 60: South America Metal Matrix Composites Market Volume (Million), by End-user Industry 2025 & 2033
- Figure 61: South America Metal Matrix Composites Market Revenue Share (%), by End-user Industry 2025 & 2033
- Figure 62: South America Metal Matrix Composites Market Volume Share (%), by End-user Industry 2025 & 2033
- Figure 63: South America Metal Matrix Composites Market Revenue (Million), by Country 2025 & 2033
- Figure 64: South America Metal Matrix Composites Market Volume (Million), by Country 2025 & 2033
- Figure 65: South America Metal Matrix Composites Market Revenue Share (%), by Country 2025 & 2033
- Figure 66: South America Metal Matrix Composites Market Volume Share (%), by Country 2025 & 2033
- Figure 67: Middle East and Africa Metal Matrix Composites Market Revenue (Million), by Type 2025 & 2033
- Figure 68: Middle East and Africa Metal Matrix Composites Market Volume (Million), by Type 2025 & 2033
- Figure 69: Middle East and Africa Metal Matrix Composites Market Revenue Share (%), by Type 2025 & 2033
- Figure 70: Middle East and Africa Metal Matrix Composites Market Volume Share (%), by Type 2025 & 2033
- Figure 71: Middle East and Africa Metal Matrix Composites Market Revenue (Million), by Fillers 2025 & 2033
- Figure 72: Middle East and Africa Metal Matrix Composites Market Volume (Million), by Fillers 2025 & 2033
- Figure 73: Middle East and Africa Metal Matrix Composites Market Revenue Share (%), by Fillers 2025 & 2033
- Figure 74: Middle East and Africa Metal Matrix Composites Market Volume Share (%), by Fillers 2025 & 2033
- Figure 75: Middle East and Africa Metal Matrix Composites Market Revenue (Million), by End-user Industry 2025 & 2033
- Figure 76: Middle East and Africa Metal Matrix Composites Market Volume (Million), by End-user Industry 2025 & 2033
- Figure 77: Middle East and Africa Metal Matrix Composites Market Revenue Share (%), by End-user Industry 2025 & 2033
- Figure 78: Middle East and Africa Metal Matrix Composites Market Volume Share (%), by End-user Industry 2025 & 2033
- Figure 79: Middle East and Africa Metal Matrix Composites Market Revenue (Million), by Country 2025 & 2033
- Figure 80: Middle East and Africa Metal Matrix Composites Market Volume (Million), by Country 2025 & 2033
- Figure 81: Middle East and Africa Metal Matrix Composites Market Revenue Share (%), by Country 2025 & 2033
- Figure 82: Middle East and Africa Metal Matrix Composites Market Volume Share (%), by Country 2025 & 2033
List of Tables
- Table 1: Global Metal Matrix Composites Market Revenue Million Forecast, by Type 2020 & 2033
- Table 2: Global Metal Matrix Composites Market Volume Million Forecast, by Type 2020 & 2033
- Table 3: Global Metal Matrix Composites Market Revenue Million Forecast, by Fillers 2020 & 2033
- Table 4: Global Metal Matrix Composites Market Volume Million Forecast, by Fillers 2020 & 2033
- Table 5: Global Metal Matrix Composites Market Revenue Million Forecast, by End-user Industry 2020 & 2033
- Table 6: Global Metal Matrix Composites Market Volume Million Forecast, by End-user Industry 2020 & 2033
- Table 7: Global Metal Matrix Composites Market Revenue Million Forecast, by Region 2020 & 2033
- Table 8: Global Metal Matrix Composites Market Volume Million Forecast, by Region 2020 & 2033
- Table 9: Global Metal Matrix Composites Market Revenue Million Forecast, by Type 2020 & 2033
- Table 10: Global Metal Matrix Composites Market Volume Million Forecast, by Type 2020 & 2033
- Table 11: Global Metal Matrix Composites Market Revenue Million Forecast, by Fillers 2020 & 2033
- Table 12: Global Metal Matrix Composites Market Volume Million Forecast, by Fillers 2020 & 2033
- Table 13: Global Metal Matrix Composites Market Revenue Million Forecast, by End-user Industry 2020 & 2033
- Table 14: Global Metal Matrix Composites Market Volume Million Forecast, by End-user Industry 2020 & 2033
- Table 15: Global Metal Matrix Composites Market Revenue Million Forecast, by Country 2020 & 2033
- Table 16: Global Metal Matrix Composites Market Volume Million Forecast, by Country 2020 & 2033
- Table 17: China Metal Matrix Composites Market Revenue (Million) Forecast, by Application 2020 & 2033
- Table 18: China Metal Matrix Composites Market Volume (Million) Forecast, by Application 2020 & 2033
- Table 19: India Metal Matrix Composites Market Revenue (Million) Forecast, by Application 2020 & 2033
- Table 20: India Metal Matrix Composites Market Volume (Million) Forecast, by Application 2020 & 2033
- Table 21: Japan Metal Matrix Composites Market Revenue (Million) Forecast, by Application 2020 & 2033
- Table 22: Japan Metal Matrix Composites Market Volume (Million) Forecast, by Application 2020 & 2033
- Table 23: South Korea Metal Matrix Composites Market Revenue (Million) Forecast, by Application 2020 & 2033
- Table 24: South Korea Metal Matrix Composites Market Volume (Million) Forecast, by Application 2020 & 2033
- Table 25: Rest of Asia Pacific Metal Matrix Composites Market Revenue (Million) Forecast, by Application 2020 & 2033
- Table 26: Rest of Asia Pacific Metal Matrix Composites Market Volume (Million) Forecast, by Application 2020 & 2033
- Table 27: Global Metal Matrix Composites Market Revenue Million Forecast, by Type 2020 & 2033
- Table 28: Global Metal Matrix Composites Market Volume Million Forecast, by Type 2020 & 2033
- Table 29: Global Metal Matrix Composites Market Revenue Million Forecast, by Fillers 2020 & 2033
- Table 30: Global Metal Matrix Composites Market Volume Million Forecast, by Fillers 2020 & 2033
- Table 31: Global Metal Matrix Composites Market Revenue Million Forecast, by End-user Industry 2020 & 2033
- Table 32: Global Metal Matrix Composites Market Volume Million Forecast, by End-user Industry 2020 & 2033
- Table 33: Global Metal Matrix Composites Market Revenue Million Forecast, by Country 2020 & 2033
- Table 34: Global Metal Matrix Composites Market Volume Million Forecast, by Country 2020 & 2033
- Table 35: United States Metal Matrix Composites Market Revenue (Million) Forecast, by Application 2020 & 2033
- Table 36: United States Metal Matrix Composites Market Volume (Million) Forecast, by Application 2020 & 2033
- Table 37: Canada Metal Matrix Composites Market Revenue (Million) Forecast, by Application 2020 & 2033
- Table 38: Canada Metal Matrix Composites Market Volume (Million) Forecast, by Application 2020 & 2033
- Table 39: Mexico Metal Matrix Composites Market Revenue (Million) Forecast, by Application 2020 & 2033
- Table 40: Mexico Metal Matrix Composites Market Volume (Million) Forecast, by Application 2020 & 2033
- Table 41: Global Metal Matrix Composites Market Revenue Million Forecast, by Type 2020 & 2033
- Table 42: Global Metal Matrix Composites Market Volume Million Forecast, by Type 2020 & 2033
- Table 43: Global Metal Matrix Composites Market Revenue Million Forecast, by Fillers 2020 & 2033
- Table 44: Global Metal Matrix Composites Market Volume Million Forecast, by Fillers 2020 & 2033
- Table 45: Global Metal Matrix Composites Market Revenue Million Forecast, by End-user Industry 2020 & 2033
- Table 46: Global Metal Matrix Composites Market Volume Million Forecast, by End-user Industry 2020 & 2033
- Table 47: Global Metal Matrix Composites Market Revenue Million Forecast, by Country 2020 & 2033
- Table 48: Global Metal Matrix Composites Market Volume Million Forecast, by Country 2020 & 2033
- Table 49: Germany Metal Matrix Composites Market Revenue (Million) Forecast, by Application 2020 & 2033
- Table 50: Germany Metal Matrix Composites Market Volume (Million) Forecast, by Application 2020 & 2033
- Table 51: United Kingdom Metal Matrix Composites Market Revenue (Million) Forecast, by Application 2020 & 2033
- Table 52: United Kingdom Metal Matrix Composites Market Volume (Million) Forecast, by Application 2020 & 2033
- Table 53: Italy Metal Matrix Composites Market Revenue (Million) Forecast, by Application 2020 & 2033
- Table 54: Italy Metal Matrix Composites Market Volume (Million) Forecast, by Application 2020 & 2033
- Table 55: France Metal Matrix Composites Market Revenue (Million) Forecast, by Application 2020 & 2033
- Table 56: France Metal Matrix Composites Market Volume (Million) Forecast, by Application 2020 & 2033
- Table 57: Spain Metal Matrix Composites Market Revenue (Million) Forecast, by Application 2020 & 2033
- Table 58: Spain Metal Matrix Composites Market Volume (Million) Forecast, by Application 2020 & 2033
- Table 59: Rest of Europe Metal Matrix Composites Market Revenue (Million) Forecast, by Application 2020 & 2033
- Table 60: Rest of Europe Metal Matrix Composites Market Volume (Million) Forecast, by Application 2020 & 2033
- Table 61: Global Metal Matrix Composites Market Revenue Million Forecast, by Type 2020 & 2033
- Table 62: Global Metal Matrix Composites Market Volume Million Forecast, by Type 2020 & 2033
- Table 63: Global Metal Matrix Composites Market Revenue Million Forecast, by Fillers 2020 & 2033
- Table 64: Global Metal Matrix Composites Market Volume Million Forecast, by Fillers 2020 & 2033
- Table 65: Global Metal Matrix Composites Market Revenue Million Forecast, by End-user Industry 2020 & 2033
- Table 66: Global Metal Matrix Composites Market Volume Million Forecast, by End-user Industry 2020 & 2033
- Table 67: Global Metal Matrix Composites Market Revenue Million Forecast, by Country 2020 & 2033
- Table 68: Global Metal Matrix Composites Market Volume Million Forecast, by Country 2020 & 2033
- Table 69: Brazil Metal Matrix Composites Market Revenue (Million) Forecast, by Application 2020 & 2033
- Table 70: Brazil Metal Matrix Composites Market Volume (Million) Forecast, by Application 2020 & 2033
- Table 71: Argentina Metal Matrix Composites Market Revenue (Million) Forecast, by Application 2020 & 2033
- Table 72: Argentina Metal Matrix Composites Market Volume (Million) Forecast, by Application 2020 & 2033
- Table 73: Rest of South America Metal Matrix Composites Market Revenue (Million) Forecast, by Application 2020 & 2033
- Table 74: Rest of South America Metal Matrix Composites Market Volume (Million) Forecast, by Application 2020 & 2033
- Table 75: Global Metal Matrix Composites Market Revenue Million Forecast, by Type 2020 & 2033
- Table 76: Global Metal Matrix Composites Market Volume Million Forecast, by Type 2020 & 2033
- Table 77: Global Metal Matrix Composites Market Revenue Million Forecast, by Fillers 2020 & 2033
- Table 78: Global Metal Matrix Composites Market Volume Million Forecast, by Fillers 2020 & 2033
- Table 79: Global Metal Matrix Composites Market Revenue Million Forecast, by End-user Industry 2020 & 2033
- Table 80: Global Metal Matrix Composites Market Volume Million Forecast, by End-user Industry 2020 & 2033
- Table 81: Global Metal Matrix Composites Market Revenue Million Forecast, by Country 2020 & 2033
- Table 82: Global Metal Matrix Composites Market Volume Million Forecast, by Country 2020 & 2033
- Table 83: Saudi Arabia Metal Matrix Composites Market Revenue (Million) Forecast, by Application 2020 & 2033
- Table 84: Saudi Arabia Metal Matrix Composites Market Volume (Million) Forecast, by Application 2020 & 2033
- Table 85: South Africa Metal Matrix Composites Market Revenue (Million) Forecast, by Application 2020 & 2033
- Table 86: South Africa Metal Matrix Composites Market Volume (Million) Forecast, by Application 2020 & 2033
- Table 87: Rest of Middle East and Africa Metal Matrix Composites Market Revenue (Million) Forecast, by Application 2020 & 2033
- Table 88: Rest of Middle East and Africa Metal Matrix Composites Market Volume (Million) Forecast, by Application 2020 & 2033
Frequently Asked Questions
1. What is the projected Compound Annual Growth Rate (CAGR) of the Metal Matrix Composites Market?
The projected CAGR is approximately 6.49%.
2. Which companies are prominent players in the Metal Matrix Composites Market?
Key companies in the market include 3A Composites, 3M (Ceradyne Inc ), ADMA Products Inc, CPS Technologies Corp, DAT Alloytech, Denka Company Limited, GKN Sinter Metals Engineering GmbH, Hitachi Metals Ltd, Materion Corporation, MTC Powder Solutions AB, Plansee Group, Sumitomo Electric Industries Ltd, Thermal Transfer Composites LLC, TISICS Ltd*List Not Exhaustive.
3. What are the main segments of the Metal Matrix Composites Market?
The market segments include Type, Fillers, End-user Industry.
4. Can you provide details about the market size?
The market size is estimated to be USD 457.16 Million as of 2022.
5. What are some drivers contributing to market growth?
Increasing Demand for Lightweight Materials in Aerospace and Defense Industry; Superior Properties of Metal Matrix Composites over Metals.
6. What are the notable trends driving market growth?
Electrical and Electronics Segment to Register Fastest Growth.
7. Are there any restraints impacting market growth?
Increasing Demand for Lightweight Materials in Aerospace and Defense Industry; Superior Properties of Metal Matrix Composites over Metals.
8. Can you provide examples of recent developments in the market?
In January 2022, Plansee Group signed a definitive agreement to acquire Mi-Tech Tungsten Metals. The acquisition will help Plansee Group expand its market position for tungsten products in North America.
9. What pricing options are available for accessing the report?
Pricing options include single-user, multi-user, and enterprise licenses priced at USD 4750, USD 5250, and USD 8750 respectively.
10. Is the market size provided in terms of value or volume?
The market size is provided in terms of value, measured in Million and volume, measured in Million.
11. Are there any specific market keywords associated with the report?
Yes, the market keyword associated with the report is "Metal Matrix Composites Market," which aids in identifying and referencing the specific market segment covered.
12. How do I determine which pricing option suits my needs best?
The pricing options vary based on user requirements and access needs. Individual users may opt for single-user licenses, while businesses requiring broader access may choose multi-user or enterprise licenses for cost-effective access to the report.
13. Are there any additional resources or data provided in the Metal Matrix Composites Market report?
While the report offers comprehensive insights, it's advisable to review the specific contents or supplementary materials provided to ascertain if additional resources or data are available.
14. How can I stay updated on further developments or reports in the Metal Matrix Composites Market?
To stay informed about further developments, trends, and reports in the Metal Matrix Composites Market, consider subscribing to industry newsletters, following relevant companies and organizations, or regularly checking reputable industry news sources and publications.
Methodology
Step 1 - Identification of Relevant Samples Size from Population Database


Step 2 - Approaches for Defining Global Market Size (Value, Volume* & Price*)

Note*: In applicable scenarios
Step 3 - Data Sources
Primary Research
- Web Analytics
- Survey Reports
- Research Institute
- Latest Research Reports
- Opinion Leaders
Secondary Research
- Annual Reports
- White Paper
- Latest Press Release
- Industry Association
- Paid Database
- Investor Presentations

Step 4 - Data Triangulation
Involves using different sources of information in order to increase the validity of a study
These sources are likely to be stakeholders in a program - participants, other researchers, program staff, other community members, and so on.
Then we put all data in single framework & apply various statistical tools to find out the dynamic on the market.
During the analysis stage, feedback from the stakeholder groups would be compared to determine areas of agreement as well as areas of divergence