

Key Insights
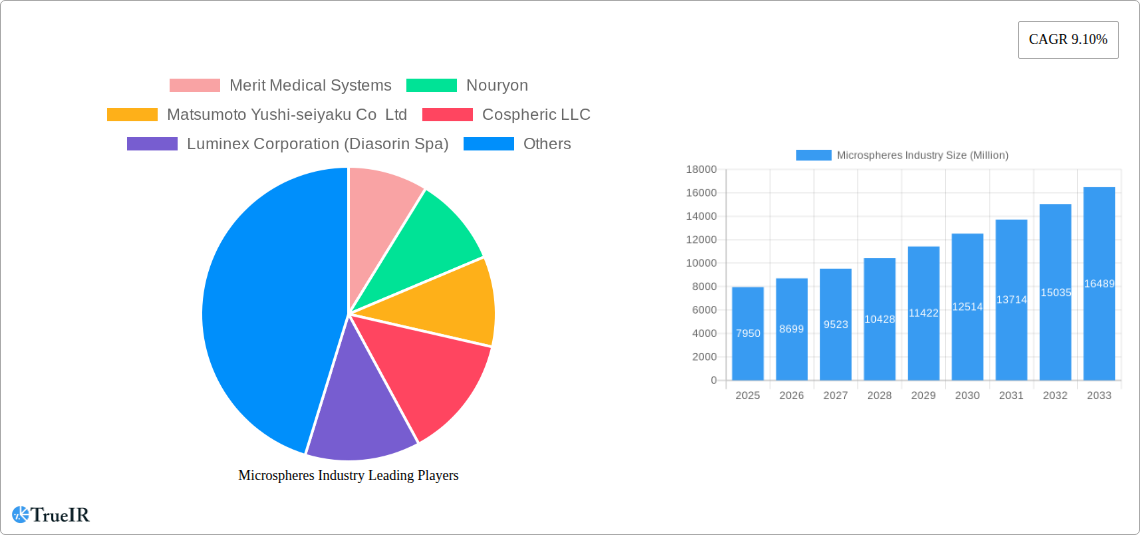
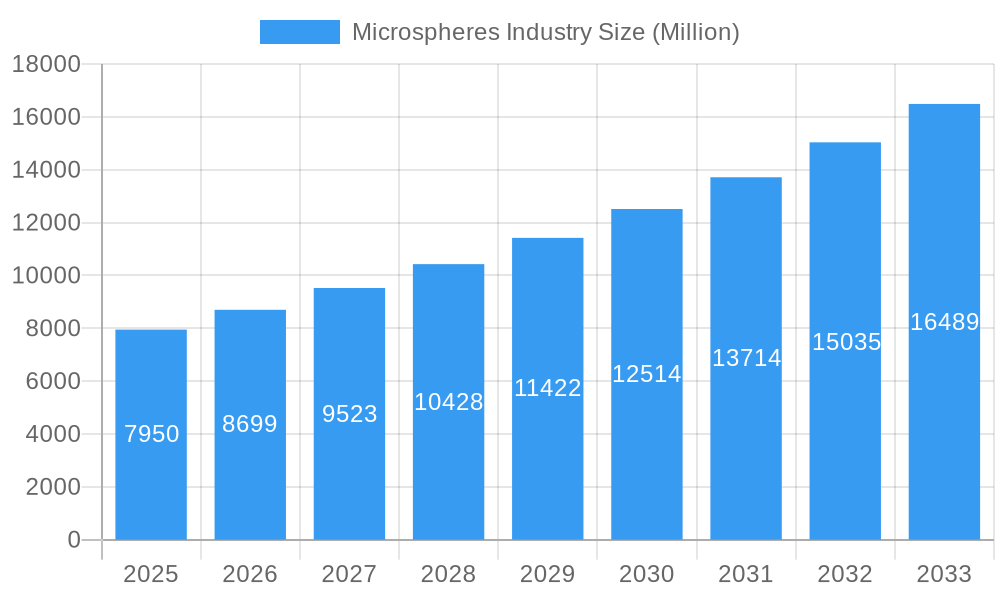
The global microspheres market, valued at $7.95 billion in 2025, is projected to experience robust growth, exhibiting a compound annual growth rate (CAGR) of 9.10% from 2025 to 2033. This expansion is driven by increasing demand across diverse applications, particularly in the biomedical and industrial sectors. The automotive industry's adoption of lightweight materials and advancements in drug delivery systems are significant contributors to this growth. Technological advancements leading to improved microsphere properties, such as enhanced biocompatibility and controlled release capabilities, further fuel market expansion. Significant growth is anticipated in Asia-Pacific, driven by rising industrialization and increasing healthcare spending in countries like China and India. While the market faces challenges such as stringent regulatory requirements and potential environmental concerns related to certain raw materials, the overall outlook remains positive, bolstered by continuous innovation and the emergence of new applications in fields like cosmetics and paints & coatings. The market segmentation by raw material (glass, polymer, ceramic, fly ash, metallic, and others), type (hollow and solid), and application (automotive, aerospace, cosmetics, oil and gas, paints and coatings, medical technology, composites, and others) provides diverse opportunities for growth and specialization within the industry. Key players like 3M, Merit Medical Systems, and others are leveraging their expertise to capitalize on this burgeoning market.
Microspheres Industry Market Size (In Billion)
The competitive landscape is characterized by a mix of established multinational corporations and specialized smaller players. Companies are focusing on strategic partnerships, acquisitions, and product innovation to strengthen their market position. The continued development of novel microsphere formulations with tailored properties will be crucial in driving future growth. The market's geographical distribution shows significant potential in emerging economies, with significant expansion expected in regions such as Asia-Pacific and South America. This is largely due to increasing industrial activity, rising disposable incomes, and growing healthcare infrastructure in these regions. The forecast period suggests a continuous upward trajectory for the microspheres market, propelled by the factors outlined above, making it an attractive investment opportunity for stakeholders.
Microspheres Industry Company Market Share
This comprehensive report provides a detailed analysis of the global microspheres industry, offering invaluable insights for businesses, investors, and researchers. With a focus on market size, segmentation, competitive landscape, and future trends, this report covers the period from 2019 to 2033, with a base year of 2025 and a forecast period of 2025-2033. The report leverages extensive market research and data analysis to provide a clear understanding of the current market dynamics and future growth potential. The global market is valued at xx Million in 2025 and is projected to reach xx Million by 2033, exhibiting a robust CAGR of xx%.
Microspheres Industry Market Structure & Competitive Landscape
The global microspheres market exhibits a moderately concentrated structure, with several key players holding significant market share. The Herfindahl-Hirschman Index (HHI) is estimated at xx, indicating a moderately consolidated market. However, the presence of numerous smaller players creates a competitive landscape. Innovation is a key driver, with companies continuously developing new materials and applications for microspheres. Regulatory changes related to environmental concerns and material safety impact the industry, leading to increased demand for sustainable and biocompatible microspheres. Product substitution is a moderate threat, with alternative materials occasionally challenging microsphere applications in specific niches.
The market is segmented by end-user industries, including automotive, aerospace, medical technology, and others, each with varying market shares and growth rates. Mergers and acquisitions (M&A) activity has been moderate in recent years, with approximately xx M&A deals recorded between 2019 and 2024, primarily focused on expanding product portfolios and geographic reach.
- Market Concentration: Moderately consolidated (HHI: xx)
- Innovation Drivers: Development of new materials (e.g., biocompatible polymers), advanced manufacturing techniques, and novel applications.
- Regulatory Impacts: Environmental regulations and safety standards influence material selection and production processes.
- Product Substitutes: Alternative lightweight materials pose a moderate threat in some applications.
- End-User Segmentation: Automotive, Aerospace, Medical Technology, Cosmetics, Oil & Gas, Paints & Coatings, Composites, and Others.
- M&A Trends: Moderate activity, driven by expansion strategies and technological integration.
Microspheres Industry Market Trends & Opportunities
The microspheres market is experiencing significant growth, driven by increasing demand across various end-use sectors. The automotive industry, seeking lightweight and high-performance materials, is a major driver, along with the expanding aerospace sector's need for advanced insulation and structural components. The market size is expected to witness a substantial expansion, propelled by technological advancements, evolving consumer preferences favoring lightweight and sustainable products, and the intense competitive dynamics driving innovation and cost reduction. The CAGR for the forecast period (2025-2033) is projected at xx%, with the market penetration rate expected to increase from xx% in 2025 to xx% by 2033. Technological shifts towards nanotechnology and the incorporation of smart materials into microspheres are opening up new avenues for growth. The rise of sustainable practices and environmental consciousness is increasing the demand for eco-friendly microspheres, creating opportunities for companies focusing on bio-based and recyclable materials. The competitive landscape remains dynamic, with established players investing in R&D and new entrants exploring niche applications. This combination of factors points towards a highly promising future for the microspheres industry.
Dominant Markets & Segments in Microspheres Industry
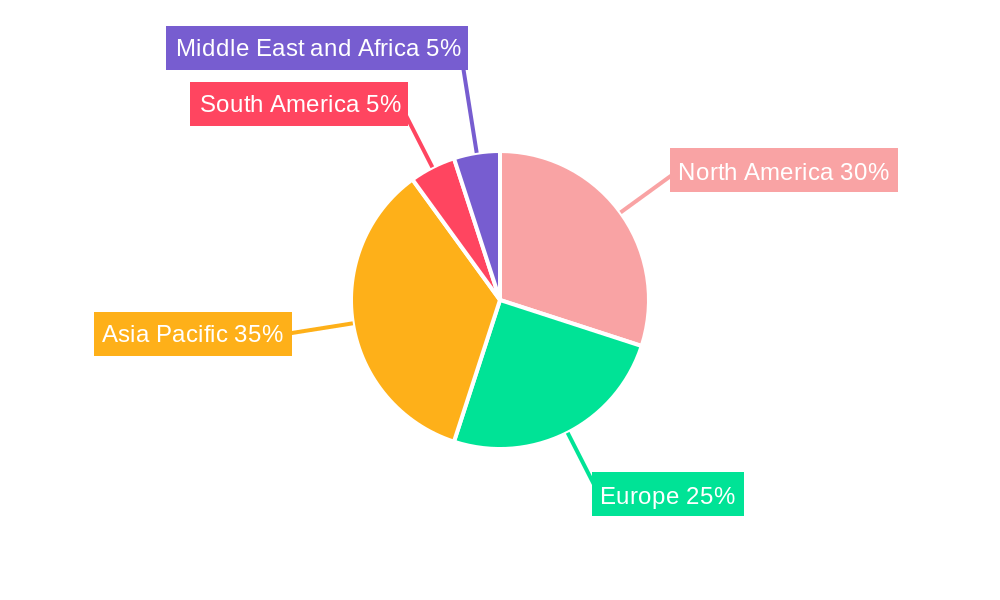
The global microspheres market is geographically diverse, with significant presence in North America, Europe, and Asia-Pacific. However, the Asia-Pacific region is projected to experience the fastest growth rate in the forecast period due to rapid industrialization and infrastructural development. Within material segments, polymer microspheres dominate the market due to their versatility and cost-effectiveness, followed by glass microspheres which excel in high-performance applications. Hollow microspheres hold a larger market share compared to solid microspheres, owing to their superior properties in lightweighting and insulation. The automotive, aerospace, and medical technology sectors are the major application segments, driven by strict requirements for lightweighting, improved performance, and biocompatibility.
- Leading Region: Asia-Pacific (projected fastest growth)
- Dominant Raw Material: Polymer
- Dominant Type: Hollow
- Key Application Segments: Automotive, Aerospace, Medical Technology
Key Growth Drivers:
- Automotive: Lightweighting initiatives in vehicle manufacturing.
- Aerospace: Demand for high-performance insulation and structural components in aircraft and spacecraft.
- Medical Technology: Use in drug delivery systems and tissue engineering.
- Infrastructure Development: Expanding construction activities in developing economies.
- Government Policies: Regulations promoting the use of lightweight and sustainable materials.
Microspheres Industry Product Analysis
Microsphere products are characterized by diverse material compositions (glass, polymer, ceramic, etc.), structural variations (hollow, solid), and a wide range of applications. Key innovations focus on enhancing material properties, improving production efficiency, and expanding applications to new industries. Competitive advantages stem from specialized production techniques, superior material quality, and the ability to tailor microsphere properties for specific applications. The market reflects a strong focus on technological advancements, including surface modifications, nano-scale engineering, and the integration of smart functionalities into microspheres. This constant evolution ensures a continuous market fit and adaptability to changing industry requirements.
Key Drivers, Barriers & Challenges in Microspheres Industry
Key Drivers:
The microspheres market is driven by the increasing demand for lightweight materials across various industries, particularly in automotive and aerospace sectors. Stringent regulations for fuel efficiency and emissions further fuel this demand. Furthermore, advancements in material science and manufacturing technologies continue to improve the performance and applications of microspheres, opening new market opportunities.
Challenges and Restraints:
Supply chain disruptions, particularly in the sourcing of raw materials, can significantly impact production and pricing. Stringent environmental regulations and safety standards require manufacturers to adapt and invest in compliance measures, which increases cost and complexity. Intense competition, both from established players and new entrants, puts pressure on pricing and profitability.
Growth Drivers in the Microspheres Industry Market
The significant growth of the microspheres industry is driven by technological advancements, leading to the development of superior materials with enhanced properties. Economic factors, including the growing demand for lightweight components in automotive and aerospace, contribute substantially. Supportive government policies promoting sustainable materials and energy efficiency further accelerate market expansion.
Challenges Impacting Microspheres Industry Growth
Regulatory complexities, particularly in the environmental and safety domains, pose significant challenges for manufacturers. Supply chain disruptions, especially related to raw material availability and geopolitical factors, can impede growth. Intense competition among industry players leads to price pressures and reduced profit margins.
Key Players Shaping the Microspheres Industry Market
- Merit Medical Systems
- Nouryon
- Matsumoto Yushi-seiyaku Co Ltd
- Cospheric LLC
- Luminex Corporation (Diasorin Spa)
- Bangs Laboratories Inc
- 3M
- Chase Corporation
- Momentive
- Potters Industries LLC
- Siemens Healthineers AG
- Mo-sci Corporation (Heraeus Holdings)
- Kureha Corporation
- Trelleborg AB
Significant Microspheres Industry Milestones
- June 2022: Nouryon launched expancel HP92 microspheres for automotive underbody coatings.
- February 2022: 3M's glass bubbles used in NASA's liquid hydrogen storage tank insulation.
- 2021: 3M began supplying glass bubbles to NASA for the tank project.
Future Outlook for Microspheres Industry Market
The microspheres market is poised for continued growth, driven by ongoing technological advancements, expanding applications in diverse sectors, and supportive government policies. Strategic investments in R&D, expansion into new markets, and collaborations will shape the industry's future. The increasing focus on sustainability and lightweighting presents significant opportunities for innovation and market expansion.
Microspheres Industry Segmentation
-
1. Raw Material
- 1.1. Glass
- 1.2. Polymer
- 1.3. Ceramic
- 1.4. Fly Ash
- 1.5. Metallic
- 1.6. Other Raw Materials
-
2. Type
- 2.1. Hollow
- 2.2. Soild
-
3. Application
- 3.1. Automotive
- 3.2. Aerospace
- 3.3. Cosmetics
- 3.4. Oil and Gas
- 3.5. Paints and Coatings
- 3.6. Medical Technology
- 3.7. Composites
- 3.8. Other Applications
Microspheres Industry Segmentation By Geography
-
1. Asia Pacific
- 1.1. China
- 1.2. India
- 1.3. Japan
- 1.4. South Korea
- 1.5. Rest of Asia Pacific
-
2. North America
- 2.1. United States
- 2.2. Canada
- 2.3. Mexico
-
3. Europe
- 3.1. Germany
- 3.2. United Kingdom
- 3.3. Italy
- 3.4. France
- 3.5. Rest of Europe
-
4. South America
- 4.1. Brazil
- 4.2. Argentina
- 4.3. Rest of South America
-
5. Middle East and Africa
- 5.1. Saudi Arabia
- 5.2. South Africa
- 5.3. Rest of Middle East and Africa
Microspheres Industry Regional Market Share
Geographic Coverage of Microspheres Industry
Microspheres Industry REPORT HIGHLIGHTS
| Aspects | Details |
|---|---|
| Study Period | 2020-2034 |
| Base Year | 2025 |
| Estimated Year | 2026 |
| Forecast Period | 2026-2034 |
| Historical Period | 2020-2025 |
| Growth Rate | CAGR of 9.10% from 2020-2034 |
| Segmentation |
|
Table of Contents
- 1. Introduction
- 1.1. Research Scope
- 1.2. Market Segmentation
- 1.3. Research Objective
- 1.4. Definitions and Assumptions
- 2. Executive Summary
- 2.1. Market Snapshot
- 3. Market Dynamics
- 3.1. Market Drivers
- 3.2. Market Restrains
- 3.3. Market Trends
- 3.4. Market Opportunities
- 4. Market Factor Analysis
- 4.1. Porters Five Forces
- 4.1.1. Bargaining Power of Suppliers
- 4.1.2. Bargaining Power of Buyers
- 4.1.3. Threat of New Entrants
- 4.1.4. Threat of Substitutes
- 4.1.5. Competitive Rivalry
- 4.2. PESTEL analysis
- 4.3. BCG Analysis
- 4.3.1. Stars (High Growth, High Market Share)
- 4.3.2. Cash Cows (Low Growth, High Market Share)
- 4.3.3. Question Mark (High Growth, Low Market Share)
- 4.3.4. Dogs (Low Growth, Low Market Share)
- 4.4. Ansoff Matrix Analysis
- 4.5. Supply Chain Analysis
- 4.6. Regulatory Landscape
- 4.7. Current Market Potential and Opportunity Assessment (TAM–SAM–SOM Framework)
- 4.8. TIR Analyst Note
- 4.1. Porters Five Forces
- 5. Market Analysis, Insights and Forecast 2021-2033
- 5.1. Market Analysis, Insights and Forecast - by Raw Material
- 5.1.1. Glass
- 5.1.2. Polymer
- 5.1.3. Ceramic
- 5.1.4. Fly Ash
- 5.1.5. Metallic
- 5.1.6. Other Raw Materials
- 5.2. Market Analysis, Insights and Forecast - by Type
- 5.2.1. Hollow
- 5.2.2. Soild
- 5.3. Market Analysis, Insights and Forecast - by Application
- 5.3.1. Automotive
- 5.3.2. Aerospace
- 5.3.3. Cosmetics
- 5.3.4. Oil and Gas
- 5.3.5. Paints and Coatings
- 5.3.6. Medical Technology
- 5.3.7. Composites
- 5.3.8. Other Applications
- 5.4. Market Analysis, Insights and Forecast - by Region
- 5.4.1. Asia Pacific
- 5.4.2. North America
- 5.4.3. Europe
- 5.4.4. South America
- 5.4.5. Middle East and Africa
- 5.1. Market Analysis, Insights and Forecast - by Raw Material
- 6. Global Microspheres Industry Analysis, Insights and Forecast, 2021-2033
- 6.1. Market Analysis, Insights and Forecast - by Raw Material
- 6.1.1. Glass
- 6.1.2. Polymer
- 6.1.3. Ceramic
- 6.1.4. Fly Ash
- 6.1.5. Metallic
- 6.1.6. Other Raw Materials
- 6.2. Market Analysis, Insights and Forecast - by Type
- 6.2.1. Hollow
- 6.2.2. Soild
- 6.3. Market Analysis, Insights and Forecast - by Application
- 6.3.1. Automotive
- 6.3.2. Aerospace
- 6.3.3. Cosmetics
- 6.3.4. Oil and Gas
- 6.3.5. Paints and Coatings
- 6.3.6. Medical Technology
- 6.3.7. Composites
- 6.3.8. Other Applications
- 6.1. Market Analysis, Insights and Forecast - by Raw Material
- 7. Asia Pacific Microspheres Industry Analysis, Insights and Forecast, 2020-2032
- 7.1. Market Analysis, Insights and Forecast - by Raw Material
- 7.1.1. Glass
- 7.1.2. Polymer
- 7.1.3. Ceramic
- 7.1.4. Fly Ash
- 7.1.5. Metallic
- 7.1.6. Other Raw Materials
- 7.2. Market Analysis, Insights and Forecast - by Type
- 7.2.1. Hollow
- 7.2.2. Soild
- 7.3. Market Analysis, Insights and Forecast - by Application
- 7.3.1. Automotive
- 7.3.2. Aerospace
- 7.3.3. Cosmetics
- 7.3.4. Oil and Gas
- 7.3.5. Paints and Coatings
- 7.3.6. Medical Technology
- 7.3.7. Composites
- 7.3.8. Other Applications
- 7.1. Market Analysis, Insights and Forecast - by Raw Material
- 8. North America Microspheres Industry Analysis, Insights and Forecast, 2020-2032
- 8.1. Market Analysis, Insights and Forecast - by Raw Material
- 8.1.1. Glass
- 8.1.2. Polymer
- 8.1.3. Ceramic
- 8.1.4. Fly Ash
- 8.1.5. Metallic
- 8.1.6. Other Raw Materials
- 8.2. Market Analysis, Insights and Forecast - by Type
- 8.2.1. Hollow
- 8.2.2. Soild
- 8.3. Market Analysis, Insights and Forecast - by Application
- 8.3.1. Automotive
- 8.3.2. Aerospace
- 8.3.3. Cosmetics
- 8.3.4. Oil and Gas
- 8.3.5. Paints and Coatings
- 8.3.6. Medical Technology
- 8.3.7. Composites
- 8.3.8. Other Applications
- 8.1. Market Analysis, Insights and Forecast - by Raw Material
- 9. Europe Microspheres Industry Analysis, Insights and Forecast, 2020-2032
- 9.1. Market Analysis, Insights and Forecast - by Raw Material
- 9.1.1. Glass
- 9.1.2. Polymer
- 9.1.3. Ceramic
- 9.1.4. Fly Ash
- 9.1.5. Metallic
- 9.1.6. Other Raw Materials
- 9.2. Market Analysis, Insights and Forecast - by Type
- 9.2.1. Hollow
- 9.2.2. Soild
- 9.3. Market Analysis, Insights and Forecast - by Application
- 9.3.1. Automotive
- 9.3.2. Aerospace
- 9.3.3. Cosmetics
- 9.3.4. Oil and Gas
- 9.3.5. Paints and Coatings
- 9.3.6. Medical Technology
- 9.3.7. Composites
- 9.3.8. Other Applications
- 9.1. Market Analysis, Insights and Forecast - by Raw Material
- 10. South America Microspheres Industry Analysis, Insights and Forecast, 2020-2032
- 10.1. Market Analysis, Insights and Forecast - by Raw Material
- 10.1.1. Glass
- 10.1.2. Polymer
- 10.1.3. Ceramic
- 10.1.4. Fly Ash
- 10.1.5. Metallic
- 10.1.6. Other Raw Materials
- 10.2. Market Analysis, Insights and Forecast - by Type
- 10.2.1. Hollow
- 10.2.2. Soild
- 10.3. Market Analysis, Insights and Forecast - by Application
- 10.3.1. Automotive
- 10.3.2. Aerospace
- 10.3.3. Cosmetics
- 10.3.4. Oil and Gas
- 10.3.5. Paints and Coatings
- 10.3.6. Medical Technology
- 10.3.7. Composites
- 10.3.8. Other Applications
- 10.1. Market Analysis, Insights and Forecast - by Raw Material
- 11. Middle East and Africa Microspheres Industry Analysis, Insights and Forecast, 2020-2032
- 11.1. Market Analysis, Insights and Forecast - by Raw Material
- 11.1.1. Glass
- 11.1.2. Polymer
- 11.1.3. Ceramic
- 11.1.4. Fly Ash
- 11.1.5. Metallic
- 11.1.6. Other Raw Materials
- 11.2. Market Analysis, Insights and Forecast - by Type
- 11.2.1. Hollow
- 11.2.2. Soild
- 11.3. Market Analysis, Insights and Forecast - by Application
- 11.3.1. Automotive
- 11.3.2. Aerospace
- 11.3.3. Cosmetics
- 11.3.4. Oil and Gas
- 11.3.5. Paints and Coatings
- 11.3.6. Medical Technology
- 11.3.7. Composites
- 11.3.8. Other Applications
- 11.1. Market Analysis, Insights and Forecast - by Raw Material
- 12. Competitive Analysis
- 12.1. Company Profiles
- 12.1.1 Merit Medical Systems
- 12.1.1.1. Company Overview
- 12.1.1.2. Products
- 12.1.1.3. Company Financials
- 12.1.1.4. SWOT Analysis
- 12.1.2 Nouryon
- 12.1.2.1. Company Overview
- 12.1.2.2. Products
- 12.1.2.3. Company Financials
- 12.1.2.4. SWOT Analysis
- 12.1.3 Matsumoto Yushi-seiyaku Co Ltd
- 12.1.3.1. Company Overview
- 12.1.3.2. Products
- 12.1.3.3. Company Financials
- 12.1.3.4. SWOT Analysis
- 12.1.4 Cospheric LLC
- 12.1.4.1. Company Overview
- 12.1.4.2. Products
- 12.1.4.3. Company Financials
- 12.1.4.4. SWOT Analysis
- 12.1.5 Luminex Corporation (Diasorin Spa)
- 12.1.5.1. Company Overview
- 12.1.5.2. Products
- 12.1.5.3. Company Financials
- 12.1.5.4. SWOT Analysis
- 12.1.6 Bangs Laboratories Inc
- 12.1.6.1. Company Overview
- 12.1.6.2. Products
- 12.1.6.3. Company Financials
- 12.1.6.4. SWOT Analysis
- 12.1.7 3M
- 12.1.7.1. Company Overview
- 12.1.7.2. Products
- 12.1.7.3. Company Financials
- 12.1.7.4. SWOT Analysis
- 12.1.8 Chase Corporation
- 12.1.8.1. Company Overview
- 12.1.8.2. Products
- 12.1.8.3. Company Financials
- 12.1.8.4. SWOT Analysis
- 12.1.9 Momentive
- 12.1.9.1. Company Overview
- 12.1.9.2. Products
- 12.1.9.3. Company Financials
- 12.1.9.4. SWOT Analysis
- 12.1.10 Potters Industries LLC
- 12.1.10.1. Company Overview
- 12.1.10.2. Products
- 12.1.10.3. Company Financials
- 12.1.10.4. SWOT Analysis
- 12.1.11 Siemens Healthineers AG
- 12.1.11.1. Company Overview
- 12.1.11.2. Products
- 12.1.11.3. Company Financials
- 12.1.11.4. SWOT Analysis
- 12.1.12 Mo-sci Corporation (Heraeus Holdings)
- 12.1.12.1. Company Overview
- 12.1.12.2. Products
- 12.1.12.3. Company Financials
- 12.1.12.4. SWOT Analysis
- 12.1.13 Kureha Corporation
- 12.1.13.1. Company Overview
- 12.1.13.2. Products
- 12.1.13.3. Company Financials
- 12.1.13.4. SWOT Analysis
- 12.1.14 Trelleborg AB*List Not Exhaustive
- 12.1.14.1. Company Overview
- 12.1.14.2. Products
- 12.1.14.3. Company Financials
- 12.1.14.4. SWOT Analysis
- 12.1.1 Merit Medical Systems
- 12.2. Market Entropy
- 12.2.1 Company's Key Areas Served
- 12.2.2 Recent Developments
- 12.3. Company Market Share Analysis 2025
- 12.3.1 Top 5 Companies Market Share Analysis
- 12.3.2 Top 3 Companies Market Share Analysis
- 12.4. List of Potential Customers
- 13. Research Methodology
List of Figures
- Figure 1: Global Microspheres Industry Revenue Breakdown (Million, %) by Region 2025 & 2033
- Figure 2: Asia Pacific Microspheres Industry Revenue (Million), by Raw Material 2025 & 2033
- Figure 3: Asia Pacific Microspheres Industry Revenue Share (%), by Raw Material 2025 & 2033
- Figure 4: Asia Pacific Microspheres Industry Revenue (Million), by Type 2025 & 2033
- Figure 5: Asia Pacific Microspheres Industry Revenue Share (%), by Type 2025 & 2033
- Figure 6: Asia Pacific Microspheres Industry Revenue (Million), by Application 2025 & 2033
- Figure 7: Asia Pacific Microspheres Industry Revenue Share (%), by Application 2025 & 2033
- Figure 8: Asia Pacific Microspheres Industry Revenue (Million), by Country 2025 & 2033
- Figure 9: Asia Pacific Microspheres Industry Revenue Share (%), by Country 2025 & 2033
- Figure 10: North America Microspheres Industry Revenue (Million), by Raw Material 2025 & 2033
- Figure 11: North America Microspheres Industry Revenue Share (%), by Raw Material 2025 & 2033
- Figure 12: North America Microspheres Industry Revenue (Million), by Type 2025 & 2033
- Figure 13: North America Microspheres Industry Revenue Share (%), by Type 2025 & 2033
- Figure 14: North America Microspheres Industry Revenue (Million), by Application 2025 & 2033
- Figure 15: North America Microspheres Industry Revenue Share (%), by Application 2025 & 2033
- Figure 16: North America Microspheres Industry Revenue (Million), by Country 2025 & 2033
- Figure 17: North America Microspheres Industry Revenue Share (%), by Country 2025 & 2033
- Figure 18: Europe Microspheres Industry Revenue (Million), by Raw Material 2025 & 2033
- Figure 19: Europe Microspheres Industry Revenue Share (%), by Raw Material 2025 & 2033
- Figure 20: Europe Microspheres Industry Revenue (Million), by Type 2025 & 2033
- Figure 21: Europe Microspheres Industry Revenue Share (%), by Type 2025 & 2033
- Figure 22: Europe Microspheres Industry Revenue (Million), by Application 2025 & 2033
- Figure 23: Europe Microspheres Industry Revenue Share (%), by Application 2025 & 2033
- Figure 24: Europe Microspheres Industry Revenue (Million), by Country 2025 & 2033
- Figure 25: Europe Microspheres Industry Revenue Share (%), by Country 2025 & 2033
- Figure 26: South America Microspheres Industry Revenue (Million), by Raw Material 2025 & 2033
- Figure 27: South America Microspheres Industry Revenue Share (%), by Raw Material 2025 & 2033
- Figure 28: South America Microspheres Industry Revenue (Million), by Type 2025 & 2033
- Figure 29: South America Microspheres Industry Revenue Share (%), by Type 2025 & 2033
- Figure 30: South America Microspheres Industry Revenue (Million), by Application 2025 & 2033
- Figure 31: South America Microspheres Industry Revenue Share (%), by Application 2025 & 2033
- Figure 32: South America Microspheres Industry Revenue (Million), by Country 2025 & 2033
- Figure 33: South America Microspheres Industry Revenue Share (%), by Country 2025 & 2033
- Figure 34: Middle East and Africa Microspheres Industry Revenue (Million), by Raw Material 2025 & 2033
- Figure 35: Middle East and Africa Microspheres Industry Revenue Share (%), by Raw Material 2025 & 2033
- Figure 36: Middle East and Africa Microspheres Industry Revenue (Million), by Type 2025 & 2033
- Figure 37: Middle East and Africa Microspheres Industry Revenue Share (%), by Type 2025 & 2033
- Figure 38: Middle East and Africa Microspheres Industry Revenue (Million), by Application 2025 & 2033
- Figure 39: Middle East and Africa Microspheres Industry Revenue Share (%), by Application 2025 & 2033
- Figure 40: Middle East and Africa Microspheres Industry Revenue (Million), by Country 2025 & 2033
- Figure 41: Middle East and Africa Microspheres Industry Revenue Share (%), by Country 2025 & 2033
List of Tables
- Table 1: Global Microspheres Industry Revenue Million Forecast, by Raw Material 2020 & 2033
- Table 2: Global Microspheres Industry Revenue Million Forecast, by Type 2020 & 2033
- Table 3: Global Microspheres Industry Revenue Million Forecast, by Application 2020 & 2033
- Table 4: Global Microspheres Industry Revenue Million Forecast, by Region 2020 & 2033
- Table 5: Global Microspheres Industry Revenue Million Forecast, by Raw Material 2020 & 2033
- Table 6: Global Microspheres Industry Revenue Million Forecast, by Type 2020 & 2033
- Table 7: Global Microspheres Industry Revenue Million Forecast, by Application 2020 & 2033
- Table 8: Global Microspheres Industry Revenue Million Forecast, by Country 2020 & 2033
- Table 9: China Microspheres Industry Revenue (Million) Forecast, by Application 2020 & 2033
- Table 10: India Microspheres Industry Revenue (Million) Forecast, by Application 2020 & 2033
- Table 11: Japan Microspheres Industry Revenue (Million) Forecast, by Application 2020 & 2033
- Table 12: South Korea Microspheres Industry Revenue (Million) Forecast, by Application 2020 & 2033
- Table 13: Rest of Asia Pacific Microspheres Industry Revenue (Million) Forecast, by Application 2020 & 2033
- Table 14: Global Microspheres Industry Revenue Million Forecast, by Raw Material 2020 & 2033
- Table 15: Global Microspheres Industry Revenue Million Forecast, by Type 2020 & 2033
- Table 16: Global Microspheres Industry Revenue Million Forecast, by Application 2020 & 2033
- Table 17: Global Microspheres Industry Revenue Million Forecast, by Country 2020 & 2033
- Table 18: United States Microspheres Industry Revenue (Million) Forecast, by Application 2020 & 2033
- Table 19: Canada Microspheres Industry Revenue (Million) Forecast, by Application 2020 & 2033
- Table 20: Mexico Microspheres Industry Revenue (Million) Forecast, by Application 2020 & 2033
- Table 21: Global Microspheres Industry Revenue Million Forecast, by Raw Material 2020 & 2033
- Table 22: Global Microspheres Industry Revenue Million Forecast, by Type 2020 & 2033
- Table 23: Global Microspheres Industry Revenue Million Forecast, by Application 2020 & 2033
- Table 24: Global Microspheres Industry Revenue Million Forecast, by Country 2020 & 2033
- Table 25: Germany Microspheres Industry Revenue (Million) Forecast, by Application 2020 & 2033
- Table 26: United Kingdom Microspheres Industry Revenue (Million) Forecast, by Application 2020 & 2033
- Table 27: Italy Microspheres Industry Revenue (Million) Forecast, by Application 2020 & 2033
- Table 28: France Microspheres Industry Revenue (Million) Forecast, by Application 2020 & 2033
- Table 29: Rest of Europe Microspheres Industry Revenue (Million) Forecast, by Application 2020 & 2033
- Table 30: Global Microspheres Industry Revenue Million Forecast, by Raw Material 2020 & 2033
- Table 31: Global Microspheres Industry Revenue Million Forecast, by Type 2020 & 2033
- Table 32: Global Microspheres Industry Revenue Million Forecast, by Application 2020 & 2033
- Table 33: Global Microspheres Industry Revenue Million Forecast, by Country 2020 & 2033
- Table 34: Brazil Microspheres Industry Revenue (Million) Forecast, by Application 2020 & 2033
- Table 35: Argentina Microspheres Industry Revenue (Million) Forecast, by Application 2020 & 2033
- Table 36: Rest of South America Microspheres Industry Revenue (Million) Forecast, by Application 2020 & 2033
- Table 37: Global Microspheres Industry Revenue Million Forecast, by Raw Material 2020 & 2033
- Table 38: Global Microspheres Industry Revenue Million Forecast, by Type 2020 & 2033
- Table 39: Global Microspheres Industry Revenue Million Forecast, by Application 2020 & 2033
- Table 40: Global Microspheres Industry Revenue Million Forecast, by Country 2020 & 2033
- Table 41: Saudi Arabia Microspheres Industry Revenue (Million) Forecast, by Application 2020 & 2033
- Table 42: South Africa Microspheres Industry Revenue (Million) Forecast, by Application 2020 & 2033
- Table 43: Rest of Middle East and Africa Microspheres Industry Revenue (Million) Forecast, by Application 2020 & 2033
Frequently Asked Questions
1. What is the projected Compound Annual Growth Rate (CAGR) of the Microspheres Industry?
The projected CAGR is approximately 9.10%.
2. Which companies are prominent players in the Microspheres Industry?
Key companies in the market include Merit Medical Systems, Nouryon, Matsumoto Yushi-seiyaku Co Ltd, Cospheric LLC, Luminex Corporation (Diasorin Spa), Bangs Laboratories Inc, 3M, Chase Corporation, Momentive, Potters Industries LLC, Siemens Healthineers AG, Mo-sci Corporation (Heraeus Holdings), Kureha Corporation, Trelleborg AB*List Not Exhaustive.
3. What are the main segments of the Microspheres Industry?
The market segments include Raw Material, Type, Application.
4. Can you provide details about the market size?
The market size is estimated to be USD 7.95 Million as of 2022.
5. What are some drivers contributing to market growth?
Increasing Application and Advancements in Medical Industry; Increasing Demand from Cosmetics Industry.
6. What are the notable trends driving market growth?
Increasing Usage in the Medical Technology.
7. Are there any restraints impacting market growth?
High Production and Research and Development Cost.
8. Can you provide examples of recent developments in the market?
In June 2022, Nouryon introduced expancel HP92 microspheres to reduce weight and withstand high pressure in underbody coatings and sealants for the automotive industry. These microspheres are currently produced in Stockvik, Sweden, with production expected in Green Bay, Wisconsin, the United States, in early 2023.
9. What pricing options are available for accessing the report?
Pricing options include single-user, multi-user, and enterprise licenses priced at USD 4750, USD 5250, and USD 8750 respectively.
10. Is the market size provided in terms of value or volume?
The market size is provided in terms of value, measured in Million.
11. Are there any specific market keywords associated with the report?
Yes, the market keyword associated with the report is "Microspheres Industry," which aids in identifying and referencing the specific market segment covered.
12. How do I determine which pricing option suits my needs best?
The pricing options vary based on user requirements and access needs. Individual users may opt for single-user licenses, while businesses requiring broader access may choose multi-user or enterprise licenses for cost-effective access to the report.
13. Are there any additional resources or data provided in the Microspheres Industry report?
While the report offers comprehensive insights, it's advisable to review the specific contents or supplementary materials provided to ascertain if additional resources or data are available.
14. How can I stay updated on further developments or reports in the Microspheres Industry?
To stay informed about further developments, trends, and reports in the Microspheres Industry, consider subscribing to industry newsletters, following relevant companies and organizations, or regularly checking reputable industry news sources and publications.
Methodology
Step 1 - Identification of Relevant Samples Size from Population Database


Step 2 - Approaches for Defining Global Market Size (Value, Volume* & Price*)

Note*: In applicable scenarios
Step 3 - Data Sources
Primary Research
- Web Analytics
- Survey Reports
- Research Institute
- Latest Research Reports
- Opinion Leaders
Secondary Research
- Annual Reports
- White Paper
- Latest Press Release
- Industry Association
- Paid Database
- Investor Presentations

Step 4 - Data Triangulation
Involves using different sources of information in order to increase the validity of a study
These sources are likely to be stakeholders in a program - participants, other researchers, program staff, other community members, and so on.
Then we put all data in single framework & apply various statistical tools to find out the dynamic on the market.
During the analysis stage, feedback from the stakeholder groups would be compared to determine areas of agreement as well as areas of divergence