

Key Insights
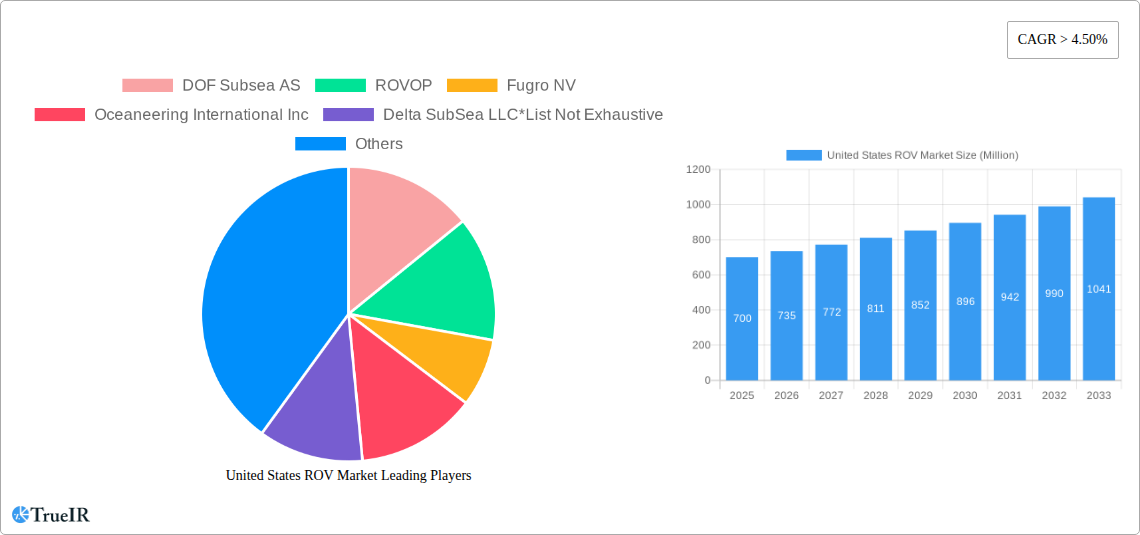
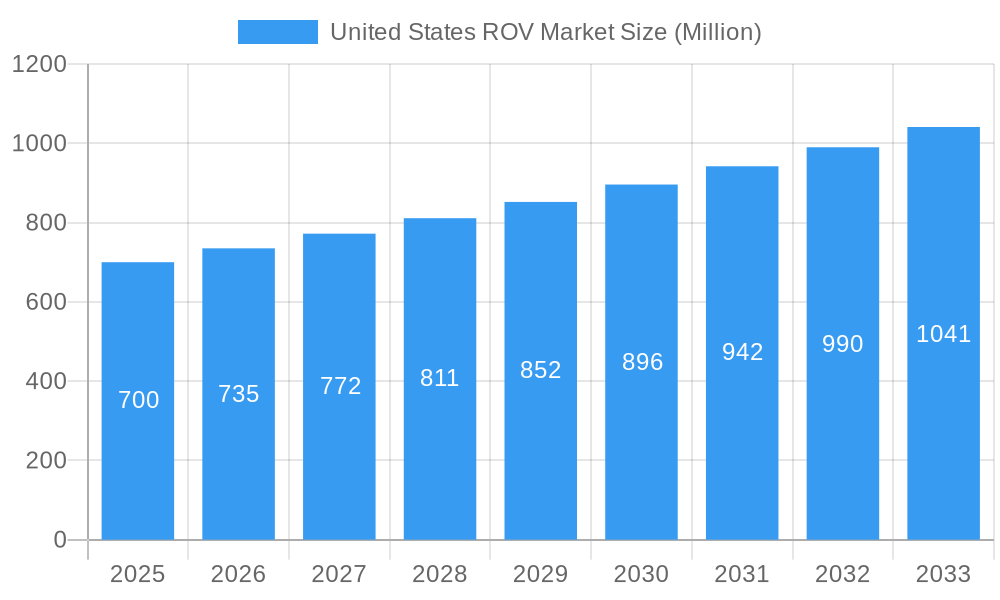
The United States Remotely Operated Vehicle (ROV) market is poised for significant expansion, propelled by escalating offshore oil and gas exploration, enhanced defense sector underwater surveillance needs, and broader adoption in infrastructure inspection and scientific research. The market is projected to grow at a Compound Annual Growth Rate (CAGR) of 7.9%. Based on current projections, the US ROV market is estimated to reach a market size of 159 million in the base year 2025. This growth trajectory is supported by substantial investments in offshore energy infrastructure and increasing government expenditure in defense and security. Key market segments include oil and gas, alongside survey, inspection, repair, and maintenance (IRM) activities. Work-class ROVs are expected to lead market demand due to their superior capabilities, while observatory-class ROVs will serve specialized research applications. The competitive landscape features prominent players such as Oceaneering International Inc., DOF Subsea AS, and Fugro NV, fostering an environment of continuous innovation. Future advancements will focus on automation, superior sensor technology, and the development of more agile ROVs for specialized tasks.
United States ROV Market Market Size (In Million)
Despite potential challenges such as volatile oil prices, stringent environmental regulations, and high initial investment costs, the long-term outlook for the US ROV market remains exceptionally positive. The increasing demand for efficient and cost-effective underwater operations across diverse industries, coupled with the integration of advanced technologies like AI-powered navigation and autonomous operation, will further enhance operational efficiency and mitigate human intervention risks. This confluence of market drivers and technological innovation positions the US ROV market for substantial growth throughout the forecast period (2025-2033).
United States ROV Market Company Market Share
United States ROV Market: A Comprehensive Market Report (2019-2033)
This in-depth report provides a comprehensive analysis of the United States Remotely Operated Vehicle (ROV) market, offering crucial insights for industry stakeholders, investors, and strategic decision-makers. The study covers the period from 2019 to 2033, with a focus on the estimated year 2025 and a forecast extending to 2033. This report leverages extensive market research and data analysis to present a clear picture of the current state and future trajectory of the US ROV market, valued at xx Million in 2025 and projected to reach xx Million by 2033.
United States ROV Market Structure & Competitive Landscape
The US ROV market exhibits a moderately concentrated structure, with several key players dominating significant market share. However, the presence of numerous smaller, specialized companies fosters innovation and competition. The market's competitive landscape is shaped by factors such as technological advancements, regulatory compliance (particularly concerning underwater operations and environmental impact), and the availability of substitute technologies for specific applications (e.g., AUVs for certain survey tasks). End-user segmentation is crucial, with the oil and gas sector historically being dominant, but diversification towards defense and other applications is driving growth. Mergers and acquisitions (M&A) activity has been relatively moderate in recent years, with a total volume of approximately xx M&A deals between 2019 and 2024, primarily focused on consolidating capabilities and expanding market reach. The concentration ratio (CR4) is estimated at xx%, indicating a moderately concentrated market.
- Market Concentration: Moderately concentrated, with a CR4 of approximately xx%.
- Innovation Drivers: Technological advancements in sensor technology, robotics, and AI.
- Regulatory Impacts: Stringent safety regulations for underwater operations and environmental protection.
- Product Substitutes: Autonomous Underwater Vehicles (AUVs) and other specialized underwater technologies.
- End-User Segmentation: Oil and Gas, Defense, and Other Applications (e.g., research, infrastructure inspection).
- M&A Trends: Moderate activity, driven by consolidation and expansion strategies.
United States ROV Market Trends & Opportunities
The US ROV market is experiencing robust growth, driven by a confluence of factors. The market size is projected to witness a Compound Annual Growth Rate (CAGR) of xx% from 2025 to 2033. Technological advancements, including improved sensor capabilities, enhanced maneuverability, and increased operational depths, are expanding ROV applications across various sectors. The increasing demand for subsea infrastructure inspection and maintenance, particularly in the offshore energy sector, fuels market expansion. Government investments in defense and maritime security further boost the market. However, competitive dynamics remain intense, with established players and new entrants vying for market share. Market penetration rates for ROVs in emerging applications like offshore wind energy are expected to increase significantly in the coming years, representing a key opportunity for market expansion. The growing adoption of remotely operated and autonomous technologies contributes to the overall growth, with the demand for improved efficiency and reduced operational costs driving market expansion.
Dominant Markets & Segments in United States ROV Market
The Oil and Gas sector remains the dominant application segment, accounting for approximately xx% of the market in 2025. However, the defense sector is experiencing significant growth, driven by increasing government spending on maritime surveillance and underwater operations. Within ROV types, Work Class ROVs hold the largest market share due to their versatility and capability for complex tasks, while Observatory Class ROVs cater to niche applications requiring high-resolution observation.
- Key Growth Drivers (Oil & Gas): Increasing offshore exploration and production activities, aging subsea infrastructure requiring maintenance.
- Key Growth Drivers (Defense): Rising defense budgets, increased focus on maritime security and underwater surveillance.
- Geographic Dominance: The Gulf of Mexico and the Atlantic Coast represent key regional markets due to significant offshore energy activities.
United States ROV Market Product Analysis
The US ROV market showcases a diverse range of products, from lightweight observation-class ROVs for shallow-water inspection to heavy-duty work-class ROVs capable of operating at significant depths and performing complex subsea tasks. Key technological advancements include improved sensor technology (e.g., high-resolution cameras, advanced sonar systems), enhanced manipulator arms for precise intervention, and improved control systems incorporating AI and automation for autonomous operations. This technological progress increases operational efficiency, reduces costs, and expands the range of applications for ROVs. The focus is on developing more efficient, reliable, and cost-effective systems that meet the demands of various industries and operating conditions.
Key Drivers, Barriers & Challenges in United States ROV Market
Key Drivers: Technological advancements in robotics, sensor technology, and AI are primary drivers. Increased demand for subsea infrastructure maintenance and inspection in the offshore energy sector, coupled with growing defense spending on maritime security, fuels market expansion. Favorable government policies and regulations supporting underwater technology development also play a role.
Challenges: Supply chain disruptions impact component availability and manufacturing timelines. Stringent regulatory requirements concerning safety and environmental protection can increase operational costs. Intense competition among established players and new entrants creates pricing pressure.
Growth Drivers in the United States ROV Market
Technological advancements, increasing offshore energy exploration, and rising defense spending are key growth drivers. The development of more robust, versatile, and efficient ROV systems along with the rising need for subsea infrastructure inspection and maintenance continues to propel market expansion. Government initiatives supporting innovation in underwater technologies also contribute to growth.
Challenges Impacting United States ROV Market Growth
Supply chain disruptions, stringent regulations, and fierce competition pose significant challenges. The cost of maintaining and repairing ROVs, coupled with the complexities of operating in harsh underwater environments, can also impact market growth.
Key Players Shaping the United States ROV Market
Significant United States ROV Market Industry Milestones
- August 2022: VideoRay LLC secured a substantial order for its Defender ROVs from the United States Navy, signifying a significant adoption of its technology for defense applications. This highlights the increasing demand for advanced ROV capabilities in the defense sector.
Future Outlook for United States ROV Market
The US ROV market is poised for continued growth, driven by technological innovation and increasing demand across various sectors. Strategic opportunities exist in developing advanced ROV systems for emerging applications, such as offshore wind energy and deep-sea mining. The market's potential for expansion remains significant, particularly in areas requiring subsea inspection, maintenance, and intervention.
United States ROV Market Segmentation
-
1. Type
- 1.1. Work Class ROV
- 1.2. Observatory Class ROV
-
2. Application
- 2.1. Oil and Gas
- 2.2. Defense
- 2.3. Other Applications
-
3. Activity
- 3.1. Survey
- 3.2. Inspection, Repair, and Maintenance
- 3.3. Other Activities
United States ROV Market Segmentation By Geography
- 1. United States
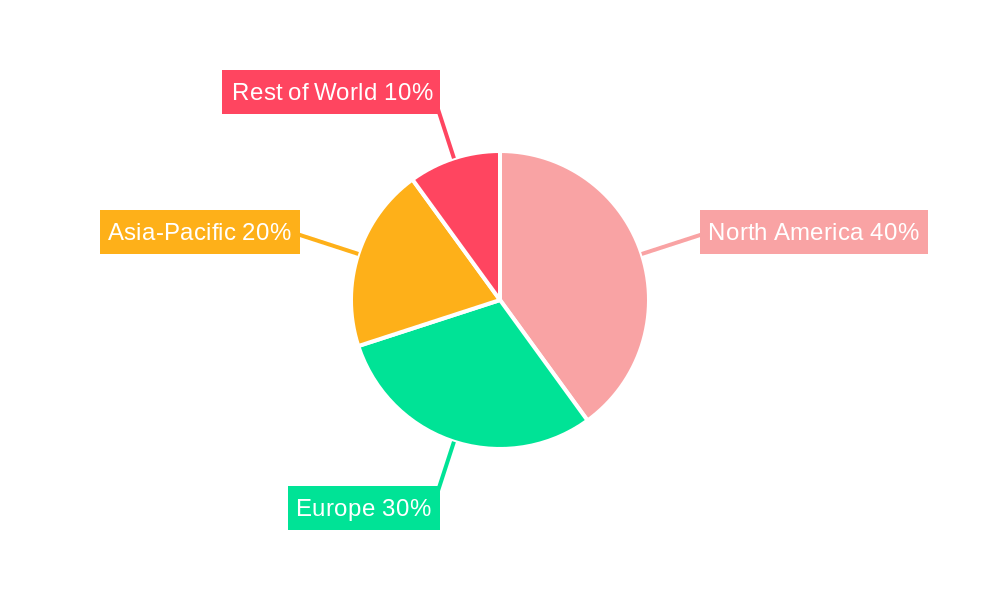
United States ROV Market Regional Market Share
Geographic Coverage of United States ROV Market
United States ROV Market REPORT HIGHLIGHTS
| Aspects | Details |
|---|---|
| Study Period | 2020-2034 |
| Base Year | 2025 |
| Estimated Year | 2026 |
| Forecast Period | 2026-2034 |
| Historical Period | 2020-2025 |
| Growth Rate | CAGR of 7.9% from 2020-2034 |
| Segmentation |
|
Table of Contents
- 1. Introduction
- 1.1. Research Scope
- 1.2. Market Segmentation
- 1.3. Research Methodology
- 1.4. Definitions and Assumptions
- 2. Executive Summary
- 2.1. Introduction
- 3. Market Dynamics
- 3.1. Introduction
- 3.2. Market Drivers
- 3.2.1 4.; Increasing Offshore Oil and Gas Exploration Activities in the American
- 3.2.2 Asia-Pacific
- 3.2.3 and Middle-East and African Regions4.; Growing Offshore Renewable Technologies
- 3.3. Market Restrains
- 3.3.1. 4.; Ban on Offshore Exploration and Production Activities in Multiple Regions
- 3.4. Market Trends
- 3.4.1 Inspection
- 3.4.2 Repair
- 3.4.3 and Maintenance Activity to Witness Significant Growth
- 4. Market Factor Analysis
- 4.1. Porters Five Forces
- 4.2. Supply/Value Chain
- 4.3. PESTEL analysis
- 4.4. Market Entropy
- 4.5. Patent/Trademark Analysis
- 5. United States ROV Market Analysis, Insights and Forecast, 2020-2032
- 5.1. Market Analysis, Insights and Forecast - by Type
- 5.1.1. Work Class ROV
- 5.1.2. Observatory Class ROV
- 5.2. Market Analysis, Insights and Forecast - by Application
- 5.2.1. Oil and Gas
- 5.2.2. Defense
- 5.2.3. Other Applications
- 5.3. Market Analysis, Insights and Forecast - by Activity
- 5.3.1. Survey
- 5.3.2. Inspection, Repair, and Maintenance
- 5.3.3. Other Activities
- 5.4. Market Analysis, Insights and Forecast - by Region
- 5.4.1. United States
- 5.1. Market Analysis, Insights and Forecast - by Type
- 6. Competitive Analysis
- 6.1. Market Share Analysis 2025
- 6.2. Company Profiles
- 6.2.1 DOF Subsea AS
- 6.2.1.1. Overview
- 6.2.1.2. Products
- 6.2.1.3. SWOT Analysis
- 6.2.1.4. Recent Developments
- 6.2.1.5. Financials (Based on Availability)
- 6.2.2 ROVOP
- 6.2.2.1. Overview
- 6.2.2.2. Products
- 6.2.2.3. SWOT Analysis
- 6.2.2.4. Recent Developments
- 6.2.2.5. Financials (Based on Availability)
- 6.2.3 Fugro NV
- 6.2.3.1. Overview
- 6.2.3.2. Products
- 6.2.3.3. SWOT Analysis
- 6.2.3.4. Recent Developments
- 6.2.3.5. Financials (Based on Availability)
- 6.2.4 Oceaneering International Inc
- 6.2.4.1. Overview
- 6.2.4.2. Products
- 6.2.4.3. SWOT Analysis
- 6.2.4.4. Recent Developments
- 6.2.4.5. Financials (Based on Availability)
- 6.2.5 Delta SubSea LLC*List Not Exhaustive
- 6.2.5.1. Overview
- 6.2.5.2. Products
- 6.2.5.3. SWOT Analysis
- 6.2.5.4. Recent Developments
- 6.2.5.5. Financials (Based on Availability)
- 6.2.6 Saipem SpA
- 6.2.6.1. Overview
- 6.2.6.2. Products
- 6.2.6.3. SWOT Analysis
- 6.2.6.4. Recent Developments
- 6.2.6.5. Financials (Based on Availability)
- 6.2.7 DeepOcean AS
- 6.2.7.1. Overview
- 6.2.7.2. Products
- 6.2.7.3. SWOT Analysis
- 6.2.7.4. Recent Developments
- 6.2.7.5. Financials (Based on Availability)
- 6.2.8 Helix Energy Solutions Group
- 6.2.8.1. Overview
- 6.2.8.2. Products
- 6.2.8.3. SWOT Analysis
- 6.2.8.4. Recent Developments
- 6.2.8.5. Financials (Based on Availability)
- 6.2.9 Forum Energy Technologies Inc
- 6.2.9.1. Overview
- 6.2.9.2. Products
- 6.2.9.3. SWOT Analysis
- 6.2.9.4. Recent Developments
- 6.2.9.5. Financials (Based on Availability)
- 6.2.10 TechnipFMC PLC
- 6.2.10.1. Overview
- 6.2.10.2. Products
- 6.2.10.3. SWOT Analysis
- 6.2.10.4. Recent Developments
- 6.2.10.5. Financials (Based on Availability)
- 6.2.1 DOF Subsea AS
List of Figures
- Figure 1: United States ROV Market Revenue Breakdown (million, %) by Product 2025 & 2033
- Figure 2: United States ROV Market Share (%) by Company 2025
List of Tables
- Table 1: United States ROV Market Revenue million Forecast, by Type 2020 & 2033
- Table 2: United States ROV Market Revenue million Forecast, by Application 2020 & 2033
- Table 3: United States ROV Market Revenue million Forecast, by Activity 2020 & 2033
- Table 4: United States ROV Market Revenue million Forecast, by Region 2020 & 2033
- Table 5: United States ROV Market Revenue million Forecast, by Type 2020 & 2033
- Table 6: United States ROV Market Revenue million Forecast, by Application 2020 & 2033
- Table 7: United States ROV Market Revenue million Forecast, by Activity 2020 & 2033
- Table 8: United States ROV Market Revenue million Forecast, by Country 2020 & 2033
Frequently Asked Questions
1. What is the projected Compound Annual Growth Rate (CAGR) of the United States ROV Market?
The projected CAGR is approximately 7.9%.
2. Which companies are prominent players in the United States ROV Market?
Key companies in the market include DOF Subsea AS, ROVOP, Fugro NV, Oceaneering International Inc, Delta SubSea LLC*List Not Exhaustive, Saipem SpA, DeepOcean AS, Helix Energy Solutions Group, Forum Energy Technologies Inc, TechnipFMC PLC.
3. What are the main segments of the United States ROV Market?
The market segments include Type, Application, Activity.
4. Can you provide details about the market size?
The market size is estimated to be USD 159 million as of 2022.
5. What are some drivers contributing to market growth?
4.; Increasing Offshore Oil and Gas Exploration Activities in the American. Asia-Pacific. and Middle-East and African Regions4.; Growing Offshore Renewable Technologies.
6. What are the notable trends driving market growth?
Inspection. Repair. and Maintenance Activity to Witness Significant Growth.
7. Are there any restraints impacting market growth?
4.; Ban on Offshore Exploration and Production Activities in Multiple Regions.
8. Can you provide examples of recent developments in the market?
August 2022: VideoRay LLC reported a large and diverse order for its Defender remotely operated vehicles (ROVs) by the United States Navy. The Navy is standardizing VideoRay Defender Mission Specialist systems due to the superior capabilities, flexibility, and upgradeability of many systems deployed since 2019. VideoRay's customer support for the Navy includes training facilities and staffing on the East Coast in Pottstown, Pennsylvania, and the West Coast in San Diego.
9. What pricing options are available for accessing the report?
Pricing options include single-user, multi-user, and enterprise licenses priced at USD 3800, USD 4500, and USD 5800 respectively.
10. Is the market size provided in terms of value or volume?
The market size is provided in terms of value, measured in million.
11. Are there any specific market keywords associated with the report?
Yes, the market keyword associated with the report is "United States ROV Market," which aids in identifying and referencing the specific market segment covered.
12. How do I determine which pricing option suits my needs best?
The pricing options vary based on user requirements and access needs. Individual users may opt for single-user licenses, while businesses requiring broader access may choose multi-user or enterprise licenses for cost-effective access to the report.
13. Are there any additional resources or data provided in the United States ROV Market report?
While the report offers comprehensive insights, it's advisable to review the specific contents or supplementary materials provided to ascertain if additional resources or data are available.
14. How can I stay updated on further developments or reports in the United States ROV Market?
To stay informed about further developments, trends, and reports in the United States ROV Market, consider subscribing to industry newsletters, following relevant companies and organizations, or regularly checking reputable industry news sources and publications.
Methodology
Step 1 - Identification of Relevant Samples Size from Population Database


Step 2 - Approaches for Defining Global Market Size (Value, Volume* & Price*)

Note*: In applicable scenarios
Step 3 - Data Sources
Primary Research
- Web Analytics
- Survey Reports
- Research Institute
- Latest Research Reports
- Opinion Leaders
Secondary Research
- Annual Reports
- White Paper
- Latest Press Release
- Industry Association
- Paid Database
- Investor Presentations

Step 4 - Data Triangulation
Involves using different sources of information in order to increase the validity of a study
These sources are likely to be stakeholders in a program - participants, other researchers, program staff, other community members, and so on.
Then we put all data in single framework & apply various statistical tools to find out the dynamic on the market.
During the analysis stage, feedback from the stakeholder groups would be compared to determine areas of agreement as well as areas of divergence