

Key Insights
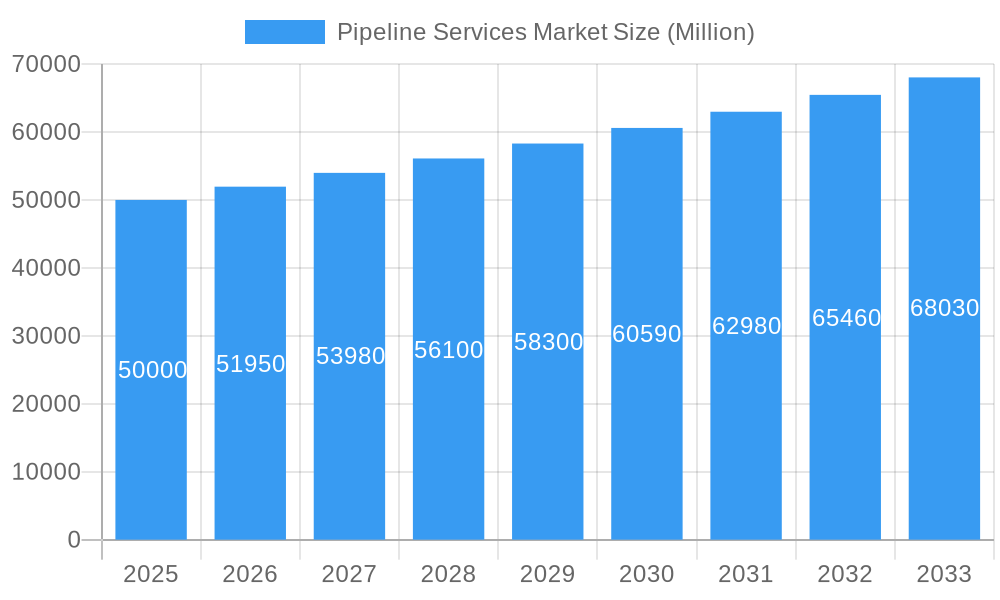
The global Pipeline Services Market is projected for substantial growth, expected to reach $4.15 billion by 2025, with a Compound Annual Growth Rate (CAGR) of 7.5% through 2033. This expansion is driven by increasing global energy demand, necessitating the development and maintenance of extensive oil, gas, and water pipeline networks. Key growth drivers include significant investments in new pipeline construction, particularly in emerging economies, and the continuous need for maintaining the integrity and operational efficiency of existing infrastructure through advanced inspection, repair, and cleaning services. Heightened focus on safety regulations and environmental protection further boosts demand for sophisticated pipeline services, including leak detection, corrosion prevention, and decommissioning of aging assets. Technological advancements, such as smart monitoring systems and robotic inspection tools, are also crucial in enhancing service efficiency and reducing operational costs.
Pipeline Services Market Market Size (In Billion)
The market comprises various service segments, with Pre-commissioning, Commissioning, Maintenance, and Inspection Services holding the largest share. Maintenance services, including repair and cleaning, are highly sought after due to aging infrastructure in developed regions and a proactive approach to preventing failures. Inspection services, such as intelligent pigging and integrity assessments, are vital for ensuring pipeline safety and longevity. The ongoing development of offshore and onshore pipeline projects across North America, Asia Pacific, and the Middle East highlights the market's global reach. Leading players like Baker Hughes Co, Tenaris SA, and Sunland Construction Inc. are actively engaged in providing comprehensive services, from construction and maintenance to advanced diagnostic solutions. The market's trajectory indicates sustained growth, fueled by energy security needs, infrastructure upgrades, and the adoption of innovative technologies for effective pipeline network management.
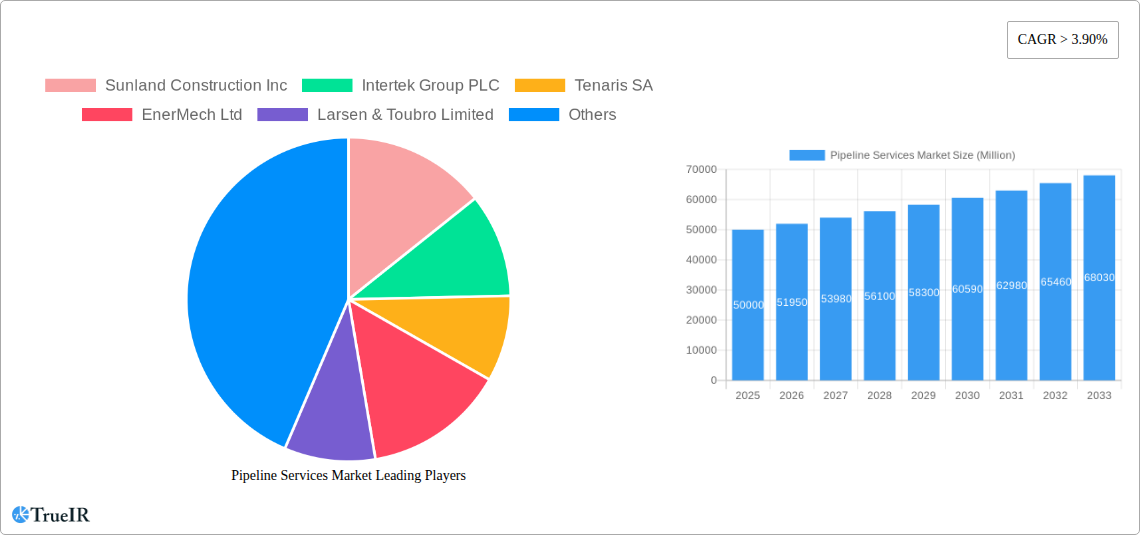
Pipeline Services Market Company Market Share
Global Pipeline Services Market Analysis, Trends, and Future Outlook (2019-2033)
This comprehensive report offers detailed analysis of the global Pipeline Services Market, providing critical insights for industry stakeholders. Covering the historical period from 2019 to 2024 and projecting growth through 2033, with a base year of 2025, this study examines market structure, trends, dominant segments, key players, and future opportunities. The report utilizes high-impact SEO keywords to ensure maximum industry visibility and engagement.
Pipeline Services Market Market Structure & Competitive Landscape
The Pipeline Services Market exhibits a moderately concentrated structure, with a blend of large, established players and specialized niche providers. Key innovation drivers include the increasing demand for energy infrastructure maintenance, the need for advanced inspection technologies to ensure safety and environmental compliance, and the growing trend towards decommissioning aging assets. Regulatory impacts are significant, with stringent safety and environmental regulations worldwide driving demand for comprehensive pipeline integrity management and inspection services. Product substitutes are limited in core pipeline services but can emerge in ancillary areas such as material sourcing for repairs. End-user segmentation is critical, with oil & gas (upstream, midstream, and downstream), water and wastewater, and industrial sectors being primary consumers. Mergers and acquisitions (M&A) are an active part of the market landscape, with approximately 15-20 significant M&A activities recorded annually over the historical period, driven by the pursuit of market share expansion and service portfolio diversification. Concentration ratios in specific service niches can reach up to 60% among the top five players.
Pipeline Services Market Market Trends & Opportunities
The global Pipeline Services Market is projected to experience robust growth, with an estimated Compound Annual Growth Rate (CAGR) of approximately 4.5% between 2025 and 2033. This expansion is fueled by a confluence of evolving industry dynamics and emerging opportunities. A primary trend is the escalating investment in the maintenance and upgrade of aging pipeline infrastructure across the oil, gas, and water sectors, driven by an imperative to prevent leaks and ensure operational reliability. Technological shifts are profoundly impacting the market, with the increasing adoption of advanced inspection technologies such as intelligent pigs (caliper, magnetic flux leakage, ultrasonic), drones for aerial surveys, and sophisticated data analytics for predictive maintenance. These innovations are not only enhancing efficiency and accuracy but also contributing to a significant reduction in downtime and operational costs. Consumer preferences are increasingly leaning towards service providers offering integrated solutions, encompassing the entire pipeline lifecycle from pre-commissioning to decommissioning, coupled with a strong emphasis on safety, environmental stewardship, and digital capabilities. The competitive landscape is intensifying, prompting companies to focus on specialized services, technological differentiation, and strategic partnerships. Opportunities abound in the development of smart pipeline solutions, remote monitoring systems, and eco-friendly cleaning and maintenance techniques. Furthermore, the global energy transition, while potentially impacting new oil and gas pipeline construction, is simultaneously creating significant demand for the maintenance and repurposing of existing infrastructure for alternative energy sources and the decommissioning of obsolete assets, presenting substantial growth avenues. The market penetration rate for advanced inspection services is projected to increase from roughly 35% in 2025 to over 55% by 2033, reflecting this technological adoption.
Dominant Markets & Segments in Pipeline Services Market
The Pipeline Services Market is characterized by a clear dominance in certain regions and segments, driven by established infrastructure, regulatory frameworks, and economic imperatives.
Leading Region: North America currently holds a dominant position in the Pipeline Services Market. This is primarily attributed to its extensive existing oil and gas pipeline network, coupled with significant ongoing investments in infrastructure development and maintenance. Stringent environmental regulations and a proactive approach to pipeline integrity management further bolster demand for specialized services. The United States, in particular, accounts for a substantial portion of the market share due to its vast energy production and consumption.
Dominant Service Type: Maintenance Services Within the Service Type segmentation, Maintenance Services are the largest and fastest-growing segment. This dominance is further broken down:
- Repair Services: Driven by the continuous need to address corrosion, mechanical damage, and operational wear and tear, repair services represent a substantial market share. Investments in extending the lifespan of existing pipelines contribute significantly to this segment.
- Cleaning Services: Essential for maintaining pipeline efficiency and preventing flow assurance issues, cleaning services, including hydro-jetting and chemical cleaning, are crucial. The increasing focus on product quality and operational performance makes this a vital component of maintenance.
Dominant Service Type: Inspection Services Inspection Services also command a significant market share and are experiencing robust growth due to regulatory mandates and safety concerns. Key sub-segments include:
- Intelligent (Smart) Pigging: This advanced inspection method, utilizing sophisticated tools to gather detailed data on pipeline integrity, is experiencing exponential growth. The demand for caliper pigging and other inline inspection (ILI) technologies for assessing wall thickness, detecting anomalies, and mapping the internal pipeline condition is a major market driver.
- Other Inspection Services: This broad category encompasses external visual inspections, non-destructive testing (NDT) methods like ultrasonic testing (UT) and radiography, and leak detection services, all of which are critical for comprehensive pipeline monitoring.
Dominant Location of Deployment: Onshore The Onshore segment represents the largest share of the Pipeline Services Market. This is due to the sheer volume and extent of onshore pipeline networks for oil, gas, and water distribution across the globe. While offshore services are critical for specific energy extraction operations, the widespread nature of terrestrial infrastructure makes onshore services more prevalent.
Growth Drivers for Dominant Segments:
- Infrastructure Ageing: A vast proportion of existing pipelines, particularly in North America and Europe, are decades old, necessitating continuous maintenance, repair, and inspection to prevent failures.
- Regulatory Compliance: Strict government regulations regarding pipeline safety, environmental protection, and leak detection are compelling operators to invest heavily in inspection and maintenance services. For instance, regulations like PHMSA in the US mandate regular integrity assessments.
- Energy Demand: Continued global demand for oil, gas, and water necessitates the reliable operation and expansion of pipeline networks, driving demand for pre-commissioning, commissioning, and ongoing maintenance services.
- Technological Advancements: The development and adoption of more accurate, efficient, and cost-effective inspection and maintenance technologies (e.g., AI-powered analytics for ILI data) are spurring growth in these segments.
Pipeline Services Market Product Analysis
The Pipeline Services Market is characterized by a range of essential services and evolving technological applications. Product innovations are primarily focused on enhancing inspection accuracy, improving maintenance efficiency, and ensuring environmental safety. Advanced intelligent pigs equipped with magnetic flux leakage (MFL), ultrasonic testing (UT), and eddy current technologies provide detailed internal pipeline condition assessments. Cleaning services are incorporating eco-friendly chemical solutions and high-pressure hydro-jetting techniques. Decommissioning services are seeing advancements in robotics and in-situ techniques to minimize environmental impact. The competitive advantage lies with companies offering integrated solutions, data-driven insights through advanced analytics, and adherence to stringent safety and environmental standards, thereby maximizing pipeline longevity and operational integrity.
Key Drivers, Barriers & Challenges in Pipeline Services Market
Key Drivers: The Pipeline Services Market is propelled by several key drivers. The aging global pipeline infrastructure necessitates extensive maintenance and repair services to ensure operational integrity and prevent environmental hazards. Escalating stringent regulatory frameworks globally, particularly concerning safety and environmental protection, mandate regular inspections and compliance, driving demand for specialized services. The continued global demand for energy and water resources fuels investments in new pipeline construction and the upkeep of existing networks. Furthermore, technological advancements in inspection technologies, such as intelligent pigs and digital monitoring systems, offer more efficient and accurate solutions, creating opportunities for growth.
Barriers & Challenges: Despite strong growth potential, the market faces several challenges. Fluctuations in oil and gas prices can impact capital expenditure budgets for pipeline projects and maintenance, acting as a significant restraint. Regulatory hurdles and complex permitting processes in different regions can delay project execution. Supply chain disruptions for specialized equipment and skilled labor can also pose challenges. Intense competition among service providers leads to price pressures, impacting profit margins. The need for significant upfront investment in advanced technologies and infrastructure presents a barrier for smaller market players. For example, the cost of deploying advanced ILI tools can range from $10,000 to $50,000 per inspection.
Growth Drivers in the Pipeline Services Market Market
The Pipeline Services Market is experiencing significant growth driven by critical factors. The aging global pipeline infrastructure, with a substantial portion exceeding its design life, necessitates continuous and advanced maintenance and repair services to prevent failures and ensure operational reliability. Regulatory bodies worldwide are imposing stricter safety and environmental standards, compelling pipeline operators to invest heavily in comprehensive inspection, integrity management, and leak detection services. The ongoing global demand for energy resources, including oil, gas, and increasingly, water, fuels investments in both the construction of new pipeline networks and the crucial upkeep of existing ones. Technological advancements, such as the development of sophisticated intelligent pigging systems, drone-based inspections, and data analytics for predictive maintenance, are enhancing the efficiency, accuracy, and cost-effectiveness of pipeline services, creating new avenues for market expansion.
Challenges Impacting Pipeline Services Market Growth
Several barriers and restraints are impacting the growth trajectory of the Pipeline Services Market. Volatility in global commodity prices, particularly for oil and gas, directly influences the capital expenditure budgets of operators, leading to potential cutbacks in non-essential maintenance and new project investments. Navigating the complex and often fragmented regulatory landscape across different countries and regions can lead to project delays and increased compliance costs. Supply chain complexities, including the availability of specialized equipment, skilled labor shortages in niche areas, and logistical challenges, can impede the timely execution of services. The highly competitive nature of the market often leads to intense price wars among service providers, potentially squeezing profit margins and limiting reinvestment in innovation. For instance, the cost of specialized inspection tools can be a barrier to entry for smaller firms.
Key Players Shaping the Pipeline Services Market Market
- Sunland Construction Inc
- Intertek Group PLC
- Tenaris SA
- EnerMech Ltd
- Larsen & Toubro Limited
- IKM Gruppen AS
- Ledcor Group
- Baker Hughes Co
- STATS Group
- T D Williamson
- Barnard Construction Company Inc
- Snelson Companies Inc
- Oil States Industries Inc
- Pumpco Inc
Significant Pipeline Services Market Industry Milestones
- 2019: Increased regulatory focus on methane emissions reporting drives demand for advanced leak detection and repair services.
- 2020: Introduction of AI-powered predictive maintenance platforms for pipeline integrity management by leading technology providers.
- 2021: Significant surge in decommissioning projects for aging offshore oil and gas platforms and associated pipelines in the North Sea.
- 2022: Growing adoption of drone technology for visual inspection of onshore pipelines, offering cost savings and enhanced safety.
- 2023: Major infrastructure investment initiatives announced by several governments, including the US and Canada, aimed at modernizing and expanding energy transportation networks.
- 2024: Expansion of digital twin technologies for real-time pipeline monitoring and simulation, enhancing operational efficiency and risk management.
Future Outlook for Pipeline Services Market Market
The future outlook for the Pipeline Services Market is exceedingly positive, driven by a confluence of enduring demands and emerging opportunities. The imperative to maintain and upgrade aging global pipeline infrastructure will continue to fuel consistent demand for maintenance, repair, and inspection services. The increasing stringency of environmental regulations and a global push towards sustainability will accelerate the adoption of eco-friendly cleaning techniques and advanced leak detection technologies, minimizing environmental impact. Furthermore, the energy transition, while potentially altering the landscape of new pipeline construction, will create substantial opportunities in the repurposing and decommissioning of existing assets, as well as the development of pipelines for new energy carriers. Technological innovation, particularly in the realm of data analytics, artificial intelligence, and smart monitoring systems, will further enhance service delivery, enabling predictive maintenance and optimizing operational efficiency, positioning the market for sustained, robust growth.
Pipeline Services Market Segmentation
-
1. Service Type
- 1.1. Pre-commissioning and Commissioning Services
-
1.2. Maintenance Services
- 1.2.1. Repair Services
- 1.2.2. Cleaning Services
-
1.3. Inspection Services
- 1.3.1. Intellig
- 1.3.2. Caliper Pigging
- 1.3.3. Other Inspection Services
- 1.4. Decommissioning Services
-
2. Location of Deployment
- 2.1. Onshore
- 2.2. Offshore
Pipeline Services Market Segmentation By Geography
- 1. North America
- 2. Asia Pacific
- 3. Europe
- 4. South America
- 5. Middle East
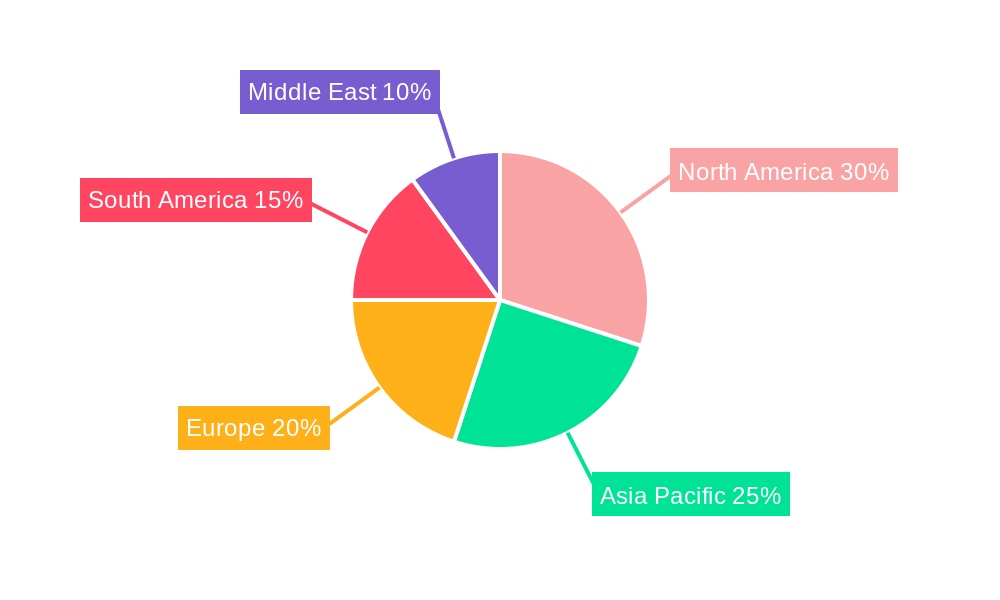
Pipeline Services Market Regional Market Share
Geographic Coverage of Pipeline Services Market
Pipeline Services Market REPORT HIGHLIGHTS
| Aspects | Details |
|---|---|
| Study Period | 2020-2034 |
| Base Year | 2025 |
| Estimated Year | 2026 |
| Forecast Period | 2026-2034 |
| Historical Period | 2020-2025 |
| Growth Rate | CAGR of 7.5% from 2020-2034 |
| Segmentation |
|
Table of Contents
- 1. Introduction
- 1.1. Research Scope
- 1.2. Market Segmentation
- 1.3. Research Methodology
- 1.4. Definitions and Assumptions
- 2. Executive Summary
- 2.1. Introduction
- 3. Market Dynamics
- 3.1. Introduction
- 3.2. Market Drivers
- 3.2.1. 4.; Rapid Recovery in the Oil and Gas and Mining Industries4.; Surge in the Construction Industry
- 3.3. Market Restrains
- 3.3.1. 4.; High Maintenance and Operation Costs of Submersible Pump Restrain the Market
- 3.4. Market Trends
- 3.4.1. Intelligent Pigging to be a Significant Market
- 4. Market Factor Analysis
- 4.1. Porters Five Forces
- 4.2. Supply/Value Chain
- 4.3. PESTEL analysis
- 4.4. Market Entropy
- 4.5. Patent/Trademark Analysis
- 5. Global Pipeline Services Market Analysis, Insights and Forecast, 2020-2032
- 5.1. Market Analysis, Insights and Forecast - by Service Type
- 5.1.1. Pre-commissioning and Commissioning Services
- 5.1.2. Maintenance Services
- 5.1.2.1. Repair Services
- 5.1.2.2. Cleaning Services
- 5.1.3. Inspection Services
- 5.1.3.1. Intellig
- 5.1.3.2. Caliper Pigging
- 5.1.3.3. Other Inspection Services
- 5.1.4. Decommissioning Services
- 5.2. Market Analysis, Insights and Forecast - by Location of Deployment
- 5.2.1. Onshore
- 5.2.2. Offshore
- 5.3. Market Analysis, Insights and Forecast - by Region
- 5.3.1. North America
- 5.3.2. Asia Pacific
- 5.3.3. Europe
- 5.3.4. South America
- 5.3.5. Middle East
- 5.1. Market Analysis, Insights and Forecast - by Service Type
- 6. North America Pipeline Services Market Analysis, Insights and Forecast, 2020-2032
- 6.1. Market Analysis, Insights and Forecast - by Service Type
- 6.1.1. Pre-commissioning and Commissioning Services
- 6.1.2. Maintenance Services
- 6.1.2.1. Repair Services
- 6.1.2.2. Cleaning Services
- 6.1.3. Inspection Services
- 6.1.3.1. Intellig
- 6.1.3.2. Caliper Pigging
- 6.1.3.3. Other Inspection Services
- 6.1.4. Decommissioning Services
- 6.2. Market Analysis, Insights and Forecast - by Location of Deployment
- 6.2.1. Onshore
- 6.2.2. Offshore
- 6.1. Market Analysis, Insights and Forecast - by Service Type
- 7. Asia Pacific Pipeline Services Market Analysis, Insights and Forecast, 2020-2032
- 7.1. Market Analysis, Insights and Forecast - by Service Type
- 7.1.1. Pre-commissioning and Commissioning Services
- 7.1.2. Maintenance Services
- 7.1.2.1. Repair Services
- 7.1.2.2. Cleaning Services
- 7.1.3. Inspection Services
- 7.1.3.1. Intellig
- 7.1.3.2. Caliper Pigging
- 7.1.3.3. Other Inspection Services
- 7.1.4. Decommissioning Services
- 7.2. Market Analysis, Insights and Forecast - by Location of Deployment
- 7.2.1. Onshore
- 7.2.2. Offshore
- 7.1. Market Analysis, Insights and Forecast - by Service Type
- 8. Europe Pipeline Services Market Analysis, Insights and Forecast, 2020-2032
- 8.1. Market Analysis, Insights and Forecast - by Service Type
- 8.1.1. Pre-commissioning and Commissioning Services
- 8.1.2. Maintenance Services
- 8.1.2.1. Repair Services
- 8.1.2.2. Cleaning Services
- 8.1.3. Inspection Services
- 8.1.3.1. Intellig
- 8.1.3.2. Caliper Pigging
- 8.1.3.3. Other Inspection Services
- 8.1.4. Decommissioning Services
- 8.2. Market Analysis, Insights and Forecast - by Location of Deployment
- 8.2.1. Onshore
- 8.2.2. Offshore
- 8.1. Market Analysis, Insights and Forecast - by Service Type
- 9. South America Pipeline Services Market Analysis, Insights and Forecast, 2020-2032
- 9.1. Market Analysis, Insights and Forecast - by Service Type
- 9.1.1. Pre-commissioning and Commissioning Services
- 9.1.2. Maintenance Services
- 9.1.2.1. Repair Services
- 9.1.2.2. Cleaning Services
- 9.1.3. Inspection Services
- 9.1.3.1. Intellig
- 9.1.3.2. Caliper Pigging
- 9.1.3.3. Other Inspection Services
- 9.1.4. Decommissioning Services
- 9.2. Market Analysis, Insights and Forecast - by Location of Deployment
- 9.2.1. Onshore
- 9.2.2. Offshore
- 9.1. Market Analysis, Insights and Forecast - by Service Type
- 10. Middle East Pipeline Services Market Analysis, Insights and Forecast, 2020-2032
- 10.1. Market Analysis, Insights and Forecast - by Service Type
- 10.1.1. Pre-commissioning and Commissioning Services
- 10.1.2. Maintenance Services
- 10.1.2.1. Repair Services
- 10.1.2.2. Cleaning Services
- 10.1.3. Inspection Services
- 10.1.3.1. Intellig
- 10.1.3.2. Caliper Pigging
- 10.1.3.3. Other Inspection Services
- 10.1.4. Decommissioning Services
- 10.2. Market Analysis, Insights and Forecast - by Location of Deployment
- 10.2.1. Onshore
- 10.2.2. Offshore
- 10.1. Market Analysis, Insights and Forecast - by Service Type
- 11. Competitive Analysis
- 11.1. Global Market Share Analysis 2025
- 11.2. Company Profiles
- 11.2.1 Sunland Construction Inc
- 11.2.1.1. Overview
- 11.2.1.2. Products
- 11.2.1.3. SWOT Analysis
- 11.2.1.4. Recent Developments
- 11.2.1.5. Financials (Based on Availability)
- 11.2.2 Intertek Group PLC
- 11.2.2.1. Overview
- 11.2.2.2. Products
- 11.2.2.3. SWOT Analysis
- 11.2.2.4. Recent Developments
- 11.2.2.5. Financials (Based on Availability)
- 11.2.3 Tenaris SA
- 11.2.3.1. Overview
- 11.2.3.2. Products
- 11.2.3.3. SWOT Analysis
- 11.2.3.4. Recent Developments
- 11.2.3.5. Financials (Based on Availability)
- 11.2.4 EnerMech Ltd
- 11.2.4.1. Overview
- 11.2.4.2. Products
- 11.2.4.3. SWOT Analysis
- 11.2.4.4. Recent Developments
- 11.2.4.5. Financials (Based on Availability)
- 11.2.5 Larsen & Toubro Limited
- 11.2.5.1. Overview
- 11.2.5.2. Products
- 11.2.5.3. SWOT Analysis
- 11.2.5.4. Recent Developments
- 11.2.5.5. Financials (Based on Availability)
- 11.2.6 IKM Gruppen AS
- 11.2.6.1. Overview
- 11.2.6.2. Products
- 11.2.6.3. SWOT Analysis
- 11.2.6.4. Recent Developments
- 11.2.6.5. Financials (Based on Availability)
- 11.2.7 Ledcor Group
- 11.2.7.1. Overview
- 11.2.7.2. Products
- 11.2.7.3. SWOT Analysis
- 11.2.7.4. Recent Developments
- 11.2.7.5. Financials (Based on Availability)
- 11.2.8 Baker Hughes Co
- 11.2.8.1. Overview
- 11.2.8.2. Products
- 11.2.8.3. SWOT Analysis
- 11.2.8.4. Recent Developments
- 11.2.8.5. Financials (Based on Availability)
- 11.2.9 STATS Group
- 11.2.9.1. Overview
- 11.2.9.2. Products
- 11.2.9.3. SWOT Analysis
- 11.2.9.4. Recent Developments
- 11.2.9.5. Financials (Based on Availability)
- 11.2.10 T D Williamson*List Not Exhaustive
- 11.2.10.1. Overview
- 11.2.10.2. Products
- 11.2.10.3. SWOT Analysis
- 11.2.10.4. Recent Developments
- 11.2.10.5. Financials (Based on Availability)
- 11.2.11 Barnard Construction Company Inc
- 11.2.11.1. Overview
- 11.2.11.2. Products
- 11.2.11.3. SWOT Analysis
- 11.2.11.4. Recent Developments
- 11.2.11.5. Financials (Based on Availability)
- 11.2.12 Snelson Companies Inc
- 11.2.12.1. Overview
- 11.2.12.2. Products
- 11.2.12.3. SWOT Analysis
- 11.2.12.4. Recent Developments
- 11.2.12.5. Financials (Based on Availability)
- 11.2.13 Oil States Industries Inc
- 11.2.13.1. Overview
- 11.2.13.2. Products
- 11.2.13.3. SWOT Analysis
- 11.2.13.4. Recent Developments
- 11.2.13.5. Financials (Based on Availability)
- 11.2.14 Pumpco Inc
- 11.2.14.1. Overview
- 11.2.14.2. Products
- 11.2.14.3. SWOT Analysis
- 11.2.14.4. Recent Developments
- 11.2.14.5. Financials (Based on Availability)
- 11.2.1 Sunland Construction Inc
List of Figures
- Figure 1: Global Pipeline Services Market Revenue Breakdown (billion, %) by Region 2025 & 2033
- Figure 2: North America Pipeline Services Market Revenue (billion), by Service Type 2025 & 2033
- Figure 3: North America Pipeline Services Market Revenue Share (%), by Service Type 2025 & 2033
- Figure 4: North America Pipeline Services Market Revenue (billion), by Location of Deployment 2025 & 2033
- Figure 5: North America Pipeline Services Market Revenue Share (%), by Location of Deployment 2025 & 2033
- Figure 6: North America Pipeline Services Market Revenue (billion), by Country 2025 & 2033
- Figure 7: North America Pipeline Services Market Revenue Share (%), by Country 2025 & 2033
- Figure 8: Asia Pacific Pipeline Services Market Revenue (billion), by Service Type 2025 & 2033
- Figure 9: Asia Pacific Pipeline Services Market Revenue Share (%), by Service Type 2025 & 2033
- Figure 10: Asia Pacific Pipeline Services Market Revenue (billion), by Location of Deployment 2025 & 2033
- Figure 11: Asia Pacific Pipeline Services Market Revenue Share (%), by Location of Deployment 2025 & 2033
- Figure 12: Asia Pacific Pipeline Services Market Revenue (billion), by Country 2025 & 2033
- Figure 13: Asia Pacific Pipeline Services Market Revenue Share (%), by Country 2025 & 2033
- Figure 14: Europe Pipeline Services Market Revenue (billion), by Service Type 2025 & 2033
- Figure 15: Europe Pipeline Services Market Revenue Share (%), by Service Type 2025 & 2033
- Figure 16: Europe Pipeline Services Market Revenue (billion), by Location of Deployment 2025 & 2033
- Figure 17: Europe Pipeline Services Market Revenue Share (%), by Location of Deployment 2025 & 2033
- Figure 18: Europe Pipeline Services Market Revenue (billion), by Country 2025 & 2033
- Figure 19: Europe Pipeline Services Market Revenue Share (%), by Country 2025 & 2033
- Figure 20: South America Pipeline Services Market Revenue (billion), by Service Type 2025 & 2033
- Figure 21: South America Pipeline Services Market Revenue Share (%), by Service Type 2025 & 2033
- Figure 22: South America Pipeline Services Market Revenue (billion), by Location of Deployment 2025 & 2033
- Figure 23: South America Pipeline Services Market Revenue Share (%), by Location of Deployment 2025 & 2033
- Figure 24: South America Pipeline Services Market Revenue (billion), by Country 2025 & 2033
- Figure 25: South America Pipeline Services Market Revenue Share (%), by Country 2025 & 2033
- Figure 26: Middle East Pipeline Services Market Revenue (billion), by Service Type 2025 & 2033
- Figure 27: Middle East Pipeline Services Market Revenue Share (%), by Service Type 2025 & 2033
- Figure 28: Middle East Pipeline Services Market Revenue (billion), by Location of Deployment 2025 & 2033
- Figure 29: Middle East Pipeline Services Market Revenue Share (%), by Location of Deployment 2025 & 2033
- Figure 30: Middle East Pipeline Services Market Revenue (billion), by Country 2025 & 2033
- Figure 31: Middle East Pipeline Services Market Revenue Share (%), by Country 2025 & 2033
List of Tables
- Table 1: Global Pipeline Services Market Revenue billion Forecast, by Service Type 2020 & 2033
- Table 2: Global Pipeline Services Market Revenue billion Forecast, by Location of Deployment 2020 & 2033
- Table 3: Global Pipeline Services Market Revenue billion Forecast, by Region 2020 & 2033
- Table 4: Global Pipeline Services Market Revenue billion Forecast, by Service Type 2020 & 2033
- Table 5: Global Pipeline Services Market Revenue billion Forecast, by Location of Deployment 2020 & 2033
- Table 6: Global Pipeline Services Market Revenue billion Forecast, by Country 2020 & 2033
- Table 7: Global Pipeline Services Market Revenue billion Forecast, by Service Type 2020 & 2033
- Table 8: Global Pipeline Services Market Revenue billion Forecast, by Location of Deployment 2020 & 2033
- Table 9: Global Pipeline Services Market Revenue billion Forecast, by Country 2020 & 2033
- Table 10: Global Pipeline Services Market Revenue billion Forecast, by Service Type 2020 & 2033
- Table 11: Global Pipeline Services Market Revenue billion Forecast, by Location of Deployment 2020 & 2033
- Table 12: Global Pipeline Services Market Revenue billion Forecast, by Country 2020 & 2033
- Table 13: Global Pipeline Services Market Revenue billion Forecast, by Service Type 2020 & 2033
- Table 14: Global Pipeline Services Market Revenue billion Forecast, by Location of Deployment 2020 & 2033
- Table 15: Global Pipeline Services Market Revenue billion Forecast, by Country 2020 & 2033
- Table 16: Global Pipeline Services Market Revenue billion Forecast, by Service Type 2020 & 2033
- Table 17: Global Pipeline Services Market Revenue billion Forecast, by Location of Deployment 2020 & 2033
- Table 18: Global Pipeline Services Market Revenue billion Forecast, by Country 2020 & 2033
Frequently Asked Questions
1. What is the projected Compound Annual Growth Rate (CAGR) of the Pipeline Services Market?
The projected CAGR is approximately 7.5%.
2. Which companies are prominent players in the Pipeline Services Market?
Key companies in the market include Sunland Construction Inc, Intertek Group PLC, Tenaris SA, EnerMech Ltd, Larsen & Toubro Limited, IKM Gruppen AS, Ledcor Group, Baker Hughes Co, STATS Group, T D Williamson*List Not Exhaustive, Barnard Construction Company Inc, Snelson Companies Inc, Oil States Industries Inc, Pumpco Inc.
3. What are the main segments of the Pipeline Services Market?
The market segments include Service Type, Location of Deployment.
4. Can you provide details about the market size?
The market size is estimated to be USD 4.15 billion as of 2022.
5. What are some drivers contributing to market growth?
4.; Rapid Recovery in the Oil and Gas and Mining Industries4.; Surge in the Construction Industry.
6. What are the notable trends driving market growth?
Intelligent Pigging to be a Significant Market.
7. Are there any restraints impacting market growth?
4.; High Maintenance and Operation Costs of Submersible Pump Restrain the Market.
8. Can you provide examples of recent developments in the market?
N/A
9. What pricing options are available for accessing the report?
Pricing options include single-user, multi-user, and enterprise licenses priced at USD 4750, USD 5250, and USD 8750 respectively.
10. Is the market size provided in terms of value or volume?
The market size is provided in terms of value, measured in billion.
11. Are there any specific market keywords associated with the report?
Yes, the market keyword associated with the report is "Pipeline Services Market," which aids in identifying and referencing the specific market segment covered.
12. How do I determine which pricing option suits my needs best?
The pricing options vary based on user requirements and access needs. Individual users may opt for single-user licenses, while businesses requiring broader access may choose multi-user or enterprise licenses for cost-effective access to the report.
13. Are there any additional resources or data provided in the Pipeline Services Market report?
While the report offers comprehensive insights, it's advisable to review the specific contents or supplementary materials provided to ascertain if additional resources or data are available.
14. How can I stay updated on further developments or reports in the Pipeline Services Market?
To stay informed about further developments, trends, and reports in the Pipeline Services Market, consider subscribing to industry newsletters, following relevant companies and organizations, or regularly checking reputable industry news sources and publications.
Methodology
Step 1 - Identification of Relevant Samples Size from Population Database


Step 2 - Approaches for Defining Global Market Size (Value, Volume* & Price*)

Note*: In applicable scenarios
Step 3 - Data Sources
Primary Research
- Web Analytics
- Survey Reports
- Research Institute
- Latest Research Reports
- Opinion Leaders
Secondary Research
- Annual Reports
- White Paper
- Latest Press Release
- Industry Association
- Paid Database
- Investor Presentations

Step 4 - Data Triangulation
Involves using different sources of information in order to increase the validity of a study
These sources are likely to be stakeholders in a program - participants, other researchers, program staff, other community members, and so on.
Then we put all data in single framework & apply various statistical tools to find out the dynamic on the market.
During the analysis stage, feedback from the stakeholder groups would be compared to determine areas of agreement as well as areas of divergence