

Key Insights
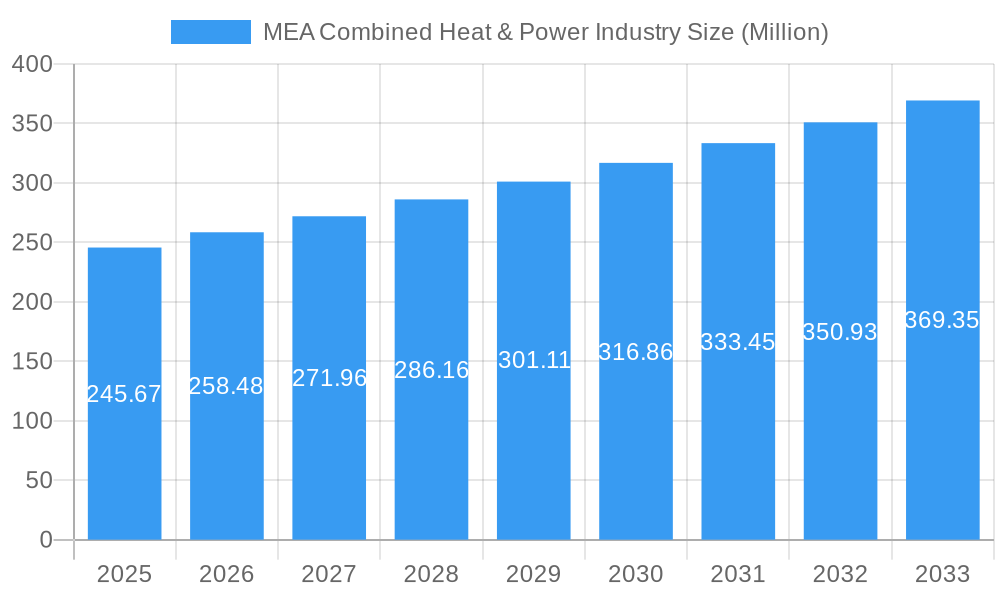
The Middle East and Africa (MEA) Combined Heat & Power (CHP) industry is poised for robust expansion, driven by an increasing demand for energy efficiency and a growing focus on sustainable energy solutions across industrial, commercial, and residential sectors. The market, valued at approximately USD 245.67 million in 2025, is projected to witness a Compound Annual Growth Rate (CAGR) exceeding 5.10% through 2033. This growth is fueled by the inherent economic advantages of CHP systems, which simultaneously generate electricity and useful heat, leading to significant reductions in fuel consumption and operational costs. Key drivers include government initiatives promoting energy conservation, rising electricity prices, and the imperative to decarbonize energy footprints. Furthermore, the escalating need for reliable and decentralized power generation, especially in regions with less developed grid infrastructure, positions CHP as a critical technology for enhancing energy security and resilience. The trend towards modular and scalable CHP solutions, alongside advancements in cleaner fuel technologies such as biomass, is expected to further accelerate market adoption.
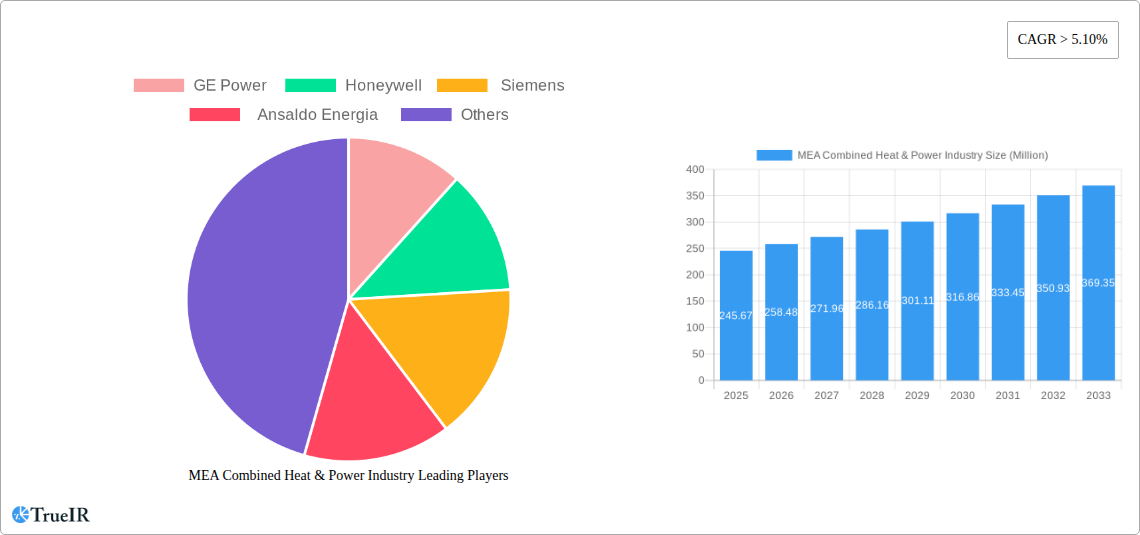
MEA Combined Heat & Power Industry Market Size (In Million)
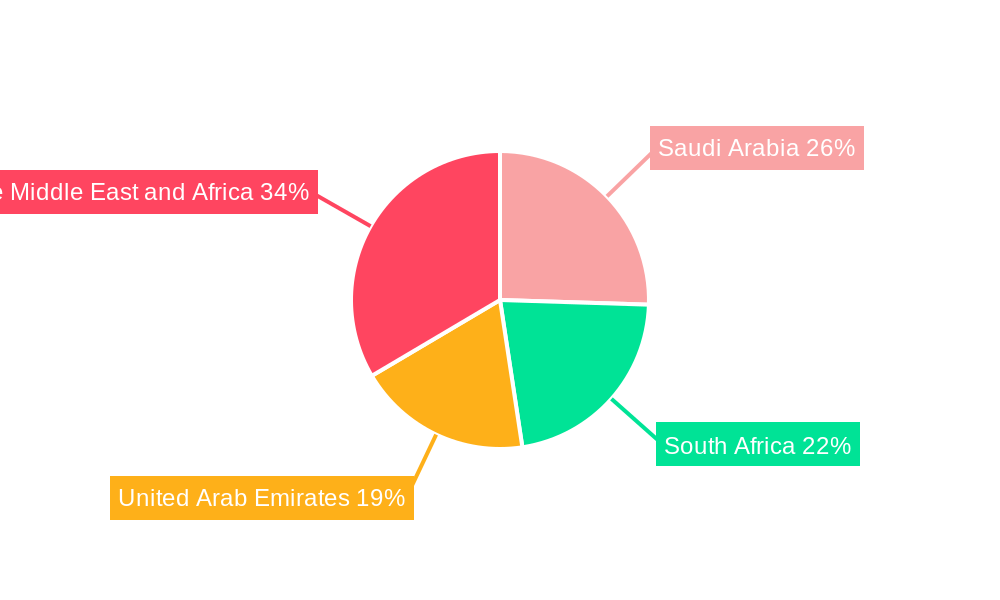
The MEA CHP market is characterized by a diverse range of segments, with fuel type and application playing crucial roles in market dynamics. Natural gas is anticipated to dominate the fuel segment due to its availability and relatively lower emissions compared to diesel, though biomass is gaining traction as a sustainable alternative. The industrial sector is expected to remain the largest application segment, leveraging CHP for process heat and power requirements. However, the commercial and residential sectors are showing promising growth potential as awareness of energy efficiency benefits spreads. Geographically, countries like Saudi Arabia, South Africa, and the United Arab Emirates are expected to lead market growth, driven by substantial industrial development, energy infrastructure investments, and proactive environmental policies. The "Rest of the Middle East and Africa" region also presents significant untapped potential, with emerging economies gradually adopting advanced energy technologies. Despite the positive outlook, the high initial capital investment for CHP systems and the availability of subsidized conventional energy sources in some areas may pose as moderate restraints, although these are increasingly being offset by long-term operational savings and regulatory support.
MEA Combined Heat & Power Industry Company Market Share
Here's the SEO-optimized report description for the MEA Combined Heat & Power Industry Market, designed for immediate use without modification.
Report Title: MEA Combined Heat & Power Industry Market: Comprehensive Analysis, Forecasts, and Strategic Insights (2019-2033)
Report Description:
Unlock unparalleled insights into the burgeoning Middle East and Africa (MEA) Combined Heat & Power (CHP) industry with this definitive market analysis. Covering the period from 2019 to 2033, with a base and estimated year of 2025, this report provides a granular view of market dynamics, competitive landscapes, and future growth trajectories. Explore the immense potential of decentralized energy generation, driven by increasing demand for energy efficiency, industrial expansion, and residential power solutions across the MEA region. This report is essential for stakeholders seeking to capitalize on the evolving CHP market, including technology providers, project developers, investors, and policymakers. Dive deep into market segmentation by capacity (Small-scale, Medium-scale, Large-scale), fuel types (Natural Gas, Diesel, Biomass, Others), and application sectors (Industrial, Commercial, Residential). Understand the strategic moves of key players like GE Power, Honeywell, Siemens, and Ansaldo Energia, and gain a competitive edge with actionable intelligence.
MEA Combined Heat & Power Industry Market Structure & Competitive Landscape
The MEA Combined Heat & Power (CHP) industry is characterized by a dynamic and evolving competitive landscape, with a moderate degree of market concentration. Leading players such as GE Power, Honeywell, and Siemens command significant market share due to their extensive product portfolios, technological innovation, and established customer relationships. The market's innovation drivers are primarily centered around enhancing energy efficiency, reducing emissions, and developing more adaptable and cost-effective CHP solutions. Regulatory impacts are increasingly positive, with governments across the MEA region promoting energy security, sustainability, and the adoption of cleaner energy technologies, which directly benefits the CHP sector. Product substitutes, such as standalone power generation and separate heating/cooling systems, exist but are often less energy-efficient and cost-effective than integrated CHP solutions. End-user segmentation reveals a strong demand from the industrial sector, driven by the need for reliable and cost-efficient process heat and electricity, followed by commercial and residential applications. Mergers and acquisitions (M&A) trends are moderate, with a few strategic acquisitions aimed at consolidating market presence or acquiring niche technologies. For instance, a hypothetical M&A volume of approximately $500 Million was observed in the historical period. The concentration ratio of the top three players is estimated at around 55%, indicating a competitive yet consolidated market.
MEA Combined Heat & Power Industry Market Trends & Opportunities
The MEA Combined Heat & Power (CHP) industry is poised for substantial growth, driven by a confluence of economic, environmental, and technological factors. The market size is projected to expand significantly, with an estimated Compound Annual Growth Rate (CAGR) of 7.5% during the forecast period of 2025-2033. This growth is fueled by increasing energy demands across the region, coupled with a growing emphasis on energy independence and efficiency. Technological shifts are playing a crucial role, with advancements in gas turbine technology, heat recovery systems, and digital control solutions enhancing the performance and reliability of CHP systems. The adoption of modular and smaller-scale CHP units is also on the rise, catering to a broader range of applications and smaller energy consumers. Consumer preferences are increasingly aligning with sustainable and cost-effective energy solutions, making CHP a highly attractive option. The industrial sector, a cornerstone of economic activity in many MEA nations, represents a prime opportunity for CHP adoption due to its significant energy consumption and the inherent benefits of waste heat utilization for industrial processes. Furthermore, the development of smart grids and the integration of renewable energy sources with CHP systems present new avenues for market penetration and optimization. The report forecasts the market size to reach approximately $15 Billion by 2033, up from an estimated $8 Billion in 2025. Market penetration rates are expected to rise from 12% in 2025 to an anticipated 25% by 2033. The increasing focus on reducing carbon footprints and meeting stringent environmental regulations is also a major catalyst for CHP adoption. Opportunities exist in developing hybrid CHP systems that integrate solar thermal or biomass inputs, further enhancing their sustainability credentials. The commercial sector, including hotels, hospitals, and data centers, is also a growing segment, recognizing the operational cost savings and improved energy resilience offered by CHP. The residential sector, while currently nascent, holds long-term potential as urbanization increases and demand for efficient heating and cooling solutions grows.
Dominant Markets & Segments in MEA Combined Heat & Power Industry
The MEA Combined Heat & Power (CHP) industry exhibits distinct dominance across various market segments, driven by unique regional demands and economic structures.
Dominant Capacity Segment: Large-scale (above 50 MW) installations currently dominate the MEA CHP market. This is primarily due to significant investments in large industrial complexes, petrochemical plants, and power generation facilities that require substantial and consistent energy output. These large-scale projects benefit from economies of scale, making them more economically viable for major industrial players and national utilities.
Dominant Fuel Type: Natural Gas is the predominant fuel source for CHP systems in the MEA region. The abundant reserves of natural gas across many countries in the Middle East make it a readily available and cost-effective fuel. Its lower emissions profile compared to diesel also aligns with environmental objectives.
Dominant Application Sector: The Industrial application segment is the largest contributor to the MEA CHP market. Industries such as oil and gas, petrochemicals, manufacturing, and food processing have high thermal and electrical energy demands that can be efficiently met through CHP. The ability to utilize process heat for power generation or vice versa offers substantial operational cost savings.
Leading Regions/Countries: Key countries driving the MEA CHP market include the United Arab Emirates, Saudi Arabia, Qatar, and Egypt, owing to their robust industrial sectors and significant investments in energy infrastructure. African nations are increasingly showing interest, particularly in areas with biomass availability or a need for decentralized energy solutions.
Detailed Analysis of Market Dominance:
The dominance of large-scale CHP installations is directly linked to the region's industrial backbone. For example, major oil and gas refineries and petrochemical complexes necessitate continuous and high-capacity power and heat, making large CHP units the most practical and economical choice. The preference for natural gas is a logical consequence of resource availability and competitive pricing. Many countries in the GCC region have actively promoted the use of natural gas for power generation and industrial processes, further solidifying its position. The industrial sector's dominance is a testament to the core value proposition of CHP – energy efficiency and cost reduction. By capturing waste heat that would otherwise be lost, industries can significantly lower their energy bills and improve their competitive edge. The growth in these countries is further supported by government policies encouraging industrial diversification and self-sufficiency in energy supply. The African continent, while currently having a smaller share, presents significant growth opportunities, especially in the medium and small-scale segments for commercial and residential applications, driven by the need to expand electricity access and reduce reliance on imported fuels.
MEA Combined Heat & Power Industry Product Analysis
The MEA Combined Heat & Power (CHP) industry is witnessing significant product innovation focused on enhancing efficiency, reliability, and environmental performance. Advanced gas turbine designs, improved heat recovery steam generators (HRSG), and sophisticated digital control systems are at the forefront of these advancements. These innovations lead to higher electrical efficiency and greater flexibility in utilizing diverse heat sources. Applications range from powering large industrial complexes with process heat to providing efficient heating and cooling for commercial buildings and even residential districts. Competitive advantages are derived from lower operational costs, reduced carbon emissions, and enhanced energy security. Technological advancements also include the development of modular CHP systems that offer scalability and faster deployment, catering to a wider spectrum of market needs and smaller project scopes.
Key Drivers, Barriers & Challenges in MEA Combined Heat & Power Industry
Key Drivers:
The MEA Combined Heat & Power industry is propelled by several key drivers. Technological advancements in turbine efficiency and heat recovery systems are making CHP solutions more competitive. Economic factors, such as rising energy prices and the demand for cost-effective industrial operations, are significant motivators. Government policies and regulations promoting energy efficiency, sustainability, and reducing carbon emissions are creating a favorable market environment. For instance, government incentives for adopting cleaner energy technologies are a major catalyst. The increasing energy demand across industrial, commercial, and residential sectors further fuels the need for efficient and reliable power generation.
Barriers & Challenges:
Despite strong drivers, the MEA CHP market faces several challenges. High initial capital investment for large-scale CHP projects can be a significant barrier, particularly for smaller enterprises. Regulatory complexities and permitting processes can cause delays and increase project development costs. Supply chain issues and the availability of skilled labor for installation and maintenance can also pose challenges. Furthermore, competition from established, standalone energy generation technologies and the volatility of fuel prices can impact the long-term economic viability of certain CHP projects. The need for reliable fuel supply infrastructure is also critical.
Growth Drivers in the MEA Combined Heat & Power Industry Market
The MEA Combined Heat & Power (CHP) industry is experiencing robust growth fueled by a multi-faceted set of drivers. Technological advancements in gas turbine efficiency, waste heat recovery systems, and control technologies are enhancing the performance and economic viability of CHP systems. Economic factors, including the increasing cost of grid electricity and the drive for operational cost savings in industrial and commercial sectors, are major motivators. Supportive government policies and incentives aimed at promoting energy efficiency, reducing carbon footprints, and enhancing energy security are creating a conducive environment. For example, tax breaks and subsidies for renewable-integrated CHP systems are crucial. The growing demand for decentralized energy solutions and the need to meet escalating energy requirements across various sectors are also significant growth catalysts.
Challenges Impacting MEA Combined Heat & Power Industry Growth
Several barriers and restraints are impacting the growth trajectory of the MEA Combined Heat & Power industry. High upfront capital expenditure for the installation of CHP systems remains a significant hurdle, especially for small to medium-sized enterprises. Regulatory complexities and lengthy permitting procedures can lead to project delays and increased development costs. Supply chain disruptions and the availability of specialized components and skilled labor for installation and maintenance are ongoing concerns. Competition from established, conventional power generation methods and the fluctuating prices of natural gas can also create uncertainty and impact the perceived economic advantage of CHP. Furthermore, lack of awareness and understanding of CHP benefits among potential end-users in certain sub-regions presents a marketing challenge.
Key Players Shaping the MEA Combined Heat & Power Industry Market
- GE Power
- Honeywell
- Siemens
- Ansaldo Energia
Significant MEA Combined Heat & Power Industry Industry Milestones
- March 2023: Qatar Water and Electricity Company awarded General Electric Company contracts for operations and maintenance services for its 9F gas turbines at the Ras Abu Fontas B2 (RAF B2) Cogeneration Plant in Doha. The contract duration is nine years, highlighting long-term operational commitment and a focus on efficient power and water generation.
- December 2022: The African Development Bank confirmed the submission of project proposals for Drobonso and Yoni Combined Heat and Power Bioenergy (CHPB) plants in Ghana and Sierra Leone, respectively. Each plant is planned with an installed capacity of 5 MWe (electric) and 11 MW (thermal), signaling growing interest in bioenergy-based CHP solutions and decentralized power generation in West Africa.
Future Outlook for MEA Combined Heat & Power Industry Market
The future outlook for the MEA Combined Heat & Power (CHP) industry is exceptionally promising, driven by a strong impetus towards sustainable energy solutions and enhanced energy efficiency. Strategic opportunities lie in the development of hybrid CHP systems that integrate renewable energy sources like solar thermal and biomass, further bolstering their environmental credentials and market appeal. The increasing demand for reliable and cost-effective energy in the rapidly industrializing and urbanizing regions of MEA will continue to fuel the adoption of CHP. Furthermore, supportive government policies, coupled with ongoing technological innovations that reduce costs and improve performance, will create a fertile ground for market expansion across industrial, commercial, and eventually, residential applications. The market potential for decentralized energy generation and waste heat utilization remains vast, positioning CHP as a cornerstone of future energy infrastructure in the MEA region.
MEA Combined Heat & Power Industry Segmentation
-
1. Capacity
- 1.1. Small-scale (below 20 MW)
- 1.2. Medium-scale (20-50 MW)
- 1.3. Large-scale (above 50 MW)
-
2. Fuel
- 2.1. Natural gas
- 2.2. Diesel
- 2.3. Biomass
- 2.4. Others
-
3. Application
- 3.1. Industrial
- 3.2. Commercial
- 3.3. Residential
MEA Combined Heat & Power Industry Segmentation By Geography
- 1. Saudi Arabia
- 2. South Africa
- 3. United Arab Emirates
- 4. Rest of the Middle East and Africa
MEA Combined Heat & Power Industry Regional Market Share
Geographic Coverage of MEA Combined Heat & Power Industry
MEA Combined Heat & Power Industry REPORT HIGHLIGHTS
| Aspects | Details |
|---|---|
| Study Period | 2020-2034 |
| Base Year | 2025 |
| Estimated Year | 2026 |
| Forecast Period | 2026-2034 |
| Historical Period | 2020-2025 |
| Growth Rate | CAGR of > 5.10% from 2020-2034 |
| Segmentation |
|
Table of Contents
- 1. Introduction
- 1.1. Research Scope
- 1.2. Market Segmentation
- 1.3. Research Methodology
- 1.4. Definitions and Assumptions
- 2. Executive Summary
- 2.1. Introduction
- 3. Market Dynamics
- 3.1. Introduction
- 3.2. Market Drivers
- 3.2.1. 4.; Increasing Industrial Growth4.; Energy Efficiency
- 3.3. Market Restrains
- 3.3.1. 4.; Penetration of Alternative Energy Sources
- 3.4. Market Trends
- 3.4.1. Biomass Expected to See Significant Market Growth
- 4. Market Factor Analysis
- 4.1. Porters Five Forces
- 4.2. Supply/Value Chain
- 4.3. PESTEL analysis
- 4.4. Market Entropy
- 4.5. Patent/Trademark Analysis
- 5. Global MEA Combined Heat & Power Industry Analysis, Insights and Forecast, 2020-2032
- 5.1. Market Analysis, Insights and Forecast - by Capacity
- 5.1.1. Small-scale (below 20 MW)
- 5.1.2. Medium-scale (20-50 MW)
- 5.1.3. Large-scale (above 50 MW)
- 5.2. Market Analysis, Insights and Forecast - by Fuel
- 5.2.1. Natural gas
- 5.2.2. Diesel
- 5.2.3. Biomass
- 5.2.4. Others
- 5.3. Market Analysis, Insights and Forecast - by Application
- 5.3.1. Industrial
- 5.3.2. Commercial
- 5.3.3. Residential
- 5.4. Market Analysis, Insights and Forecast - by Region
- 5.4.1. Saudi Arabia
- 5.4.2. South Africa
- 5.4.3. United Arab Emirates
- 5.4.4. Rest of the Middle East and Africa
- 5.1. Market Analysis, Insights and Forecast - by Capacity
- 6. Saudi Arabia MEA Combined Heat & Power Industry Analysis, Insights and Forecast, 2020-2032
- 6.1. Market Analysis, Insights and Forecast - by Capacity
- 6.1.1. Small-scale (below 20 MW)
- 6.1.2. Medium-scale (20-50 MW)
- 6.1.3. Large-scale (above 50 MW)
- 6.2. Market Analysis, Insights and Forecast - by Fuel
- 6.2.1. Natural gas
- 6.2.2. Diesel
- 6.2.3. Biomass
- 6.2.4. Others
- 6.3. Market Analysis, Insights and Forecast - by Application
- 6.3.1. Industrial
- 6.3.2. Commercial
- 6.3.3. Residential
- 6.1. Market Analysis, Insights and Forecast - by Capacity
- 7. South Africa MEA Combined Heat & Power Industry Analysis, Insights and Forecast, 2020-2032
- 7.1. Market Analysis, Insights and Forecast - by Capacity
- 7.1.1. Small-scale (below 20 MW)
- 7.1.2. Medium-scale (20-50 MW)
- 7.1.3. Large-scale (above 50 MW)
- 7.2. Market Analysis, Insights and Forecast - by Fuel
- 7.2.1. Natural gas
- 7.2.2. Diesel
- 7.2.3. Biomass
- 7.2.4. Others
- 7.3. Market Analysis, Insights and Forecast - by Application
- 7.3.1. Industrial
- 7.3.2. Commercial
- 7.3.3. Residential
- 7.1. Market Analysis, Insights and Forecast - by Capacity
- 8. United Arab Emirates MEA Combined Heat & Power Industry Analysis, Insights and Forecast, 2020-2032
- 8.1. Market Analysis, Insights and Forecast - by Capacity
- 8.1.1. Small-scale (below 20 MW)
- 8.1.2. Medium-scale (20-50 MW)
- 8.1.3. Large-scale (above 50 MW)
- 8.2. Market Analysis, Insights and Forecast - by Fuel
- 8.2.1. Natural gas
- 8.2.2. Diesel
- 8.2.3. Biomass
- 8.2.4. Others
- 8.3. Market Analysis, Insights and Forecast - by Application
- 8.3.1. Industrial
- 8.3.2. Commercial
- 8.3.3. Residential
- 8.1. Market Analysis, Insights and Forecast - by Capacity
- 9. Rest of the Middle East and Africa MEA Combined Heat & Power Industry Analysis, Insights and Forecast, 2020-2032
- 9.1. Market Analysis, Insights and Forecast - by Capacity
- 9.1.1. Small-scale (below 20 MW)
- 9.1.2. Medium-scale (20-50 MW)
- 9.1.3. Large-scale (above 50 MW)
- 9.2. Market Analysis, Insights and Forecast - by Fuel
- 9.2.1. Natural gas
- 9.2.2. Diesel
- 9.2.3. Biomass
- 9.2.4. Others
- 9.3. Market Analysis, Insights and Forecast - by Application
- 9.3.1. Industrial
- 9.3.2. Commercial
- 9.3.3. Residential
- 9.1. Market Analysis, Insights and Forecast - by Capacity
- 10. Competitive Analysis
- 10.1. Global Market Share Analysis 2025
- 10.2. Company Profiles
- 10.2.1 GE Power
- 10.2.1.1. Overview
- 10.2.1.2. Products
- 10.2.1.3. SWOT Analysis
- 10.2.1.4. Recent Developments
- 10.2.1.5. Financials (Based on Availability)
- 10.2.2 Honeywell
- 10.2.2.1. Overview
- 10.2.2.2. Products
- 10.2.2.3. SWOT Analysis
- 10.2.2.4. Recent Developments
- 10.2.2.5. Financials (Based on Availability)
- 10.2.3 Siemens
- 10.2.3.1. Overview
- 10.2.3.2. Products
- 10.2.3.3. SWOT Analysis
- 10.2.3.4. Recent Developments
- 10.2.3.5. Financials (Based on Availability)
- 10.2.4 Ansaldo Energia
- 10.2.4.1. Overview
- 10.2.4.2. Products
- 10.2.4.3. SWOT Analysis
- 10.2.4.4. Recent Developments
- 10.2.4.5. Financials (Based on Availability)
- 10.2.1 GE Power
List of Figures
- Figure 1: Global MEA Combined Heat & Power Industry Revenue Breakdown (Million, %) by Region 2025 & 2033
- Figure 2: Saudi Arabia MEA Combined Heat & Power Industry Revenue (Million), by Capacity 2025 & 2033
- Figure 3: Saudi Arabia MEA Combined Heat & Power Industry Revenue Share (%), by Capacity 2025 & 2033
- Figure 4: Saudi Arabia MEA Combined Heat & Power Industry Revenue (Million), by Fuel 2025 & 2033
- Figure 5: Saudi Arabia MEA Combined Heat & Power Industry Revenue Share (%), by Fuel 2025 & 2033
- Figure 6: Saudi Arabia MEA Combined Heat & Power Industry Revenue (Million), by Application 2025 & 2033
- Figure 7: Saudi Arabia MEA Combined Heat & Power Industry Revenue Share (%), by Application 2025 & 2033
- Figure 8: Saudi Arabia MEA Combined Heat & Power Industry Revenue (Million), by Country 2025 & 2033
- Figure 9: Saudi Arabia MEA Combined Heat & Power Industry Revenue Share (%), by Country 2025 & 2033
- Figure 10: South Africa MEA Combined Heat & Power Industry Revenue (Million), by Capacity 2025 & 2033
- Figure 11: South Africa MEA Combined Heat & Power Industry Revenue Share (%), by Capacity 2025 & 2033
- Figure 12: South Africa MEA Combined Heat & Power Industry Revenue (Million), by Fuel 2025 & 2033
- Figure 13: South Africa MEA Combined Heat & Power Industry Revenue Share (%), by Fuel 2025 & 2033
- Figure 14: South Africa MEA Combined Heat & Power Industry Revenue (Million), by Application 2025 & 2033
- Figure 15: South Africa MEA Combined Heat & Power Industry Revenue Share (%), by Application 2025 & 2033
- Figure 16: South Africa MEA Combined Heat & Power Industry Revenue (Million), by Country 2025 & 2033
- Figure 17: South Africa MEA Combined Heat & Power Industry Revenue Share (%), by Country 2025 & 2033
- Figure 18: United Arab Emirates MEA Combined Heat & Power Industry Revenue (Million), by Capacity 2025 & 2033
- Figure 19: United Arab Emirates MEA Combined Heat & Power Industry Revenue Share (%), by Capacity 2025 & 2033
- Figure 20: United Arab Emirates MEA Combined Heat & Power Industry Revenue (Million), by Fuel 2025 & 2033
- Figure 21: United Arab Emirates MEA Combined Heat & Power Industry Revenue Share (%), by Fuel 2025 & 2033
- Figure 22: United Arab Emirates MEA Combined Heat & Power Industry Revenue (Million), by Application 2025 & 2033
- Figure 23: United Arab Emirates MEA Combined Heat & Power Industry Revenue Share (%), by Application 2025 & 2033
- Figure 24: United Arab Emirates MEA Combined Heat & Power Industry Revenue (Million), by Country 2025 & 2033
- Figure 25: United Arab Emirates MEA Combined Heat & Power Industry Revenue Share (%), by Country 2025 & 2033
- Figure 26: Rest of the Middle East and Africa MEA Combined Heat & Power Industry Revenue (Million), by Capacity 2025 & 2033
- Figure 27: Rest of the Middle East and Africa MEA Combined Heat & Power Industry Revenue Share (%), by Capacity 2025 & 2033
- Figure 28: Rest of the Middle East and Africa MEA Combined Heat & Power Industry Revenue (Million), by Fuel 2025 & 2033
- Figure 29: Rest of the Middle East and Africa MEA Combined Heat & Power Industry Revenue Share (%), by Fuel 2025 & 2033
- Figure 30: Rest of the Middle East and Africa MEA Combined Heat & Power Industry Revenue (Million), by Application 2025 & 2033
- Figure 31: Rest of the Middle East and Africa MEA Combined Heat & Power Industry Revenue Share (%), by Application 2025 & 2033
- Figure 32: Rest of the Middle East and Africa MEA Combined Heat & Power Industry Revenue (Million), by Country 2025 & 2033
- Figure 33: Rest of the Middle East and Africa MEA Combined Heat & Power Industry Revenue Share (%), by Country 2025 & 2033
List of Tables
- Table 1: Global MEA Combined Heat & Power Industry Revenue Million Forecast, by Capacity 2020 & 2033
- Table 2: Global MEA Combined Heat & Power Industry Revenue Million Forecast, by Fuel 2020 & 2033
- Table 3: Global MEA Combined Heat & Power Industry Revenue Million Forecast, by Application 2020 & 2033
- Table 4: Global MEA Combined Heat & Power Industry Revenue Million Forecast, by Region 2020 & 2033
- Table 5: Global MEA Combined Heat & Power Industry Revenue Million Forecast, by Capacity 2020 & 2033
- Table 6: Global MEA Combined Heat & Power Industry Revenue Million Forecast, by Fuel 2020 & 2033
- Table 7: Global MEA Combined Heat & Power Industry Revenue Million Forecast, by Application 2020 & 2033
- Table 8: Global MEA Combined Heat & Power Industry Revenue Million Forecast, by Country 2020 & 2033
- Table 9: Global MEA Combined Heat & Power Industry Revenue Million Forecast, by Capacity 2020 & 2033
- Table 10: Global MEA Combined Heat & Power Industry Revenue Million Forecast, by Fuel 2020 & 2033
- Table 11: Global MEA Combined Heat & Power Industry Revenue Million Forecast, by Application 2020 & 2033
- Table 12: Global MEA Combined Heat & Power Industry Revenue Million Forecast, by Country 2020 & 2033
- Table 13: Global MEA Combined Heat & Power Industry Revenue Million Forecast, by Capacity 2020 & 2033
- Table 14: Global MEA Combined Heat & Power Industry Revenue Million Forecast, by Fuel 2020 & 2033
- Table 15: Global MEA Combined Heat & Power Industry Revenue Million Forecast, by Application 2020 & 2033
- Table 16: Global MEA Combined Heat & Power Industry Revenue Million Forecast, by Country 2020 & 2033
- Table 17: Global MEA Combined Heat & Power Industry Revenue Million Forecast, by Capacity 2020 & 2033
- Table 18: Global MEA Combined Heat & Power Industry Revenue Million Forecast, by Fuel 2020 & 2033
- Table 19: Global MEA Combined Heat & Power Industry Revenue Million Forecast, by Application 2020 & 2033
- Table 20: Global MEA Combined Heat & Power Industry Revenue Million Forecast, by Country 2020 & 2033
Frequently Asked Questions
1. What is the projected Compound Annual Growth Rate (CAGR) of the MEA Combined Heat & Power Industry?
The projected CAGR is approximately > 5.10%.
2. Which companies are prominent players in the MEA Combined Heat & Power Industry?
Key companies in the market include GE Power , Honeywell, Siemens, Ansaldo Energia .
3. What are the main segments of the MEA Combined Heat & Power Industry?
The market segments include Capacity, Fuel, Application.
4. Can you provide details about the market size?
The market size is estimated to be USD 245.67 Million as of 2022.
5. What are some drivers contributing to market growth?
4.; Increasing Industrial Growth4.; Energy Efficiency.
6. What are the notable trends driving market growth?
Biomass Expected to See Significant Market Growth.
7. Are there any restraints impacting market growth?
4.; Penetration of Alternative Energy Sources.
8. Can you provide examples of recent developments in the market?
Mar 2023: Qatar Water and Electricity Company announced that it was awarded General Electric Company contracts to provide operations and maintenance services for its 9F gas turbines installed at the Ras Abu Fontas B2 (RAF B2) Cogeneration Plant in Doha. The duration of the contract awarded is nine years.
9. What pricing options are available for accessing the report?
Pricing options include single-user, multi-user, and enterprise licenses priced at USD 4750, USD 5250, and USD 8750 respectively.
10. Is the market size provided in terms of value or volume?
The market size is provided in terms of value, measured in Million.
11. Are there any specific market keywords associated with the report?
Yes, the market keyword associated with the report is "MEA Combined Heat & Power Industry," which aids in identifying and referencing the specific market segment covered.
12. How do I determine which pricing option suits my needs best?
The pricing options vary based on user requirements and access needs. Individual users may opt for single-user licenses, while businesses requiring broader access may choose multi-user or enterprise licenses for cost-effective access to the report.
13. Are there any additional resources or data provided in the MEA Combined Heat & Power Industry report?
While the report offers comprehensive insights, it's advisable to review the specific contents or supplementary materials provided to ascertain if additional resources or data are available.
14. How can I stay updated on further developments or reports in the MEA Combined Heat & Power Industry?
To stay informed about further developments, trends, and reports in the MEA Combined Heat & Power Industry, consider subscribing to industry newsletters, following relevant companies and organizations, or regularly checking reputable industry news sources and publications.
Methodology
Step 1 - Identification of Relevant Samples Size from Population Database


Step 2 - Approaches for Defining Global Market Size (Value, Volume* & Price*)

Note*: In applicable scenarios
Step 3 - Data Sources
Primary Research
- Web Analytics
- Survey Reports
- Research Institute
- Latest Research Reports
- Opinion Leaders
Secondary Research
- Annual Reports
- White Paper
- Latest Press Release
- Industry Association
- Paid Database
- Investor Presentations

Step 4 - Data Triangulation
Involves using different sources of information in order to increase the validity of a study
These sources are likely to be stakeholders in a program - participants, other researchers, program staff, other community members, and so on.
Then we put all data in single framework & apply various statistical tools to find out the dynamic on the market.
During the analysis stage, feedback from the stakeholder groups would be compared to determine areas of agreement as well as areas of divergence