

Key Insights
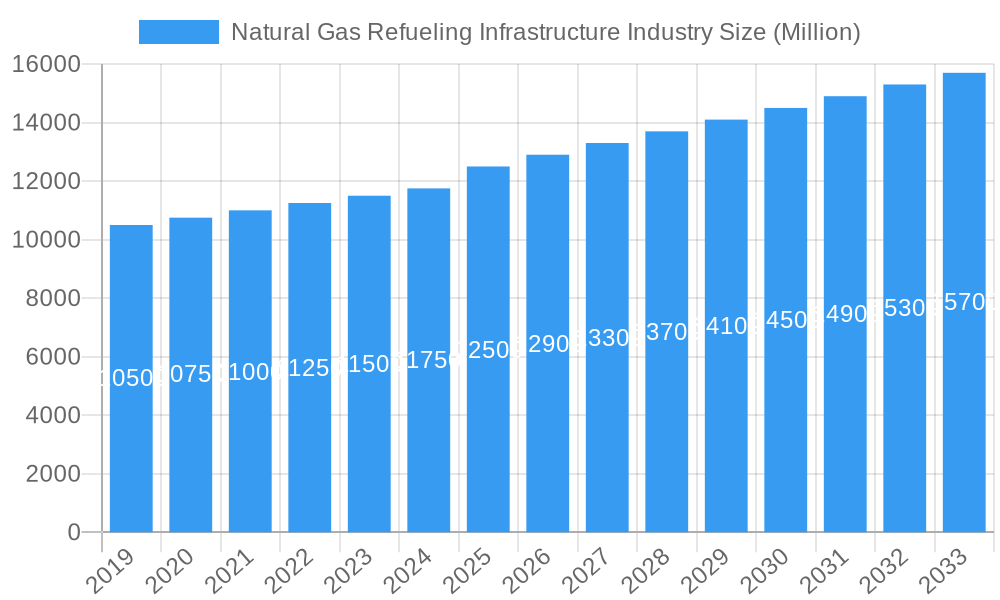
The global Natural Gas Refueling Infrastructure market is poised for significant expansion, projected to reach a market size of approximately $12,500 million by 2025, with a robust Compound Annual Growth Rate (CAGR) exceeding 3.50% through 2033. This growth is primarily propelled by an increasing global emphasis on cleaner energy alternatives and the rising adoption of natural gas vehicles (NGVs) across various sectors, including public transportation, commercial fleets, and private passenger vehicles. Key drivers include government initiatives promoting the use of natural gas for environmental benefits, such as reduced greenhouse gas emissions and improved air quality, coupled with the relatively lower cost of natural gas compared to traditional fossil fuels. Technological advancements in refueling station technology, leading to faster and more efficient refueling processes for both Compressed Natural Gas (CNG) and Liquefied Natural Gas (LNG), are also contributing to market momentum. The infrastructure development for both CNG and LNG segments is crucial, with LNG expected to gain traction in heavy-duty and long-haul transportation due to its higher energy density and longer range capabilities.
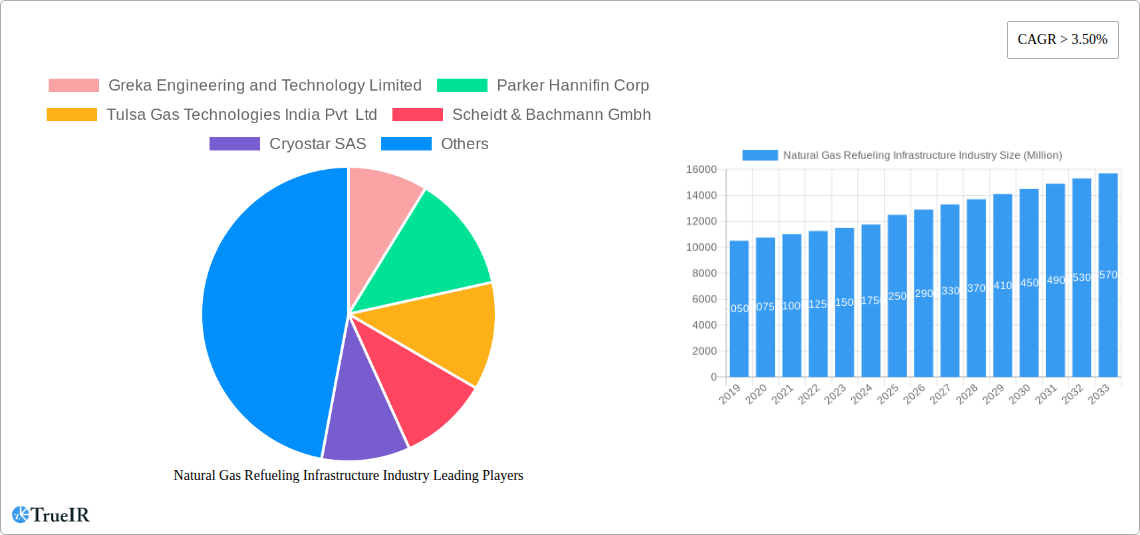
Natural Gas Refueling Infrastructure Industry Market Size (In Billion)
The market's expansion is further supported by ongoing investments from prominent players like Greka Engineering and Technology Limited, Parker Hannifin Corp, and Clean Energy Fuels, who are actively developing and deploying innovative refueling solutions. However, the market faces certain restraints, including the initial high capital investment required for establishing refueling stations and the need for standardized regulations and safety protocols across different regions. Geographically, the Asia Pacific region is anticipated to witness substantial growth due to its large population, rapid industrialization, and government mandates for cleaner fuels. North America and Europe, with their established NGV markets and supportive policies, will continue to be significant contributors. The strategic development of refueling infrastructure, encompassing both public and private dispensing stations, will be critical to unlocking the full potential of natural gas as a mainstream transportation fuel, thereby facilitating a smoother transition towards a more sustainable energy future.
Natural Gas Refueling Infrastructure Industry Company Market Share
Natural Gas Refueling Infrastructure Industry: Market Analysis and Forecast 2019–2033
This comprehensive report delves into the dynamic Natural Gas Refueling Infrastructure Industry, offering in-depth analysis and future projections. Covering the period from 2019 to 2033, with a base year of 2025 and a forecast period of 2025–2033, this report provides critical insights for stakeholders, investors, and industry participants. Our analysis is meticulously structured to highlight market structure, trends, opportunities, dominant segments, product innovations, key drivers, challenges, leading companies, significant milestones, and the future outlook for this rapidly evolving sector.
Natural Gas Refueling Infrastructure Industry Market Structure & Competitive Landscape
The natural gas refueling infrastructure market exhibits a moderately consolidated structure, with a mix of established global players and emerging regional innovators. Key companies like Greka Engineering and Technology Limited, Parker Hannifin Corp, Tulsa Gas Technologies India Pvt Ltd, Scheidt & Bachmann Gmbh, Cryostar SAS, Sanki Industry Group, Tatsuno Europe AS, Gilbarco Inc, Clean Energy Fuels, and FTI International Group Inc are actively competing. Innovation is a primary driver, with companies investing heavily in R&D for faster, more efficient, and safer refueling technologies. Regulatory impacts, particularly government incentives for natural gas vehicle adoption and emissions standards, are significant influencers on market expansion. Product substitutes, such as electric vehicle charging infrastructure, pose a competitive threat, but the established advantages of natural gas in terms of range and refueling time, especially for heavy-duty applications, maintain its relevance. End-user segmentation primarily includes fleet operators (transportation, logistics), public transportation authorities, and industrial applications. Mergers and acquisitions (M&A) are an ongoing trend, with larger companies acquiring smaller, specialized firms to expand their technological portfolios and market reach. We estimate an approximate M&A volume of 150 Million USD annually over the forecast period. The industry concentration ratio for the top 5 players is estimated to be around 55% in the base year.
Natural Gas Refueling Infrastructure Industry Market Trends & Opportunities
The Natural Gas Refueling Infrastructure Industry is poised for substantial growth, driven by a confluence of technological advancements, evolving consumer preferences, and supportive government policies. The global market size is projected to reach approximately 25 Billion USD by 2025, with an anticipated Compound Annual Growth Rate (CAGR) of 9.5% from 2025 to 2033. This robust growth is fueled by the increasing adoption of natural gas vehicles (NGVs), particularly in the heavy-duty truck and bus segments, where the economic and environmental benefits are most pronounced. Technological shifts are focusing on enhancing the efficiency and speed of refueling processes. Innovations in dispenser technology, compression systems, and liquefied natural gas (LNG) liquefaction are reducing refueling times and operational costs for station operators and vehicle owners. The development of smaller, modular refueling units is also expanding accessibility in diverse geographical locations. Consumer preferences are increasingly leaning towards cleaner fuel alternatives due to growing environmental awareness and the desire to reduce operational expenses. The lower cost of natural gas compared to traditional fuels, coupled with its reduced emissions profile (lower particulate matter and CO2), makes it an attractive option for fleet managers and businesses aiming to improve their sustainability credentials and manage fuel budgets effectively. Competitive dynamics are intensifying as more companies enter the market, leading to price competition and a push for superior product offerings. Opportunities abound for companies that can offer integrated solutions, including smart station management systems, renewable natural gas (RNG) integration, and advanced payment and access control technologies. The increasing focus on decarbonization across various industries presents a significant opportunity for natural gas to act as a bridging fuel, complementing renewable energy sources and further driving demand for refueling infrastructure. The market penetration rate of NGVs is expected to grow from 7% in 2024 to 15% by 2033 in key developed markets.
Dominant Markets & Segments in Natural Gas Refueling Infrastructure Industry
The Natural Gas Refueling Infrastructure Industry is experiencing significant growth, with specific segments and regions emerging as dominant forces. The Compressed Natural Gas (CNG) segment currently holds the larger market share, largely due to its widespread adoption in passenger vehicles and light-to-medium duty commercial vehicles, as well as its established refueling network. However, the Liquefied Natural Gas (LNG) segment is projected to witness the fastest growth over the forecast period. This surge is attributed to the increasing demand for long-haul trucking solutions and the development of more efficient LNG liquefaction and storage technologies.
Key Growth Drivers for CNG:
- Government Incentives and Regulations: Favorable policies, tax credits, and emissions mandates in various countries are encouraging the adoption of CNG vehicles.
- Cost-Effectiveness: The lower per-unit cost of CNG compared to gasoline and diesel continues to be a major draw for fleet operators.
- Established Infrastructure: A relatively mature refueling network for CNG in many regions facilitates its widespread use.
- Urban Mobility: CNG's suitability for urban delivery fleets and public transportation due to its lower emissions and quieter operation.
Key Growth Drivers for LNG:
- Long-Haul Trucking: LNG offers a higher energy density, leading to longer ranges and reduced refueling frequency for heavy-duty, long-haul trucks.
- Infrastructure Development: Significant investments are being made in building LNG refueling stations along major transportation corridors.
- Environmental Benefits: LNG produces significantly lower greenhouse gas emissions and particulate matter compared to diesel, aligning with stringent environmental regulations.
- Technological Advancements: Improvements in LNG liquefaction, transportation, and on-board storage are making it more accessible and cost-effective.
Geographically, Asia-Pacific is emerging as the dominant region for natural gas refueling infrastructure growth, driven by its large automotive market, government push for cleaner fuels, and significant investments in CNG and LNG infrastructure. China, in particular, is a frontrunner in NGV adoption and refueling station deployment, with an estimated 5,000 Million USD invested in its refueling network in 2024. North America, with its abundant natural gas reserves and supportive policies, also represents a significant market, especially for LNG in the trucking sector. Europe is actively expanding its natural gas refueling infrastructure, driven by climate goals and the need to diversify energy sources.
Natural Gas Refueling Infrastructure Industry Product Analysis
Product innovations in the Natural Gas Refueling Infrastructure Industry are centered around enhancing efficiency, safety, and user experience. Key advancements include smart dispensers with integrated payment systems and data analytics, high-speed compressors that significantly reduce refueling times, and modular refueling station designs for easier deployment and scalability. For LNG, innovations are focused on cryogenic technology for efficient storage and transfer, as well as smaller, more compact liquefaction units. These products offer competitive advantages by lowering operational costs for station owners, providing faster and more convenient refueling for vehicle operators, and ensuring compliance with stringent safety standards. The increasing integration of digital technologies allows for remote monitoring, predictive maintenance, and optimized station operations, further strengthening their market fit.
Key Drivers, Barriers & Challenges in Natural Gas Refueling Infrastructure Industry
The Natural Gas Refueling Infrastructure Industry is propelled by several key drivers. Technological advancements in compressor efficiency and dispenser speed are crucial. Economic factors, such as the price differential between natural gas and conventional fuels, and government policies like subsidies and emissions standards, are vital. For instance, the Clean Air Act in several countries incentivizes the use of cleaner fuels.
However, significant challenges and restraints exist. High upfront capital costs for building refueling stations present a barrier, with an average station costing approximately 2 Million USD. Regulatory complexities and varying standards across regions can slow down deployment. Supply chain issues for specialized components and competition from alternative fuels like electric vehicles are also considerable pressures. The perceived risk and lack of widespread consumer awareness continue to pose hurdles.
Growth Drivers in the Natural Gas Refueling Infrastructure Industry Market
Several critical factors are driving growth in the Natural Gas Refueling Infrastructure Industry. Technological innovation in refueling equipment, leading to faster and more cost-effective operations, is a primary catalyst. Favorable economic conditions, particularly the lower price of natural gas relative to gasoline and diesel, make NGVs more appealing for fleet operators seeking reduced operating expenses. Supportive government policies, including tax incentives, subsidies for NGV adoption, and mandates for cleaner transportation, are instrumental in accelerating infrastructure development. Furthermore, the growing global emphasis on decarbonization and environmental sustainability is pushing industries and governments to adopt cleaner fuel alternatives, with natural gas serving as a viable bridging solution.
Challenges Impacting Natural Gas Refueling Infrastructure Industry Growth
Despite positive growth trajectories, the Natural Gas Refueling Infrastructure Industry faces notable challenges. High initial capital investment required for establishing refueling stations remains a significant barrier, with typical costs ranging from 1 Million to 5 Million USD per station depending on scale and technology. Navigating complex and inconsistent regulatory frameworks across different jurisdictions can lead to delays and increased project costs. Supply chain disruptions for specialized components and equipment can impact project timelines and increase material expenses. Intensifying competition from other alternative fuels, particularly the rapid advancements and increasing availability of electric vehicle charging infrastructure, presents a substantial challenge. Moreover, public perception and awareness gaps regarding the safety, performance, and availability of natural gas refueling can hinder widespread adoption.
Key Players Shaping the Natural Gas Refueling Infrastructure Industry Market
- Greka Engineering and Technology Limited
- Parker Hannifin Corp
- Tulsa Gas Technologies India Pvt Ltd
- Scheidt & Bachmann Gmbh
- Cryostar SAS
- Sanki Industry Group
- Tatsuno Europe AS
- Gilbarco Inc
- Clean Energy Fuels
- FTI International Group Inc
Significant Natural Gas Refueling Infrastructure Industry Industry Milestones
- 2019: Launch of advanced modular CNG refueling station technology, enabling faster deployment in remote areas.
- 2020: Significant increase in government subsidies for LNG truck purchases in North America and Europe, driving infrastructure investment.
- 2021: Major oil and gas companies begin investing in renewable natural gas (RNG) integration into their refueling networks, boosting sustainability.
- 2022: Introduction of ultra-fast LNG refueling systems, reducing station downtime for heavy-duty vehicles.
- 2023: Development of smart refueling management software, optimizing station operations and customer experience.
- 2024: Expansion of cross-border LNG refueling corridors to facilitate international trucking routes.
Future Outlook for Natural Gas Refueling Infrastructure Industry Market
The future outlook for the Natural Gas Refueling Infrastructure Industry is exceptionally promising, driven by an unwavering commitment to sustainable transportation solutions. Strategic opportunities lie in the continued expansion of refueling networks for both CNG and LNG, particularly along major freight corridors and in underserved urban areas. The integration of renewable natural gas (RNG) into existing infrastructure will be a key growth catalyst, offering a truly carbon-neutral fuel option. Investments in smart technologies, including AI-powered station management and enhanced user interfaces, will further improve operational efficiency and customer convenience. The anticipated growth in NGV adoption across various vehicle segments, coupled with supportive regulatory environments and a growing awareness of natural gas as a cleaner alternative, positions the industry for sustained expansion and innovation. The market is projected to reach 40 Billion USD by 2033.
Natural Gas Refueling Infrastructure Industry Segmentation
-
1. Type of Natural Gas
- 1.1. Compressed Natural Gas (CNG)
- 1.2. Liquefied Natural Gas (LNG)
Natural Gas Refueling Infrastructure Industry Segmentation By Geography
- 1. North America
- 2. Europe
- 3. Asia Pacific
- 4. South America
- 5. Middle East and Africa
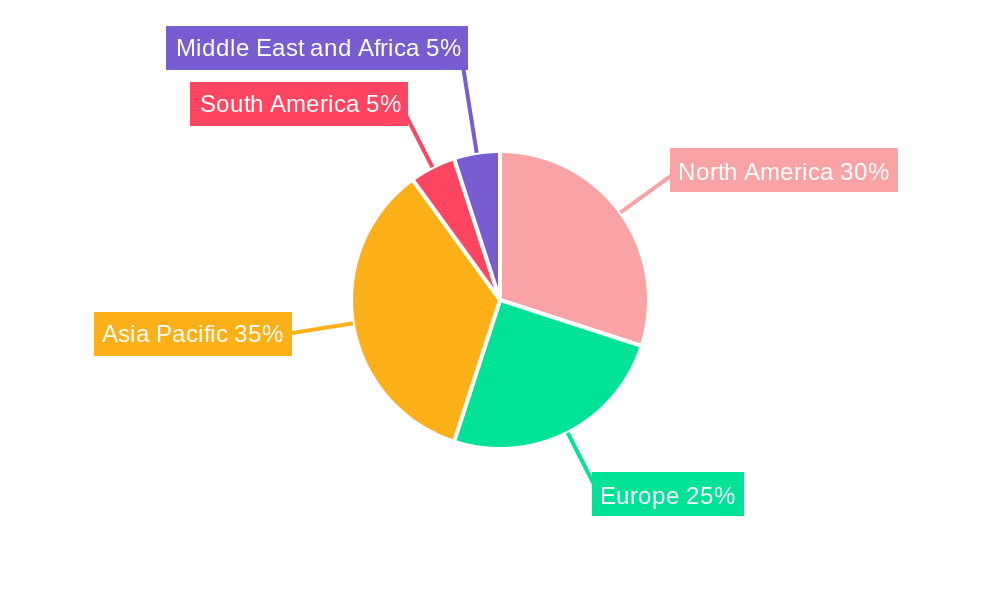
Natural Gas Refueling Infrastructure Industry Regional Market Share
Geographic Coverage of Natural Gas Refueling Infrastructure Industry
Natural Gas Refueling Infrastructure Industry REPORT HIGHLIGHTS
| Aspects | Details |
|---|---|
| Study Period | 2020-2034 |
| Base Year | 2025 |
| Estimated Year | 2026 |
| Forecast Period | 2026-2034 |
| Historical Period | 2020-2025 |
| Growth Rate | CAGR of 5.5% from 2020-2034 |
| Segmentation |
|
Table of Contents
- 1. Introduction
- 1.1. Research Scope
- 1.2. Market Segmentation
- 1.3. Research Methodology
- 1.4. Definitions and Assumptions
- 2. Executive Summary
- 2.1. Introduction
- 3. Market Dynamics
- 3.1. Introduction
- 3.2. Market Drivers
- 3.2.1. 4.; Corporate Sustainability Goals4.; Stringent Regultions and Compliance
- 3.3. Market Restrains
- 3.3.1. 4.; High Complexity in Carbon Accounting
- 3.4. Market Trends
- 3.4.1. Compressed Natural Gas to Dominate the Market
- 4. Market Factor Analysis
- 4.1. Porters Five Forces
- 4.2. Supply/Value Chain
- 4.3. PESTEL analysis
- 4.4. Market Entropy
- 4.5. Patent/Trademark Analysis
- 5. Global Natural Gas Refueling Infrastructure Industry Analysis, Insights and Forecast, 2020-2032
- 5.1. Market Analysis, Insights and Forecast - by Type of Natural Gas
- 5.1.1. Compressed Natural Gas (CNG)
- 5.1.2. Liquefied Natural Gas (LNG)
- 5.2. Market Analysis, Insights and Forecast - by Region
- 5.2.1. North America
- 5.2.2. Europe
- 5.2.3. Asia Pacific
- 5.2.4. South America
- 5.2.5. Middle East and Africa
- 5.1. Market Analysis, Insights and Forecast - by Type of Natural Gas
- 6. North America Natural Gas Refueling Infrastructure Industry Analysis, Insights and Forecast, 2020-2032
- 6.1. Market Analysis, Insights and Forecast - by Type of Natural Gas
- 6.1.1. Compressed Natural Gas (CNG)
- 6.1.2. Liquefied Natural Gas (LNG)
- 6.1. Market Analysis, Insights and Forecast - by Type of Natural Gas
- 7. Europe Natural Gas Refueling Infrastructure Industry Analysis, Insights and Forecast, 2020-2032
- 7.1. Market Analysis, Insights and Forecast - by Type of Natural Gas
- 7.1.1. Compressed Natural Gas (CNG)
- 7.1.2. Liquefied Natural Gas (LNG)
- 7.1. Market Analysis, Insights and Forecast - by Type of Natural Gas
- 8. Asia Pacific Natural Gas Refueling Infrastructure Industry Analysis, Insights and Forecast, 2020-2032
- 8.1. Market Analysis, Insights and Forecast - by Type of Natural Gas
- 8.1.1. Compressed Natural Gas (CNG)
- 8.1.2. Liquefied Natural Gas (LNG)
- 8.1. Market Analysis, Insights and Forecast - by Type of Natural Gas
- 9. South America Natural Gas Refueling Infrastructure Industry Analysis, Insights and Forecast, 2020-2032
- 9.1. Market Analysis, Insights and Forecast - by Type of Natural Gas
- 9.1.1. Compressed Natural Gas (CNG)
- 9.1.2. Liquefied Natural Gas (LNG)
- 9.1. Market Analysis, Insights and Forecast - by Type of Natural Gas
- 10. Middle East and Africa Natural Gas Refueling Infrastructure Industry Analysis, Insights and Forecast, 2020-2032
- 10.1. Market Analysis, Insights and Forecast - by Type of Natural Gas
- 10.1.1. Compressed Natural Gas (CNG)
- 10.1.2. Liquefied Natural Gas (LNG)
- 10.1. Market Analysis, Insights and Forecast - by Type of Natural Gas
- 11. Competitive Analysis
- 11.1. Global Market Share Analysis 2025
- 11.2. Company Profiles
- 11.2.1 Greka Engineering and Technology Limited
- 11.2.1.1. Overview
- 11.2.1.2. Products
- 11.2.1.3. SWOT Analysis
- 11.2.1.4. Recent Developments
- 11.2.1.5. Financials (Based on Availability)
- 11.2.2 Parker Hannifin Corp
- 11.2.2.1. Overview
- 11.2.2.2. Products
- 11.2.2.3. SWOT Analysis
- 11.2.2.4. Recent Developments
- 11.2.2.5. Financials (Based on Availability)
- 11.2.3 Tulsa Gas Technologies India Pvt Ltd
- 11.2.3.1. Overview
- 11.2.3.2. Products
- 11.2.3.3. SWOT Analysis
- 11.2.3.4. Recent Developments
- 11.2.3.5. Financials (Based on Availability)
- 11.2.4 Scheidt & Bachmann Gmbh
- 11.2.4.1. Overview
- 11.2.4.2. Products
- 11.2.4.3. SWOT Analysis
- 11.2.4.4. Recent Developments
- 11.2.4.5. Financials (Based on Availability)
- 11.2.5 Cryostar SAS
- 11.2.5.1. Overview
- 11.2.5.2. Products
- 11.2.5.3. SWOT Analysis
- 11.2.5.4. Recent Developments
- 11.2.5.5. Financials (Based on Availability)
- 11.2.6 Sanki Industry Group
- 11.2.6.1. Overview
- 11.2.6.2. Products
- 11.2.6.3. SWOT Analysis
- 11.2.6.4. Recent Developments
- 11.2.6.5. Financials (Based on Availability)
- 11.2.7 Tatsuno Europe AS
- 11.2.7.1. Overview
- 11.2.7.2. Products
- 11.2.7.3. SWOT Analysis
- 11.2.7.4. Recent Developments
- 11.2.7.5. Financials (Based on Availability)
- 11.2.8 Gilbarco Inc
- 11.2.8.1. Overview
- 11.2.8.2. Products
- 11.2.8.3. SWOT Analysis
- 11.2.8.4. Recent Developments
- 11.2.8.5. Financials (Based on Availability)
- 11.2.9 Clean Energy Fuels
- 11.2.9.1. Overview
- 11.2.9.2. Products
- 11.2.9.3. SWOT Analysis
- 11.2.9.4. Recent Developments
- 11.2.9.5. Financials (Based on Availability)
- 11.2.10 FTI International Group Inc
- 11.2.10.1. Overview
- 11.2.10.2. Products
- 11.2.10.3. SWOT Analysis
- 11.2.10.4. Recent Developments
- 11.2.10.5. Financials (Based on Availability)
- 11.2.1 Greka Engineering and Technology Limited
List of Figures
- Figure 1: Global Natural Gas Refueling Infrastructure Industry Revenue Breakdown (undefined, %) by Region 2025 & 2033
- Figure 2: North America Natural Gas Refueling Infrastructure Industry Revenue (undefined), by Type of Natural Gas 2025 & 2033
- Figure 3: North America Natural Gas Refueling Infrastructure Industry Revenue Share (%), by Type of Natural Gas 2025 & 2033
- Figure 4: North America Natural Gas Refueling Infrastructure Industry Revenue (undefined), by Country 2025 & 2033
- Figure 5: North America Natural Gas Refueling Infrastructure Industry Revenue Share (%), by Country 2025 & 2033
- Figure 6: Europe Natural Gas Refueling Infrastructure Industry Revenue (undefined), by Type of Natural Gas 2025 & 2033
- Figure 7: Europe Natural Gas Refueling Infrastructure Industry Revenue Share (%), by Type of Natural Gas 2025 & 2033
- Figure 8: Europe Natural Gas Refueling Infrastructure Industry Revenue (undefined), by Country 2025 & 2033
- Figure 9: Europe Natural Gas Refueling Infrastructure Industry Revenue Share (%), by Country 2025 & 2033
- Figure 10: Asia Pacific Natural Gas Refueling Infrastructure Industry Revenue (undefined), by Type of Natural Gas 2025 & 2033
- Figure 11: Asia Pacific Natural Gas Refueling Infrastructure Industry Revenue Share (%), by Type of Natural Gas 2025 & 2033
- Figure 12: Asia Pacific Natural Gas Refueling Infrastructure Industry Revenue (undefined), by Country 2025 & 2033
- Figure 13: Asia Pacific Natural Gas Refueling Infrastructure Industry Revenue Share (%), by Country 2025 & 2033
- Figure 14: South America Natural Gas Refueling Infrastructure Industry Revenue (undefined), by Type of Natural Gas 2025 & 2033
- Figure 15: South America Natural Gas Refueling Infrastructure Industry Revenue Share (%), by Type of Natural Gas 2025 & 2033
- Figure 16: South America Natural Gas Refueling Infrastructure Industry Revenue (undefined), by Country 2025 & 2033
- Figure 17: South America Natural Gas Refueling Infrastructure Industry Revenue Share (%), by Country 2025 & 2033
- Figure 18: Middle East and Africa Natural Gas Refueling Infrastructure Industry Revenue (undefined), by Type of Natural Gas 2025 & 2033
- Figure 19: Middle East and Africa Natural Gas Refueling Infrastructure Industry Revenue Share (%), by Type of Natural Gas 2025 & 2033
- Figure 20: Middle East and Africa Natural Gas Refueling Infrastructure Industry Revenue (undefined), by Country 2025 & 2033
- Figure 21: Middle East and Africa Natural Gas Refueling Infrastructure Industry Revenue Share (%), by Country 2025 & 2033
List of Tables
- Table 1: Global Natural Gas Refueling Infrastructure Industry Revenue undefined Forecast, by Type of Natural Gas 2020 & 2033
- Table 2: Global Natural Gas Refueling Infrastructure Industry Revenue undefined Forecast, by Region 2020 & 2033
- Table 3: Global Natural Gas Refueling Infrastructure Industry Revenue undefined Forecast, by Type of Natural Gas 2020 & 2033
- Table 4: Global Natural Gas Refueling Infrastructure Industry Revenue undefined Forecast, by Country 2020 & 2033
- Table 5: Global Natural Gas Refueling Infrastructure Industry Revenue undefined Forecast, by Type of Natural Gas 2020 & 2033
- Table 6: Global Natural Gas Refueling Infrastructure Industry Revenue undefined Forecast, by Country 2020 & 2033
- Table 7: Global Natural Gas Refueling Infrastructure Industry Revenue undefined Forecast, by Type of Natural Gas 2020 & 2033
- Table 8: Global Natural Gas Refueling Infrastructure Industry Revenue undefined Forecast, by Country 2020 & 2033
- Table 9: Global Natural Gas Refueling Infrastructure Industry Revenue undefined Forecast, by Type of Natural Gas 2020 & 2033
- Table 10: Global Natural Gas Refueling Infrastructure Industry Revenue undefined Forecast, by Country 2020 & 2033
- Table 11: Global Natural Gas Refueling Infrastructure Industry Revenue undefined Forecast, by Type of Natural Gas 2020 & 2033
- Table 12: Global Natural Gas Refueling Infrastructure Industry Revenue undefined Forecast, by Country 2020 & 2033
Frequently Asked Questions
1. What is the projected Compound Annual Growth Rate (CAGR) of the Natural Gas Refueling Infrastructure Industry?
The projected CAGR is approximately 5.5%.
2. Which companies are prominent players in the Natural Gas Refueling Infrastructure Industry?
Key companies in the market include Greka Engineering and Technology Limited, Parker Hannifin Corp, Tulsa Gas Technologies India Pvt Ltd, Scheidt & Bachmann Gmbh, Cryostar SAS, Sanki Industry Group, Tatsuno Europe AS, Gilbarco Inc, Clean Energy Fuels, FTI International Group Inc.
3. What are the main segments of the Natural Gas Refueling Infrastructure Industry?
The market segments include Type of Natural Gas.
4. Can you provide details about the market size?
The market size is estimated to be USD XXX N/A as of 2022.
5. What are some drivers contributing to market growth?
4.; Corporate Sustainability Goals4.; Stringent Regultions and Compliance.
6. What are the notable trends driving market growth?
Compressed Natural Gas to Dominate the Market.
7. Are there any restraints impacting market growth?
4.; High Complexity in Carbon Accounting.
8. Can you provide examples of recent developments in the market?
N/A
9. What pricing options are available for accessing the report?
Pricing options include single-user, multi-user, and enterprise licenses priced at USD 4750, USD 5250, and USD 8750 respectively.
10. Is the market size provided in terms of value or volume?
The market size is provided in terms of value, measured in N/A.
11. Are there any specific market keywords associated with the report?
Yes, the market keyword associated with the report is "Natural Gas Refueling Infrastructure Industry," which aids in identifying and referencing the specific market segment covered.
12. How do I determine which pricing option suits my needs best?
The pricing options vary based on user requirements and access needs. Individual users may opt for single-user licenses, while businesses requiring broader access may choose multi-user or enterprise licenses for cost-effective access to the report.
13. Are there any additional resources or data provided in the Natural Gas Refueling Infrastructure Industry report?
While the report offers comprehensive insights, it's advisable to review the specific contents or supplementary materials provided to ascertain if additional resources or data are available.
14. How can I stay updated on further developments or reports in the Natural Gas Refueling Infrastructure Industry?
To stay informed about further developments, trends, and reports in the Natural Gas Refueling Infrastructure Industry, consider subscribing to industry newsletters, following relevant companies and organizations, or regularly checking reputable industry news sources and publications.
Methodology
Step 1 - Identification of Relevant Samples Size from Population Database


Step 2 - Approaches for Defining Global Market Size (Value, Volume* & Price*)

Note*: In applicable scenarios
Step 3 - Data Sources
Primary Research
- Web Analytics
- Survey Reports
- Research Institute
- Latest Research Reports
- Opinion Leaders
Secondary Research
- Annual Reports
- White Paper
- Latest Press Release
- Industry Association
- Paid Database
- Investor Presentations

Step 4 - Data Triangulation
Involves using different sources of information in order to increase the validity of a study
These sources are likely to be stakeholders in a program - participants, other researchers, program staff, other community members, and so on.
Then we put all data in single framework & apply various statistical tools to find out the dynamic on the market.
During the analysis stage, feedback from the stakeholder groups would be compared to determine areas of agreement as well as areas of divergence