
Key Insights
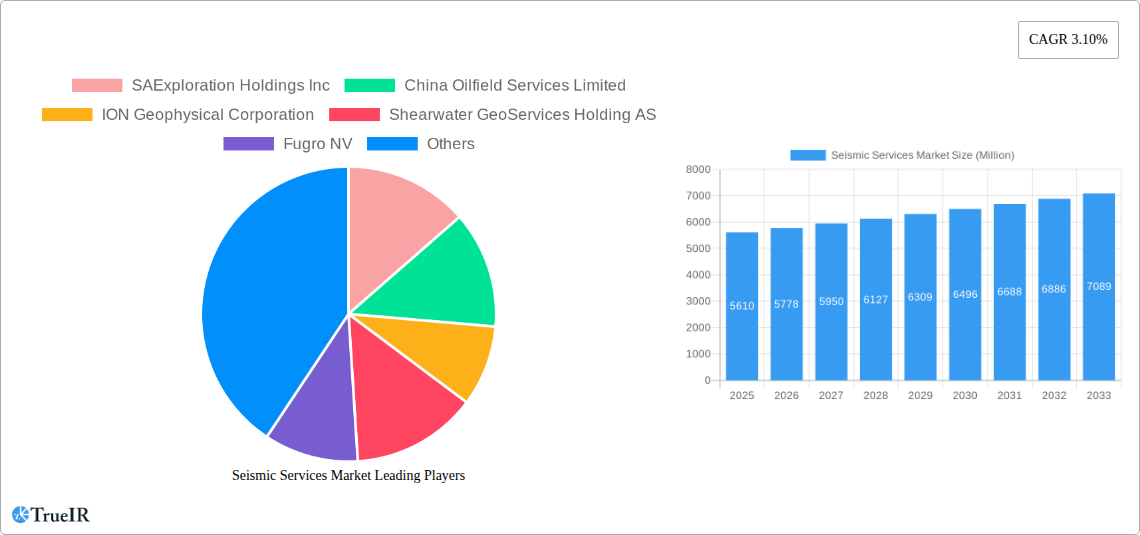
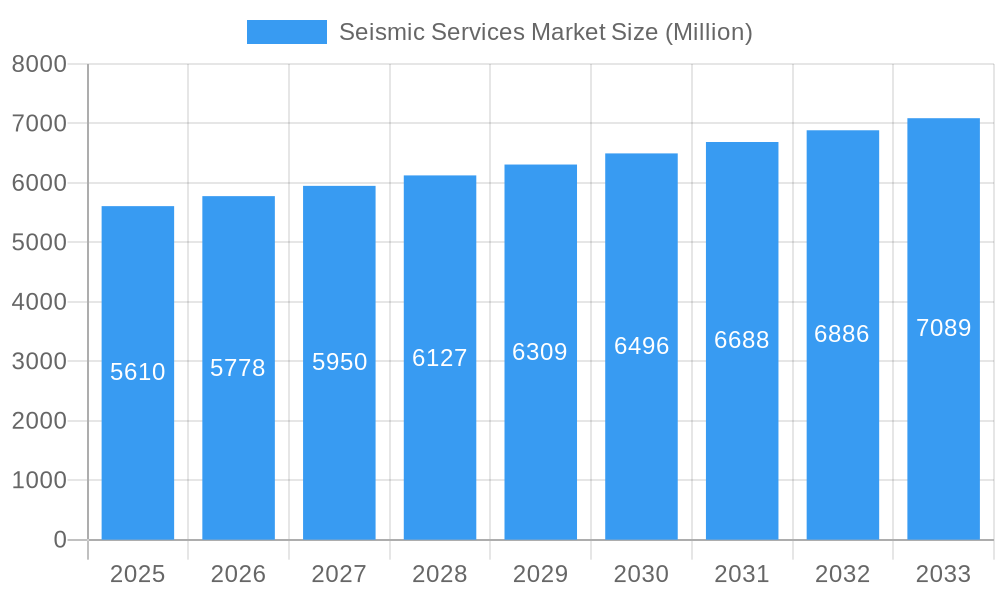
The global Seismic Services market, valued at $5.61 billion in 2025, is projected to experience steady growth, driven by the increasing demand for oil and gas exploration and production. A Compound Annual Growth Rate (CAGR) of 3.10% from 2025 to 2033 indicates a sustained market expansion, fueled by advancements in seismic acquisition technologies, such as 3D and 4D seismic surveys, improving the accuracy and efficiency of subsurface imaging. Growth is further bolstered by the exploration of unconventional hydrocarbon resources, including shale gas and tight oil, which necessitate advanced seismic imaging techniques for optimal resource recovery. The market is segmented by service type (data acquisition, processing, and interpretation) and location of deployment (onshore and offshore). The offshore segment is anticipated to hold a larger market share due to the increasing exploration activities in deepwater regions. However, factors like fluctuating oil prices and stringent environmental regulations pose challenges to the market’s growth trajectory. The leading players, including Schlumberger, Halliburton, CGG, and PGS, are continuously investing in research and development to enhance their service offerings and maintain their competitive edge. The geographic distribution shows strong market presence in North America and Asia Pacific, driven by significant exploration and production activities in these regions. Future growth is anticipated to be influenced by technological advancements, government policies related to energy exploration, and global economic conditions.
Seismic Services Market Market Size (In Billion)
Technological advancements are reshaping the competitive landscape of the seismic services market. The integration of artificial intelligence (AI) and machine learning (ML) in data processing and interpretation is significantly enhancing the accuracy and speed of subsurface imaging. Companies are also focusing on the development of autonomous and remotely operated seismic vessels to reduce operational costs and improve safety. The increasing adoption of cloud computing for data storage and processing is streamlining workflows and improving collaboration among stakeholders. This shift towards digitalization and automation is expected to lead to higher efficiency and reduced processing times, further stimulating market growth. The increasing adoption of sustainable practices in exploration and production is also driving demand for environmentally friendly seismic technologies. Companies are focusing on reducing their carbon footprint through the use of efficient equipment and sustainable energy sources, thus aligning with global sustainability efforts. This trend is expected to influence the design and deployment of seismic services in the future.
Seismic Services Market Company Market Share
Seismic Services Market Report: 2019-2033
This comprehensive report provides an in-depth analysis of the Seismic Services Market, encompassing market size, growth trends, competitive landscape, and future outlook from 2019 to 2033. The study period covers 2019-2024 (historical period), with 2025 as the base and estimated year, and forecasts extending to 2033. This report is crucial for investors, industry professionals, and researchers seeking a thorough understanding of this dynamic market. The market is expected to reach xx Million by 2033, exhibiting a CAGR of xx%.
Seismic Services Market Market Structure & Competitive Landscape
The Seismic Services Market is characterized by a moderately concentrated structure, with a few major players holding significant market share. The Herfindahl-Hirschman Index (HHI) is estimated to be xx, indicating a moderately competitive landscape. Key drivers of innovation include advancements in data acquisition technologies (e.g., multicomponent seismic surveys), improved data processing and interpretation techniques (e.g., machine learning algorithms), and the development of more efficient and cost-effective solutions.
Regulatory impacts, particularly concerning environmental regulations and safety standards, play a significant role in shaping market dynamics. Substitutes for seismic services are limited, although advancements in alternative exploration technologies might pose some level of competition in the long term.
The market is primarily segmented by service type (Data Acquisition, Data Processing and Interpretation) and location of deployment (Onshore, Offshore). End-user segmentation focuses largely on the oil and gas industry, with exploration and production companies representing the largest segment.
Mergers and acquisitions (M&A) activity has been relatively moderate in recent years. The total value of M&A deals in the Seismic Services Market between 2019 and 2024 is estimated at xx Million. These deals often focus on consolidating technological capabilities and expanding geographic reach.
- Market Concentration: Moderately concentrated, HHI estimated at xx.
- Innovation Drivers: Advancements in data acquisition, processing, and interpretation technologies.
- Regulatory Impacts: Environmental regulations and safety standards are key factors.
- Product Substitutes: Limited, with potential long-term competition from alternative technologies.
- End-User Segmentation: Primarily oil and gas exploration and production companies.
- M&A Trends: Moderate activity, focused on technological consolidation and geographic expansion.
Seismic Services Market Market Trends & Opportunities
The Seismic Services Market is experiencing robust growth, driven by rising global energy demand and the need for efficient hydrocarbon exploration. The market size is projected to reach xx Million by 2033. This expansion is further fueled by technological advancements leading to improved data quality, reduced acquisition times, and cost efficiencies. The adoption of advanced technologies like machine learning and artificial intelligence is transforming data processing and interpretation, accelerating exploration efforts and enhancing reservoir characterization. Growing exploration activities in both onshore and offshore regions contribute significantly to market growth. However, fluctuating oil prices and exploration investment cycles can impact short-term market dynamics. The CAGR for the forecast period (2025-2033) is estimated at xx%. Market penetration rates vary depending on the region and technology, with higher penetration observed in mature exploration areas.
The competitive landscape is dynamic, with companies focusing on strategic partnerships, technology upgrades, and geographic expansion to enhance their market position. Industry consolidation through M&A continues, although at a moderate pace.
Dominant Markets & Segments in Seismic Services Market
The offshore segment dominates the Seismic Services Market, accounting for a larger share of overall revenue. This is primarily due to the high concentration of oil and gas exploration activities in offshore regions globally. However, the onshore segment is also experiencing growth, particularly in regions with significant unconventional resource development.
Leading Regions/Countries: The xx region/country currently holds the largest market share, driven by extensive exploration activities and supportive government policies.
Key Growth Drivers:
- Offshore Segment: High concentration of exploration activities, particularly in deepwater environments.
- Onshore Segment: Growth fueled by unconventional resource development and increasing exploration in emerging markets.
- Data Acquisition: Technological improvements leading to higher efficiency and data quality.
- Data Processing and Interpretation: Advancements in software and algorithms improving accuracy and speed.
Seismic Services Market Product Analysis
Seismic service providers offer a range of technologies, including 2D, 3D, and 4D seismic surveys, along with various data processing and interpretation services. Recent innovations include the use of multicomponent sensors and advanced imaging techniques to obtain higher resolution data. These advancements improve subsurface imaging, reservoir characterization, and ultimately optimize hydrocarbon exploration and production. The competitive advantage lies in providing high-quality data, efficient processing, advanced interpretation capabilities, and timely delivery of results.
Key Drivers, Barriers & Challenges in Seismic Services Market
Key Drivers:
Rising global energy demand, exploration in frontier regions (e.g., deepwater, arctic), and technological advancements (e.g., multicomponent seismic, AI-powered interpretation) are propelling the market's growth.
Challenges and Restraints:
Fluctuations in oil prices, environmental regulations, and the increasing complexity of exploration projects pose significant challenges. Supply chain issues and skilled labor shortages can also impact market growth. Furthermore, intense competition among established players and the emergence of new entrants further restrict growth margins. The combined impact of these factors can lead to budget constraints and delays in project implementation, affecting overall market expansion.
Growth Drivers in the Seismic Services Market Market
Technological advancements, particularly in data acquisition and interpretation, remain a major growth driver. The increasing demand for energy, coupled with exploration in challenging environments, fuels demand for sophisticated seismic services. Government policies supporting exploration and production activities also positively impact market growth.
Challenges Impacting Seismic Services Market Growth
Regulatory complexities surrounding environmental impact assessments and permitting processes create significant barriers. The volatile nature of oil and gas prices directly affects investment decisions, while competitive pressures and supply chain disruptions add further challenges.
Key Players Shaping the Seismic Services Market Market
- SAExploration Holdings Inc
- China Oilfield Services Limited
- ION Geophysical Corporation
- Shearwater GeoServices Holding AS
- Fugro NV
- Schlumberger NV
- CGG SA
- Briscoe Group Limited
- Halliburton Company
- SeaBird Exploration PLC
- Magseis Fairfield ASA (WGP Group Ltd)
- TGS ASA
- Polarcus Ltd
- PGS ASA
Significant Seismic Services Market Industry Milestones
- May 2023: TGS, PGS, and Schlumberger secured pre-funding for a 6,885 sq km multi-client 3D seismic survey offshore Malaysia. This signifies increased investment in exploration and highlights collaboration among major players.
- February 2022: ADNOC's discovery of 1.5-2 trillion cubic feet of gas offshore the UAE boosts exploration activity in the region, creating new opportunities for seismic service providers.
- January 2022: Shearwater GeoServices secured contracts for two multicomponent surveys in offshore Western Australia, showcasing growing demand for advanced seismic technologies.
Future Outlook for Seismic Services Market Market
The Seismic Services Market is poised for continued growth, driven by sustained energy demand and the ongoing need for efficient hydrocarbon exploration. Strategic partnerships, technological innovations, and expansion into new markets will be crucial for success. The market holds significant potential for companies that can adapt to evolving technological landscapes and effectively navigate regulatory complexities.
Seismic Services Market Segmentation
-
1. Service
- 1.1. Data Acquisition
- 1.2. Data Processing and Interpretation
-
2. Location of Deployment
- 2.1. Onshore
- 2.2. Offshore
Seismic Services Market Segmentation By Geography
-
1. North America
- 1.1. United States of America
- 1.2. Canada
- 1.3. Rest of North America
-
2. Asia Pacific
- 2.1. China
- 2.2. India
- 2.3. Australia
- 2.4. Rest of Asia Pacific
-
3. Europe
- 3.1. Germany
- 3.2. Russia
- 3.3. United Kingdom
- 3.4. France
- 3.5. Rest of Europe
-
4. South America
- 4.1. Brazil
- 4.2. Argentina
- 4.3. Rest of the South America
-
5. Middle East and Africa
- 5.1. United Arab Emirates
- 5.2. Saudi Arabia
- 5.3. Iran
- 5.4. Iraq
- 5.5. Rest of the Middle East and Africa
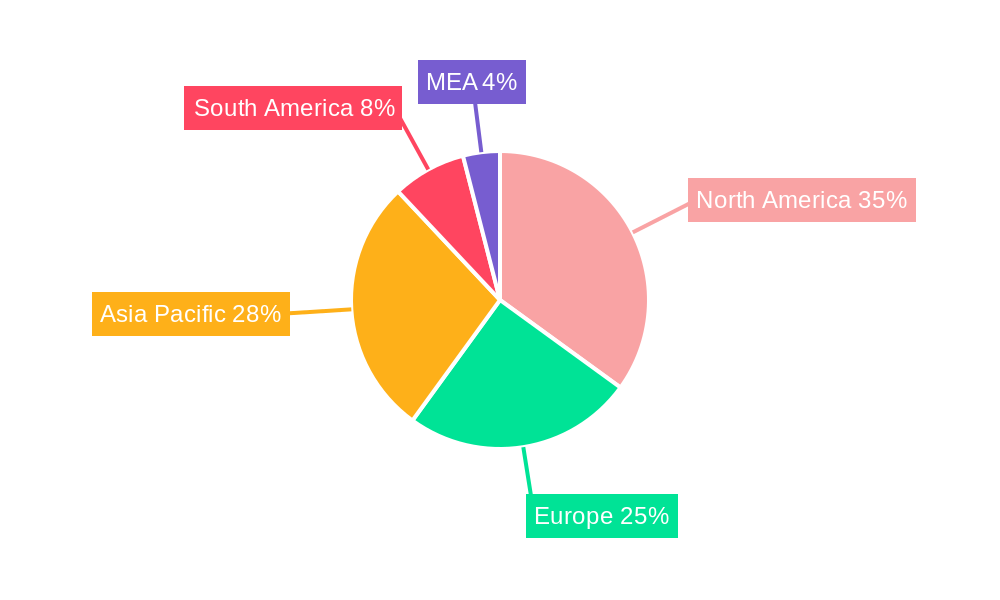
Seismic Services Market Regional Market Share
Geographic Coverage of Seismic Services Market
Seismic Services Market REPORT HIGHLIGHTS
| Aspects | Details |
|---|---|
| Study Period | 2020-2034 |
| Base Year | 2025 |
| Estimated Year | 2026 |
| Forecast Period | 2026-2034 |
| Historical Period | 2020-2025 |
| Growth Rate | CAGR of 3.10% from 2020-2034 |
| Segmentation |
|
Table of Contents
- 1. Introduction
- 1.1. Research Scope
- 1.2. Market Segmentation
- 1.3. Research Methodology
- 1.4. Definitions and Assumptions
- 2. Executive Summary
- 2.1. Introduction
- 3. Market Dynamics
- 3.1. Introduction
- 3.2. Market Drivers
- 3.2.1 4.; Increasing Exploration in Offshore Areas4.; The Strengthening of Crude Oil Prices
- 3.2.2 Making the Upstream Activities Economically Feasible
- 3.3. Market Restrains
- 3.3.1. 4.; Shifting to Renewable Energy Sources
- 3.4. Market Trends
- 3.4.1. Increasing Demand from the Offshore Oil and Gas Industry
- 4. Market Factor Analysis
- 4.1. Porters Five Forces
- 4.2. Supply/Value Chain
- 4.3. PESTEL analysis
- 4.4. Market Entropy
- 4.5. Patent/Trademark Analysis
- 5. Global Seismic Services Market Analysis, Insights and Forecast, 2020-2032
- 5.1. Market Analysis, Insights and Forecast - by Service
- 5.1.1. Data Acquisition
- 5.1.2. Data Processing and Interpretation
- 5.2. Market Analysis, Insights and Forecast - by Location of Deployment
- 5.2.1. Onshore
- 5.2.2. Offshore
- 5.3. Market Analysis, Insights and Forecast - by Region
- 5.3.1. North America
- 5.3.2. Asia Pacific
- 5.3.3. Europe
- 5.3.4. South America
- 5.3.5. Middle East and Africa
- 5.1. Market Analysis, Insights and Forecast - by Service
- 6. North America Seismic Services Market Analysis, Insights and Forecast, 2020-2032
- 6.1. Market Analysis, Insights and Forecast - by Service
- 6.1.1. Data Acquisition
- 6.1.2. Data Processing and Interpretation
- 6.2. Market Analysis, Insights and Forecast - by Location of Deployment
- 6.2.1. Onshore
- 6.2.2. Offshore
- 6.1. Market Analysis, Insights and Forecast - by Service
- 7. Asia Pacific Seismic Services Market Analysis, Insights and Forecast, 2020-2032
- 7.1. Market Analysis, Insights and Forecast - by Service
- 7.1.1. Data Acquisition
- 7.1.2. Data Processing and Interpretation
- 7.2. Market Analysis, Insights and Forecast - by Location of Deployment
- 7.2.1. Onshore
- 7.2.2. Offshore
- 7.1. Market Analysis, Insights and Forecast - by Service
- 8. Europe Seismic Services Market Analysis, Insights and Forecast, 2020-2032
- 8.1. Market Analysis, Insights and Forecast - by Service
- 8.1.1. Data Acquisition
- 8.1.2. Data Processing and Interpretation
- 8.2. Market Analysis, Insights and Forecast - by Location of Deployment
- 8.2.1. Onshore
- 8.2.2. Offshore
- 8.1. Market Analysis, Insights and Forecast - by Service
- 9. South America Seismic Services Market Analysis, Insights and Forecast, 2020-2032
- 9.1. Market Analysis, Insights and Forecast - by Service
- 9.1.1. Data Acquisition
- 9.1.2. Data Processing and Interpretation
- 9.2. Market Analysis, Insights and Forecast - by Location of Deployment
- 9.2.1. Onshore
- 9.2.2. Offshore
- 9.1. Market Analysis, Insights and Forecast - by Service
- 10. Middle East and Africa Seismic Services Market Analysis, Insights and Forecast, 2020-2032
- 10.1. Market Analysis, Insights and Forecast - by Service
- 10.1.1. Data Acquisition
- 10.1.2. Data Processing and Interpretation
- 10.2. Market Analysis, Insights and Forecast - by Location of Deployment
- 10.2.1. Onshore
- 10.2.2. Offshore
- 10.1. Market Analysis, Insights and Forecast - by Service
- 11. North America Seismic Services Market Analysis, Insights and Forecast, 2020-2032
- 11.1. Market Analysis, Insights and Forecast - By Country/Sub-region
- 11.1.1 United States
- 11.1.2 Canada
- 11.1.3 Mexico
- 12. Europe Seismic Services Market Analysis, Insights and Forecast, 2020-2032
- 12.1. Market Analysis, Insights and Forecast - By Country/Sub-region
- 12.1.1 Germany
- 12.1.2 United Kingdom
- 12.1.3 France
- 12.1.4 Spain
- 12.1.5 Italy
- 12.1.6 Spain
- 12.1.7 Belgium
- 12.1.8 Netherland
- 12.1.9 Nordics
- 12.1.10 Rest of Europe
- 13. Asia Pacific Seismic Services Market Analysis, Insights and Forecast, 2020-2032
- 13.1. Market Analysis, Insights and Forecast - By Country/Sub-region
- 13.1.1 China
- 13.1.2 Japan
- 13.1.3 India
- 13.1.4 South Korea
- 13.1.5 Southeast Asia
- 13.1.6 Australia
- 13.1.7 Indonesia
- 13.1.8 Phillipes
- 13.1.9 Singapore
- 13.1.10 Thailandc
- 13.1.11 Rest of Asia Pacific
- 14. South America Seismic Services Market Analysis, Insights and Forecast, 2020-2032
- 14.1. Market Analysis, Insights and Forecast - By Country/Sub-region
- 14.1.1 Brazil
- 14.1.2 Argentina
- 14.1.3 Peru
- 14.1.4 Chile
- 14.1.5 Colombia
- 14.1.6 Ecuador
- 14.1.7 Venezuela
- 14.1.8 Rest of South America
- 15. MEA Seismic Services Market Analysis, Insights and Forecast, 2020-2032
- 15.1. Market Analysis, Insights and Forecast - By Country/Sub-region
- 15.1.1 United Arab Emirates
- 15.1.2 Saudi Arabia
- 15.1.3 South Africa
- 15.1.4 Rest of Middle East and Africa
- 16. Competitive Analysis
- 16.1. Global Market Share Analysis 2025
- 16.2. Company Profiles
- 16.2.1 SAExploration Holdings Inc
- 16.2.1.1. Overview
- 16.2.1.2. Products
- 16.2.1.3. SWOT Analysis
- 16.2.1.4. Recent Developments
- 16.2.1.5. Financials (Based on Availability)
- 16.2.2 China Oilfield Services Limited
- 16.2.2.1. Overview
- 16.2.2.2. Products
- 16.2.2.3. SWOT Analysis
- 16.2.2.4. Recent Developments
- 16.2.2.5. Financials (Based on Availability)
- 16.2.3 ION Geophysical Corporation
- 16.2.3.1. Overview
- 16.2.3.2. Products
- 16.2.3.3. SWOT Analysis
- 16.2.3.4. Recent Developments
- 16.2.3.5. Financials (Based on Availability)
- 16.2.4 Shearwater GeoServices Holding AS
- 16.2.4.1. Overview
- 16.2.4.2. Products
- 16.2.4.3. SWOT Analysis
- 16.2.4.4. Recent Developments
- 16.2.4.5. Financials (Based on Availability)
- 16.2.5 Fugro NV
- 16.2.5.1. Overview
- 16.2.5.2. Products
- 16.2.5.3. SWOT Analysis
- 16.2.5.4. Recent Developments
- 16.2.5.5. Financials (Based on Availability)
- 16.2.6 Schlumberger NV
- 16.2.6.1. Overview
- 16.2.6.2. Products
- 16.2.6.3. SWOT Analysis
- 16.2.6.4. Recent Developments
- 16.2.6.5. Financials (Based on Availability)
- 16.2.7 CGG SA
- 16.2.7.1. Overview
- 16.2.7.2. Products
- 16.2.7.3. SWOT Analysis
- 16.2.7.4. Recent Developments
- 16.2.7.5. Financials (Based on Availability)
- 16.2.8 Briscoe Group Limited
- 16.2.8.1. Overview
- 16.2.8.2. Products
- 16.2.8.3. SWOT Analysis
- 16.2.8.4. Recent Developments
- 16.2.8.5. Financials (Based on Availability)
- 16.2.9 Halliburton Company
- 16.2.9.1. Overview
- 16.2.9.2. Products
- 16.2.9.3. SWOT Analysis
- 16.2.9.4. Recent Developments
- 16.2.9.5. Financials (Based on Availability)
- 16.2.10 SeaBird Exploration PLC
- 16.2.10.1. Overview
- 16.2.10.2. Products
- 16.2.10.3. SWOT Analysis
- 16.2.10.4. Recent Developments
- 16.2.10.5. Financials (Based on Availability)
- 16.2.11 Magseis Fairfield ASA (WGP Group Ltd)
- 16.2.11.1. Overview
- 16.2.11.2. Products
- 16.2.11.3. SWOT Analysis
- 16.2.11.4. Recent Developments
- 16.2.11.5. Financials (Based on Availability)
- 16.2.12 TGS ASA
- 16.2.12.1. Overview
- 16.2.12.2. Products
- 16.2.12.3. SWOT Analysis
- 16.2.12.4. Recent Developments
- 16.2.12.5. Financials (Based on Availability)
- 16.2.13 Polarcus Ltd
- 16.2.13.1. Overview
- 16.2.13.2. Products
- 16.2.13.3. SWOT Analysis
- 16.2.13.4. Recent Developments
- 16.2.13.5. Financials (Based on Availability)
- 16.2.14 PGS ASA
- 16.2.14.1. Overview
- 16.2.14.2. Products
- 16.2.14.3. SWOT Analysis
- 16.2.14.4. Recent Developments
- 16.2.14.5. Financials (Based on Availability)
- 16.2.1 SAExploration Holdings Inc
List of Figures
- Figure 1: Global Seismic Services Market Revenue Breakdown (Million, %) by Region 2025 & 2033
- Figure 2: North America Seismic Services Market Revenue (Million), by Country 2025 & 2033
- Figure 3: North America Seismic Services Market Revenue Share (%), by Country 2025 & 2033
- Figure 4: Europe Seismic Services Market Revenue (Million), by Country 2025 & 2033
- Figure 5: Europe Seismic Services Market Revenue Share (%), by Country 2025 & 2033
- Figure 6: Asia Pacific Seismic Services Market Revenue (Million), by Country 2025 & 2033
- Figure 7: Asia Pacific Seismic Services Market Revenue Share (%), by Country 2025 & 2033
- Figure 8: South America Seismic Services Market Revenue (Million), by Country 2025 & 2033
- Figure 9: South America Seismic Services Market Revenue Share (%), by Country 2025 & 2033
- Figure 10: MEA Seismic Services Market Revenue (Million), by Country 2025 & 2033
- Figure 11: MEA Seismic Services Market Revenue Share (%), by Country 2025 & 2033
- Figure 12: North America Seismic Services Market Revenue (Million), by Service 2025 & 2033
- Figure 13: North America Seismic Services Market Revenue Share (%), by Service 2025 & 2033
- Figure 14: North America Seismic Services Market Revenue (Million), by Location of Deployment 2025 & 2033
- Figure 15: North America Seismic Services Market Revenue Share (%), by Location of Deployment 2025 & 2033
- Figure 16: North America Seismic Services Market Revenue (Million), by Country 2025 & 2033
- Figure 17: North America Seismic Services Market Revenue Share (%), by Country 2025 & 2033
- Figure 18: Asia Pacific Seismic Services Market Revenue (Million), by Service 2025 & 2033
- Figure 19: Asia Pacific Seismic Services Market Revenue Share (%), by Service 2025 & 2033
- Figure 20: Asia Pacific Seismic Services Market Revenue (Million), by Location of Deployment 2025 & 2033
- Figure 21: Asia Pacific Seismic Services Market Revenue Share (%), by Location of Deployment 2025 & 2033
- Figure 22: Asia Pacific Seismic Services Market Revenue (Million), by Country 2025 & 2033
- Figure 23: Asia Pacific Seismic Services Market Revenue Share (%), by Country 2025 & 2033
- Figure 24: Europe Seismic Services Market Revenue (Million), by Service 2025 & 2033
- Figure 25: Europe Seismic Services Market Revenue Share (%), by Service 2025 & 2033
- Figure 26: Europe Seismic Services Market Revenue (Million), by Location of Deployment 2025 & 2033
- Figure 27: Europe Seismic Services Market Revenue Share (%), by Location of Deployment 2025 & 2033
- Figure 28: Europe Seismic Services Market Revenue (Million), by Country 2025 & 2033
- Figure 29: Europe Seismic Services Market Revenue Share (%), by Country 2025 & 2033
- Figure 30: South America Seismic Services Market Revenue (Million), by Service 2025 & 2033
- Figure 31: South America Seismic Services Market Revenue Share (%), by Service 2025 & 2033
- Figure 32: South America Seismic Services Market Revenue (Million), by Location of Deployment 2025 & 2033
- Figure 33: South America Seismic Services Market Revenue Share (%), by Location of Deployment 2025 & 2033
- Figure 34: South America Seismic Services Market Revenue (Million), by Country 2025 & 2033
- Figure 35: South America Seismic Services Market Revenue Share (%), by Country 2025 & 2033
- Figure 36: Middle East and Africa Seismic Services Market Revenue (Million), by Service 2025 & 2033
- Figure 37: Middle East and Africa Seismic Services Market Revenue Share (%), by Service 2025 & 2033
- Figure 38: Middle East and Africa Seismic Services Market Revenue (Million), by Location of Deployment 2025 & 2033
- Figure 39: Middle East and Africa Seismic Services Market Revenue Share (%), by Location of Deployment 2025 & 2033
- Figure 40: Middle East and Africa Seismic Services Market Revenue (Million), by Country 2025 & 2033
- Figure 41: Middle East and Africa Seismic Services Market Revenue Share (%), by Country 2025 & 2033
List of Tables
- Table 1: Global Seismic Services Market Revenue Million Forecast, by Region 2020 & 2033
- Table 2: Global Seismic Services Market Revenue Million Forecast, by Service 2020 & 2033
- Table 3: Global Seismic Services Market Revenue Million Forecast, by Location of Deployment 2020 & 2033
- Table 4: Global Seismic Services Market Revenue Million Forecast, by Region 2020 & 2033
- Table 5: Global Seismic Services Market Revenue Million Forecast, by Country 2020 & 2033
- Table 6: United States Seismic Services Market Revenue (Million) Forecast, by Application 2020 & 2033
- Table 7: Canada Seismic Services Market Revenue (Million) Forecast, by Application 2020 & 2033
- Table 8: Mexico Seismic Services Market Revenue (Million) Forecast, by Application 2020 & 2033
- Table 9: Global Seismic Services Market Revenue Million Forecast, by Country 2020 & 2033
- Table 10: Germany Seismic Services Market Revenue (Million) Forecast, by Application 2020 & 2033
- Table 11: United Kingdom Seismic Services Market Revenue (Million) Forecast, by Application 2020 & 2033
- Table 12: France Seismic Services Market Revenue (Million) Forecast, by Application 2020 & 2033
- Table 13: Spain Seismic Services Market Revenue (Million) Forecast, by Application 2020 & 2033
- Table 14: Italy Seismic Services Market Revenue (Million) Forecast, by Application 2020 & 2033
- Table 15: Spain Seismic Services Market Revenue (Million) Forecast, by Application 2020 & 2033
- Table 16: Belgium Seismic Services Market Revenue (Million) Forecast, by Application 2020 & 2033
- Table 17: Netherland Seismic Services Market Revenue (Million) Forecast, by Application 2020 & 2033
- Table 18: Nordics Seismic Services Market Revenue (Million) Forecast, by Application 2020 & 2033
- Table 19: Rest of Europe Seismic Services Market Revenue (Million) Forecast, by Application 2020 & 2033
- Table 20: Global Seismic Services Market Revenue Million Forecast, by Country 2020 & 2033
- Table 21: China Seismic Services Market Revenue (Million) Forecast, by Application 2020 & 2033
- Table 22: Japan Seismic Services Market Revenue (Million) Forecast, by Application 2020 & 2033
- Table 23: India Seismic Services Market Revenue (Million) Forecast, by Application 2020 & 2033
- Table 24: South Korea Seismic Services Market Revenue (Million) Forecast, by Application 2020 & 2033
- Table 25: Southeast Asia Seismic Services Market Revenue (Million) Forecast, by Application 2020 & 2033
- Table 26: Australia Seismic Services Market Revenue (Million) Forecast, by Application 2020 & 2033
- Table 27: Indonesia Seismic Services Market Revenue (Million) Forecast, by Application 2020 & 2033
- Table 28: Phillipes Seismic Services Market Revenue (Million) Forecast, by Application 2020 & 2033
- Table 29: Singapore Seismic Services Market Revenue (Million) Forecast, by Application 2020 & 2033
- Table 30: Thailandc Seismic Services Market Revenue (Million) Forecast, by Application 2020 & 2033
- Table 31: Rest of Asia Pacific Seismic Services Market Revenue (Million) Forecast, by Application 2020 & 2033
- Table 32: Global Seismic Services Market Revenue Million Forecast, by Country 2020 & 2033
- Table 33: Brazil Seismic Services Market Revenue (Million) Forecast, by Application 2020 & 2033
- Table 34: Argentina Seismic Services Market Revenue (Million) Forecast, by Application 2020 & 2033
- Table 35: Peru Seismic Services Market Revenue (Million) Forecast, by Application 2020 & 2033
- Table 36: Chile Seismic Services Market Revenue (Million) Forecast, by Application 2020 & 2033
- Table 37: Colombia Seismic Services Market Revenue (Million) Forecast, by Application 2020 & 2033
- Table 38: Ecuador Seismic Services Market Revenue (Million) Forecast, by Application 2020 & 2033
- Table 39: Venezuela Seismic Services Market Revenue (Million) Forecast, by Application 2020 & 2033
- Table 40: Rest of South America Seismic Services Market Revenue (Million) Forecast, by Application 2020 & 2033
- Table 41: Global Seismic Services Market Revenue Million Forecast, by Country 2020 & 2033
- Table 42: United Arab Emirates Seismic Services Market Revenue (Million) Forecast, by Application 2020 & 2033
- Table 43: Saudi Arabia Seismic Services Market Revenue (Million) Forecast, by Application 2020 & 2033
- Table 44: South Africa Seismic Services Market Revenue (Million) Forecast, by Application 2020 & 2033
- Table 45: Rest of Middle East and Africa Seismic Services Market Revenue (Million) Forecast, by Application 2020 & 2033
- Table 46: Global Seismic Services Market Revenue Million Forecast, by Service 2020 & 2033
- Table 47: Global Seismic Services Market Revenue Million Forecast, by Location of Deployment 2020 & 2033
- Table 48: Global Seismic Services Market Revenue Million Forecast, by Country 2020 & 2033
- Table 49: United States of America Seismic Services Market Revenue (Million) Forecast, by Application 2020 & 2033
- Table 50: Canada Seismic Services Market Revenue (Million) Forecast, by Application 2020 & 2033
- Table 51: Rest of North America Seismic Services Market Revenue (Million) Forecast, by Application 2020 & 2033
- Table 52: Global Seismic Services Market Revenue Million Forecast, by Service 2020 & 2033
- Table 53: Global Seismic Services Market Revenue Million Forecast, by Location of Deployment 2020 & 2033
- Table 54: Global Seismic Services Market Revenue Million Forecast, by Country 2020 & 2033
- Table 55: China Seismic Services Market Revenue (Million) Forecast, by Application 2020 & 2033
- Table 56: India Seismic Services Market Revenue (Million) Forecast, by Application 2020 & 2033
- Table 57: Australia Seismic Services Market Revenue (Million) Forecast, by Application 2020 & 2033
- Table 58: Rest of Asia Pacific Seismic Services Market Revenue (Million) Forecast, by Application 2020 & 2033
- Table 59: Global Seismic Services Market Revenue Million Forecast, by Service 2020 & 2033
- Table 60: Global Seismic Services Market Revenue Million Forecast, by Location of Deployment 2020 & 2033
- Table 61: Global Seismic Services Market Revenue Million Forecast, by Country 2020 & 2033
- Table 62: Germany Seismic Services Market Revenue (Million) Forecast, by Application 2020 & 2033
- Table 63: Russia Seismic Services Market Revenue (Million) Forecast, by Application 2020 & 2033
- Table 64: United Kingdom Seismic Services Market Revenue (Million) Forecast, by Application 2020 & 2033
- Table 65: France Seismic Services Market Revenue (Million) Forecast, by Application 2020 & 2033
- Table 66: Rest of Europe Seismic Services Market Revenue (Million) Forecast, by Application 2020 & 2033
- Table 67: Global Seismic Services Market Revenue Million Forecast, by Service 2020 & 2033
- Table 68: Global Seismic Services Market Revenue Million Forecast, by Location of Deployment 2020 & 2033
- Table 69: Global Seismic Services Market Revenue Million Forecast, by Country 2020 & 2033
- Table 70: Brazil Seismic Services Market Revenue (Million) Forecast, by Application 2020 & 2033
- Table 71: Argentina Seismic Services Market Revenue (Million) Forecast, by Application 2020 & 2033
- Table 72: Rest of the South America Seismic Services Market Revenue (Million) Forecast, by Application 2020 & 2033
- Table 73: Global Seismic Services Market Revenue Million Forecast, by Service 2020 & 2033
- Table 74: Global Seismic Services Market Revenue Million Forecast, by Location of Deployment 2020 & 2033
- Table 75: Global Seismic Services Market Revenue Million Forecast, by Country 2020 & 2033
- Table 76: United Arab Emirates Seismic Services Market Revenue (Million) Forecast, by Application 2020 & 2033
- Table 77: Saudi Arabia Seismic Services Market Revenue (Million) Forecast, by Application 2020 & 2033
- Table 78: Iran Seismic Services Market Revenue (Million) Forecast, by Application 2020 & 2033
- Table 79: Iraq Seismic Services Market Revenue (Million) Forecast, by Application 2020 & 2033
- Table 80: Rest of the Middle East and Africa Seismic Services Market Revenue (Million) Forecast, by Application 2020 & 2033
Frequently Asked Questions
1. What is the projected Compound Annual Growth Rate (CAGR) of the Seismic Services Market?
The projected CAGR is approximately 3.10%.
2. Which companies are prominent players in the Seismic Services Market?
Key companies in the market include SAExploration Holdings Inc, China Oilfield Services Limited, ION Geophysical Corporation, Shearwater GeoServices Holding AS, Fugro NV, Schlumberger NV, CGG SA, Briscoe Group Limited, Halliburton Company, SeaBird Exploration PLC, Magseis Fairfield ASA (WGP Group Ltd), TGS ASA, Polarcus Ltd, PGS ASA.
3. What are the main segments of the Seismic Services Market?
The market segments include Service, Location of Deployment.
4. Can you provide details about the market size?
The market size is estimated to be USD 5.61 Million as of 2022.
5. What are some drivers contributing to market growth?
4.; Increasing Exploration in Offshore Areas4.; The Strengthening of Crude Oil Prices. Making the Upstream Activities Economically Feasible.
6. What are the notable trends driving market growth?
Increasing Demand from the Offshore Oil and Gas Industry.
7. Are there any restraints impacting market growth?
4.; Shifting to Renewable Energy Sources.
8. Can you provide examples of recent developments in the market?
In May 2023, TGS, in partnership with PGS and Schlumberger, has secured pre-funding for a 6,885 square kilometer (2,658 square miles) multi-client 3D seismic survey offshore Malaysia in the North Luconia Province of the Sarawak Basin.
9. What pricing options are available for accessing the report?
Pricing options include single-user, multi-user, and enterprise licenses priced at USD 4750, USD 5250, and USD 8750 respectively.
10. Is the market size provided in terms of value or volume?
The market size is provided in terms of value, measured in Million.
11. Are there any specific market keywords associated with the report?
Yes, the market keyword associated with the report is "Seismic Services Market," which aids in identifying and referencing the specific market segment covered.
12. How do I determine which pricing option suits my needs best?
The pricing options vary based on user requirements and access needs. Individual users may opt for single-user licenses, while businesses requiring broader access may choose multi-user or enterprise licenses for cost-effective access to the report.
13. Are there any additional resources or data provided in the Seismic Services Market report?
While the report offers comprehensive insights, it's advisable to review the specific contents or supplementary materials provided to ascertain if additional resources or data are available.
14. How can I stay updated on further developments or reports in the Seismic Services Market?
To stay informed about further developments, trends, and reports in the Seismic Services Market, consider subscribing to industry newsletters, following relevant companies and organizations, or regularly checking reputable industry news sources and publications.
Methodology
Step 1 - Identification of Relevant Samples Size from Population Database


Step 2 - Approaches for Defining Global Market Size (Value, Volume* & Price*)

Note*: In applicable scenarios
Step 3 - Data Sources
Primary Research
- Web Analytics
- Survey Reports
- Research Institute
- Latest Research Reports
- Opinion Leaders
Secondary Research
- Annual Reports
- White Paper
- Latest Press Release
- Industry Association
- Paid Database
- Investor Presentations

Step 4 - Data Triangulation
Involves using different sources of information in order to increase the validity of a study
These sources are likely to be stakeholders in a program - participants, other researchers, program staff, other community members, and so on.
Then we put all data in single framework & apply various statistical tools to find out the dynamic on the market.
During the analysis stage, feedback from the stakeholder groups would be compared to determine areas of agreement as well as areas of divergence
