

Key Insights
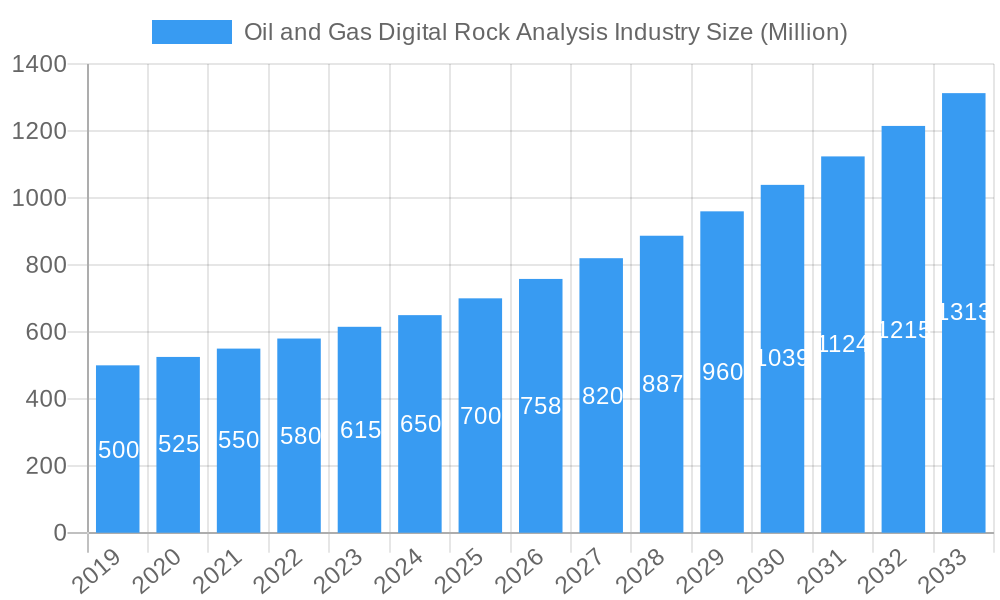
The global Oil and Gas Digital Rock Analysis market is projected to experience robust expansion, reaching a market size of $1.24 billion by 2025. This growth is driven by the escalating demand for enhanced oil recovery (EOR) techniques and the imperative for optimized reservoir management in mature oil fields. Digital rock analysis, employing advanced imaging and computational methods, delivers critical insights into pore-scale properties, fluid flow dynamics, and rock-fluid interactions. This technology enables operators to make data-driven decisions for exploration, production, and field development, enhancing efficiency and reducing operational costs. The integration of artificial intelligence and machine learning algorithms is further refining the extraction of actionable intelligence from complex geological data, boosting precision and predictive capabilities.
Oil and Gas Digital Rock Analysis Industry Market Size (In Billion)
The market encompasses both conventional and unconventional resource segments, with unconventional resources like shale oil and gas increasingly dependent on sophisticated digital rock analysis for economic feasibility. Leading companies such as Schlumberger Limited, Halliburton Company, and Thermo Fisher Scientific Inc. are investing in R&D to advance their digital rock analysis platforms and services. Geographically, North America, led by the significant shale operations in the United States and Canada, is expected to retain a dominant market share. However, the Asia Pacific region, fueled by growing energy demands and expanding exploration activities in China and India, presents substantial growth opportunities. While high initial technology investment and the need for specialized expertise pose challenges, the adoption of cloud-based solutions and collaborative research initiatives are mitigating these restraints, reinforcing the market's upward trajectory. The Compound Annual Growth Rate (CAGR) for the period is estimated at 7.68%.
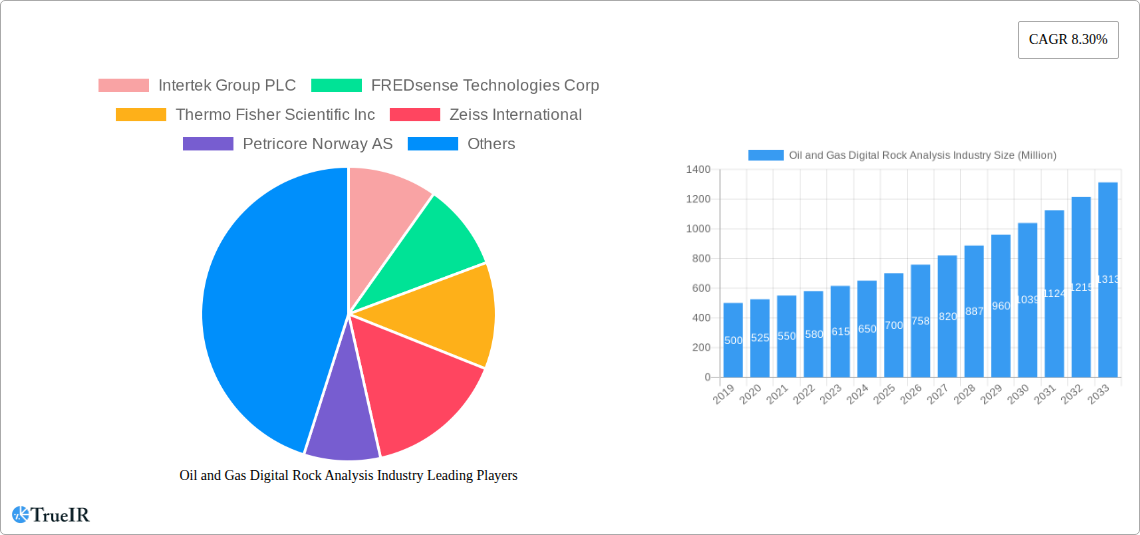
Oil and Gas Digital Rock Analysis Industry Company Market Share
Oil and Gas Digital Rock Analysis Industry Market Structure & Competitive Landscape
The Oil and Gas Digital Rock Analysis market is characterized by a moderate to high concentration, with a few major players holding significant market share. Innovation is a primary driver, fueled by the increasing demand for advanced reservoir characterization and enhanced oil recovery (EOR) techniques. Regulatory impacts, while not overtly restrictive, encourage the adoption of technologies that promote environmental sustainability and efficient resource extraction. Product substitutes are largely non-existent for the core digital rock analysis functionality, with advancements focusing on integration and refinement rather than outright replacement. End-user segmentation primarily falls into the conventional and unconventional oil and gas exploration and production (E&P) sectors. Mergers and acquisitions (M&A) trends are steadily increasing as larger companies seek to acquire specialized digital rock analysis capabilities and expand their service portfolios. For instance, the past few years have witnessed a steady volume of smaller technology firms being integrated into larger service providers, aiming to bolster their digital transformation offerings.
Oil and Gas Digital Rock Analysis Industry Market Trends & Opportunities
The Oil and Gas Digital Rock Analysis market is poised for substantial growth, driven by an insatiable demand for precise reservoir understanding and optimization. The global market size is projected to expand from an estimated USD 750 Million in 2025 to USD 1.5 Billion by 2033, exhibiting a compound annual growth rate (CAGR) of approximately 9.0% during the forecast period (2025-2033). This robust expansion is underpinned by a significant technological shift towards advanced computational methods, artificial intelligence (AI), and machine learning (ML) algorithms applied to petrophysical data. Consumer preferences within the oil and gas industry are increasingly leaning towards solutions that offer faster, more accurate, and cost-effective reservoir characterization, thereby reducing exploration risks and maximizing production efficiency. Competitive dynamics are intensifying, with established oilfield service providers increasingly investing in or acquiring digital rock analysis technologies to maintain their market leadership. Emerging technologies like real-time data integration and cloud-based analysis platforms are becoming critical differentiators. The market penetration rate of digital rock analysis is expected to climb significantly as more companies recognize its value in optimizing well placement, understanding complex pore networks, and predicting fluid flow behavior in diverse geological formations. This surge in adoption is further propelled by the need to unlock the potential of unconventional resources and improve the economics of mature fields. The integration of digital rock analysis with geomechanical modeling and production simulation tools is another key trend, offering a holistic approach to reservoir management. The growing emphasis on reducing operational costs and environmental impact also favors the adoption of digital rock analysis, as it allows for more informed decisions regarding drilling, stimulation, and production strategies, thereby minimizing waste and enhancing sustainability. The increasing complexity of geological formations encountered globally necessitates advanced analytical tools, positioning digital rock analysis as an indispensable technology in the modern E&P landscape.
Dominant Markets & Segments in Oil and Gas Digital Rock Analysis Industry
The Unconventional segment is emerging as a dominant force within the Oil and Gas Digital Rock Analysis industry, driven by the significant technological advancements and economic viability required to exploit these complex reserves. While conventional reservoirs continue to utilize digital rock analysis for enhanced understanding and optimization, the sheer scale and intricate pore structures of unconventional formations, such as shale gas and tight oil, necessitate more sophisticated digital modeling.
- Key Growth Drivers for Unconventional Segment:
- Technological Advancements in Fracking and Horizontal Drilling: These techniques have unlocked vast unconventional resources, creating a parallel demand for advanced reservoir characterization tools like digital rock analysis to optimize extraction strategies.
- Increasing Global Demand for Hydrocarbons: As conventional reserves mature, the focus shifts to unconventional sources, directly boosting the need for specialized analytical solutions.
- Data-Intensive Exploration and Production: Unconventional plays generate massive datasets, making computational tools for interpretation and modeling indispensable.
- Improved Economic Viability: Enhanced digital rock analysis capabilities contribute to optimizing completion designs and production, making unconventional projects more profitable.
- Policy Support for Energy Independence: Governments worldwide are promoting domestic energy production, often relying on unconventional resources, thus driving investment in related technologies.
The analysis of unconventional reservoirs often involves pore-scale modeling to understand complex flow paths, wettability alterations, and the impact of stimulation treatments. This level of detail is crucial for predicting production performance and optimizing recovery factors, areas where digital rock analysis excels. The market dominance of this segment is also influenced by the growing investment in research and development specifically targeting the challenges associated with unconventional resource extraction.
Geographically, North America continues to be a leading region in the adoption and development of digital rock analysis technologies, largely due to its significant unconventional oil and gas production. Countries like the United States and Canada are at the forefront, driven by extensive shale plays and a highly competitive E&P landscape that demands cutting-edge analytical solutions.
Oil and Gas Digital Rock Analysis Industry Product Analysis
Digital rock analysis products are revolutionizing how oil and gas companies understand subsurface reservoirs. These sophisticated software and hardware solutions enable the creation of high-resolution 3D digital models of rock samples, providing unparalleled insights into pore structure, permeability, porosity, and fluid flow behavior. Innovations focus on faster image acquisition, advanced AI-driven segmentation, and seamless integration with broader reservoir simulation workflows. Competitive advantages lie in the accuracy of pore-scale predictions, the speed of data processing, and the ability to link pore-level physics to macroscopic reservoir performance, thereby optimizing exploration and production strategies.
Key Drivers, Barriers & Challenges in Oil and Gas Digital Rock Analysis Industry
Key Drivers:
- Technological Advancements: The continuous evolution of imaging technologies (e.g., micro-CT scanning) and computational power enables more detailed and accurate digital rock models.
- Demand for Enhanced Oil Recovery (EOR): Maximizing production from existing fields necessitates a deeper understanding of reservoir characteristics, which digital rock analysis provides.
- Exploitation of Unconventional Resources: The complex pore networks of shale and tight formations require advanced analytical tools for efficient extraction.
- Cost Reduction in Exploration: Precise reservoir characterization reduces drilling uncertainties and optimizes well placement, leading to significant cost savings.
- Focus on Sustainability: Digital rock analysis aids in optimizing resource utilization and minimizing environmental impact.
Barriers & Challenges:
- High Initial Investment: The cost of advanced imaging equipment and specialized software can be a significant barrier for smaller companies.
- Data Volume and Management: The sheer volume of data generated by high-resolution imaging requires robust data management infrastructure and expertise.
- Integration with Existing Workflows: Seamless integration of digital rock analysis outputs into existing E&P software suites can be complex.
- Skilled Workforce Shortage: A lack of personnel with specialized expertise in digital rock physics and computational modeling.
- Standardization of Methods: While improving, the lack of universal standards for data acquisition and interpretation can sometimes lead to comparability issues.
Growth Drivers in the Oil and Gas Digital Rock Analysis Industry Market
The growth of the Oil and Gas Digital Rock Analysis industry is propelled by several key factors. Technologically, advancements in X-ray computed tomography (CT) scanning and focused ion beam scanning electron microscopy (FIB-SEM) are enabling higher resolution imaging of rock samples, leading to more accurate pore-scale models. Economically, the drive to reduce exploration risk and maximize recovery from both conventional and unconventional reservoirs is a primary motivator, as digital rock analysis provides critical insights for optimized well placement and production strategies. Regulatory pressures to improve efficiency and minimize environmental impact also contribute, as digital rock analysis facilitates informed decision-making for sustainable resource extraction.
Challenges Impacting Oil and Gas Digital Rock Analysis Industry Growth
Several challenges impact the growth of the Oil and Gas Digital Rock Analysis industry. Regulatory complexities, while generally favoring efficiency, can sometimes involve lengthy approval processes for new technologies or data-sharing agreements. Supply chain issues, particularly for specialized high-precision imaging equipment, can lead to delays in deployment. Competitive pressures are increasing as more service providers offer digital rock analysis capabilities, leading to price sensitivity. Furthermore, the high initial capital expenditure required for advanced equipment and the need for a highly skilled workforce trained in petrophysics, geology, and computational modeling present ongoing hurdles for widespread adoption.
Key Players Shaping the Oil and Gas Digital Rock Analysis Industry Market
- Halliburton Company
- Schlumberger Limited
- Core Laboratories N V
- Thermo Fisher Scientific Inc
- Zeiss International
- Intertek Group PLC
- FREDsense Technologies Corp
- Petricore Norway AS
Significant Oil and Gas Digital Rock Analysis Industry Industry Milestones
- January 2022: Imperial College London announced the opening of applications for scholarships related to Digital Rock Analysis technologies, aiming to broaden the concept and integrate Pore-to-core linkages and upscaling for CO2 Storage.
Future Outlook for Oil and Gas Digital Rock Analysis Industry Market
The future outlook for the Oil and Gas Digital Rock Analysis industry is exceptionally bright, characterized by sustained growth and increasing integration into mainstream E&P workflows. Strategic opportunities lie in the development of AI-powered predictive models that can extrapolate pore-scale properties to entire reservoirs with unprecedented accuracy, reducing the need for extensive core sampling. The market potential is further amplified by the growing focus on carbon capture and storage (CCS) technologies, where digital rock analysis will play a crucial role in understanding subsurface pore structures for effective CO2 sequestration. Continued investment in cloud-based platforms will enhance accessibility and collaboration, fostering wider adoption across the global oil and gas sector.
Oil and Gas Digital Rock Analysis Industry Segmentation
-
1. Type
- 1.1. Conventional
- 1.2. Unconventional
Oil and Gas Digital Rock Analysis Industry Segmentation By Geography
-
1. North America
- 1.1. United States
- 1.2. Canada
- 1.3. Rest of North America
-
2. Asia Pacific
- 2.1. China
- 2.2. India
- 2.3. Australia
- 2.4. Indonesia
- 2.5. Malaysia
- 2.6. Rest of Asia Pacific
-
3. Europe
- 3.1. Russia
- 3.2. Norway
- 3.3. United Kingdom
- 3.4. Rest of Europe
-
4. South America
- 4.1. Brazil
- 4.2. Argentina
- 4.3. Venezuela
- 4.4. Rest of South America
-
5. Middle East and Africa
- 5.1. Saudi Arabia
- 5.2. United Arab Emirates
- 5.3. Qatar
- 5.4. Nigeria
- 5.5. Rest of Middle East and Africa
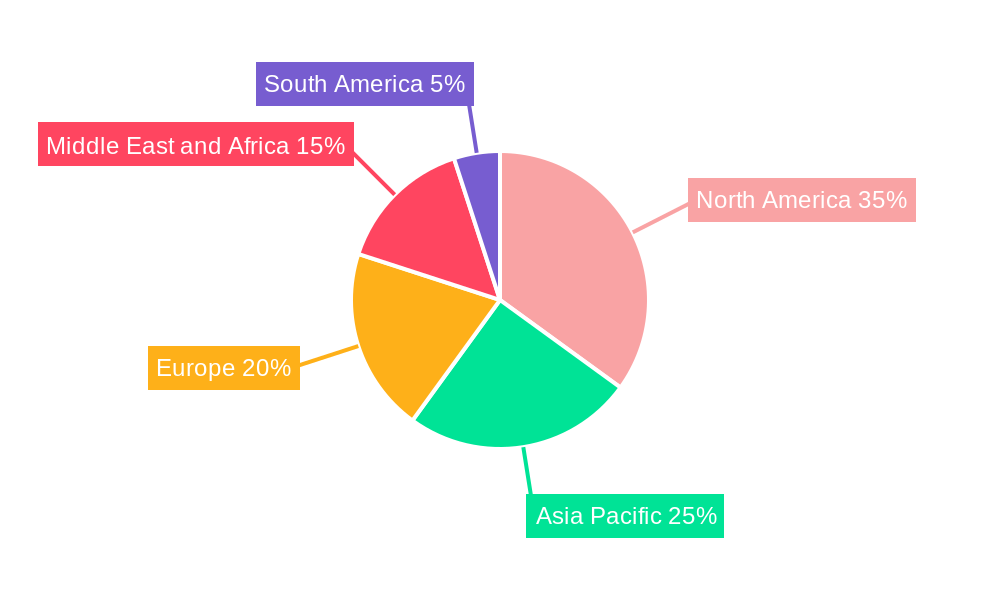
Oil and Gas Digital Rock Analysis Industry Regional Market Share
Geographic Coverage of Oil and Gas Digital Rock Analysis Industry
Oil and Gas Digital Rock Analysis Industry REPORT HIGHLIGHTS
| Aspects | Details |
|---|---|
| Study Period | 2020-2034 |
| Base Year | 2025 |
| Estimated Year | 2026 |
| Forecast Period | 2026-2034 |
| Historical Period | 2020-2025 |
| Growth Rate | CAGR of 7.68% from 2020-2034 |
| Segmentation |
|
Table of Contents
- 1. Introduction
- 1.1. Research Scope
- 1.2. Market Segmentation
- 1.3. Research Objective
- 1.4. Definitions and Assumptions
- 2. Executive Summary
- 2.1. Market Snapshot
- 3. Market Dynamics
- 3.1. Market Drivers
- 3.2. Market Restrains
- 3.3. Market Trends
- 3.4. Market Opportunities
- 4. Market Factor Analysis
- 4.1. Porters Five Forces
- 4.1.1. Bargaining Power of Suppliers
- 4.1.2. Bargaining Power of Buyers
- 4.1.3. Threat of New Entrants
- 4.1.4. Threat of Substitutes
- 4.1.5. Competitive Rivalry
- 4.2. PESTEL analysis
- 4.3. BCG Analysis
- 4.3.1. Stars (High Growth, High Market Share)
- 4.3.2. Cash Cows (Low Growth, High Market Share)
- 4.3.3. Question Mark (High Growth, Low Market Share)
- 4.3.4. Dogs (Low Growth, Low Market Share)
- 4.4. Ansoff Matrix Analysis
- 4.5. Supply Chain Analysis
- 4.6. Regulatory Landscape
- 4.7. Current Market Potential and Opportunity Assessment (TAM–SAM–SOM Framework)
- 4.8. TIR Analyst Note
- 4.1. Porters Five Forces
- 5. Market Analysis, Insights and Forecast 2021-2033
- 5.1. Market Analysis, Insights and Forecast - by Type
- 5.1.1. Conventional
- 5.1.2. Unconventional
- 5.2. Market Analysis, Insights and Forecast - by Region
- 5.2.1. North America
- 5.2.2. Asia Pacific
- 5.2.3. Europe
- 5.2.4. South America
- 5.2.5. Middle East and Africa
- 5.1. Market Analysis, Insights and Forecast - by Type
- 6. Global Oil and Gas Digital Rock Analysis Industry Analysis, Insights and Forecast, 2021-2033
- 6.1. Market Analysis, Insights and Forecast - by Type
- 6.1.1. Conventional
- 6.1.2. Unconventional
- 6.1. Market Analysis, Insights and Forecast - by Type
- 7. North America Oil and Gas Digital Rock Analysis Industry Analysis, Insights and Forecast, 2020-2032
- 7.1. Market Analysis, Insights and Forecast - by Type
- 7.1.1. Conventional
- 7.1.2. Unconventional
- 7.1. Market Analysis, Insights and Forecast - by Type
- 8. Asia Pacific Oil and Gas Digital Rock Analysis Industry Analysis, Insights and Forecast, 2020-2032
- 8.1. Market Analysis, Insights and Forecast - by Type
- 8.1.1. Conventional
- 8.1.2. Unconventional
- 8.1. Market Analysis, Insights and Forecast - by Type
- 9. Europe Oil and Gas Digital Rock Analysis Industry Analysis, Insights and Forecast, 2020-2032
- 9.1. Market Analysis, Insights and Forecast - by Type
- 9.1.1. Conventional
- 9.1.2. Unconventional
- 9.1. Market Analysis, Insights and Forecast - by Type
- 10. South America Oil and Gas Digital Rock Analysis Industry Analysis, Insights and Forecast, 2020-2032
- 10.1. Market Analysis, Insights and Forecast - by Type
- 10.1.1. Conventional
- 10.1.2. Unconventional
- 10.1. Market Analysis, Insights and Forecast - by Type
- 11. Middle East and Africa Oil and Gas Digital Rock Analysis Industry Analysis, Insights and Forecast, 2020-2032
- 11.1. Market Analysis, Insights and Forecast - by Type
- 11.1.1. Conventional
- 11.1.2. Unconventional
- 11.1. Market Analysis, Insights and Forecast - by Type
- 12. Competitive Analysis
- 12.1. Company Profiles
- 12.1.1 Intertek Group PLC
- 12.1.1.1. Company Overview
- 12.1.1.2. Products
- 12.1.1.3. Company Financials
- 12.1.1.4. SWOT Analysis
- 12.1.2 FREDsense Technologies Corp
- 12.1.2.1. Company Overview
- 12.1.2.2. Products
- 12.1.2.3. Company Financials
- 12.1.2.4. SWOT Analysis
- 12.1.3 Thermo Fisher Scientific Inc
- 12.1.3.1. Company Overview
- 12.1.3.2. Products
- 12.1.3.3. Company Financials
- 12.1.3.4. SWOT Analysis
- 12.1.4 Zeiss International
- 12.1.4.1. Company Overview
- 12.1.4.2. Products
- 12.1.4.3. Company Financials
- 12.1.4.4. SWOT Analysis
- 12.1.5 Petricore Norway AS
- 12.1.5.1. Company Overview
- 12.1.5.2. Products
- 12.1.5.3. Company Financials
- 12.1.5.4. SWOT Analysis
- 12.1.6 Halliburton Company
- 12.1.6.1. Company Overview
- 12.1.6.2. Products
- 12.1.6.3. Company Financials
- 12.1.6.4. SWOT Analysis
- 12.1.7 Core Laboratories N V
- 12.1.7.1. Company Overview
- 12.1.7.2. Products
- 12.1.7.3. Company Financials
- 12.1.7.4. SWOT Analysis
- 12.1.8 Schlumberger Limited
- 12.1.8.1. Company Overview
- 12.1.8.2. Products
- 12.1.8.3. Company Financials
- 12.1.8.4. SWOT Analysis
- 12.1.1 Intertek Group PLC
- 12.2. Market Entropy
- 12.2.1 Company's Key Areas Served
- 12.2.2 Recent Developments
- 12.3. Company Market Share Analysis 2025
- 12.3.1 Top 5 Companies Market Share Analysis
- 12.3.2 Top 3 Companies Market Share Analysis
- 12.4. List of Potential Customers
- 13. Research Methodology
List of Figures
- Figure 1: Global Oil and Gas Digital Rock Analysis Industry Revenue Breakdown (billion, %) by Region 2025 & 2033
- Figure 2: North America Oil and Gas Digital Rock Analysis Industry Revenue (billion), by Type 2025 & 2033
- Figure 3: North America Oil and Gas Digital Rock Analysis Industry Revenue Share (%), by Type 2025 & 2033
- Figure 4: North America Oil and Gas Digital Rock Analysis Industry Revenue (billion), by Country 2025 & 2033
- Figure 5: North America Oil and Gas Digital Rock Analysis Industry Revenue Share (%), by Country 2025 & 2033
- Figure 6: Asia Pacific Oil and Gas Digital Rock Analysis Industry Revenue (billion), by Type 2025 & 2033
- Figure 7: Asia Pacific Oil and Gas Digital Rock Analysis Industry Revenue Share (%), by Type 2025 & 2033
- Figure 8: Asia Pacific Oil and Gas Digital Rock Analysis Industry Revenue (billion), by Country 2025 & 2033
- Figure 9: Asia Pacific Oil and Gas Digital Rock Analysis Industry Revenue Share (%), by Country 2025 & 2033
- Figure 10: Europe Oil and Gas Digital Rock Analysis Industry Revenue (billion), by Type 2025 & 2033
- Figure 11: Europe Oil and Gas Digital Rock Analysis Industry Revenue Share (%), by Type 2025 & 2033
- Figure 12: Europe Oil and Gas Digital Rock Analysis Industry Revenue (billion), by Country 2025 & 2033
- Figure 13: Europe Oil and Gas Digital Rock Analysis Industry Revenue Share (%), by Country 2025 & 2033
- Figure 14: South America Oil and Gas Digital Rock Analysis Industry Revenue (billion), by Type 2025 & 2033
- Figure 15: South America Oil and Gas Digital Rock Analysis Industry Revenue Share (%), by Type 2025 & 2033
- Figure 16: South America Oil and Gas Digital Rock Analysis Industry Revenue (billion), by Country 2025 & 2033
- Figure 17: South America Oil and Gas Digital Rock Analysis Industry Revenue Share (%), by Country 2025 & 2033
- Figure 18: Middle East and Africa Oil and Gas Digital Rock Analysis Industry Revenue (billion), by Type 2025 & 2033
- Figure 19: Middle East and Africa Oil and Gas Digital Rock Analysis Industry Revenue Share (%), by Type 2025 & 2033
- Figure 20: Middle East and Africa Oil and Gas Digital Rock Analysis Industry Revenue (billion), by Country 2025 & 2033
- Figure 21: Middle East and Africa Oil and Gas Digital Rock Analysis Industry Revenue Share (%), by Country 2025 & 2033
List of Tables
- Table 1: Global Oil and Gas Digital Rock Analysis Industry Revenue billion Forecast, by Type 2020 & 2033
- Table 2: Global Oil and Gas Digital Rock Analysis Industry Revenue billion Forecast, by Region 2020 & 2033
- Table 3: Global Oil and Gas Digital Rock Analysis Industry Revenue billion Forecast, by Type 2020 & 2033
- Table 4: Global Oil and Gas Digital Rock Analysis Industry Revenue billion Forecast, by Country 2020 & 2033
- Table 5: United States Oil and Gas Digital Rock Analysis Industry Revenue (billion) Forecast, by Application 2020 & 2033
- Table 6: Canada Oil and Gas Digital Rock Analysis Industry Revenue (billion) Forecast, by Application 2020 & 2033
- Table 7: Rest of North America Oil and Gas Digital Rock Analysis Industry Revenue (billion) Forecast, by Application 2020 & 2033
- Table 8: Global Oil and Gas Digital Rock Analysis Industry Revenue billion Forecast, by Type 2020 & 2033
- Table 9: Global Oil and Gas Digital Rock Analysis Industry Revenue billion Forecast, by Country 2020 & 2033
- Table 10: China Oil and Gas Digital Rock Analysis Industry Revenue (billion) Forecast, by Application 2020 & 2033
- Table 11: India Oil and Gas Digital Rock Analysis Industry Revenue (billion) Forecast, by Application 2020 & 2033
- Table 12: Australia Oil and Gas Digital Rock Analysis Industry Revenue (billion) Forecast, by Application 2020 & 2033
- Table 13: Indonesia Oil and Gas Digital Rock Analysis Industry Revenue (billion) Forecast, by Application 2020 & 2033
- Table 14: Malaysia Oil and Gas Digital Rock Analysis Industry Revenue (billion) Forecast, by Application 2020 & 2033
- Table 15: Rest of Asia Pacific Oil and Gas Digital Rock Analysis Industry Revenue (billion) Forecast, by Application 2020 & 2033
- Table 16: Global Oil and Gas Digital Rock Analysis Industry Revenue billion Forecast, by Type 2020 & 2033
- Table 17: Global Oil and Gas Digital Rock Analysis Industry Revenue billion Forecast, by Country 2020 & 2033
- Table 18: Russia Oil and Gas Digital Rock Analysis Industry Revenue (billion) Forecast, by Application 2020 & 2033
- Table 19: Norway Oil and Gas Digital Rock Analysis Industry Revenue (billion) Forecast, by Application 2020 & 2033
- Table 20: United Kingdom Oil and Gas Digital Rock Analysis Industry Revenue (billion) Forecast, by Application 2020 & 2033
- Table 21: Rest of Europe Oil and Gas Digital Rock Analysis Industry Revenue (billion) Forecast, by Application 2020 & 2033
- Table 22: Global Oil and Gas Digital Rock Analysis Industry Revenue billion Forecast, by Type 2020 & 2033
- Table 23: Global Oil and Gas Digital Rock Analysis Industry Revenue billion Forecast, by Country 2020 & 2033
- Table 24: Brazil Oil and Gas Digital Rock Analysis Industry Revenue (billion) Forecast, by Application 2020 & 2033
- Table 25: Argentina Oil and Gas Digital Rock Analysis Industry Revenue (billion) Forecast, by Application 2020 & 2033
- Table 26: Venezuela Oil and Gas Digital Rock Analysis Industry Revenue (billion) Forecast, by Application 2020 & 2033
- Table 27: Rest of South America Oil and Gas Digital Rock Analysis Industry Revenue (billion) Forecast, by Application 2020 & 2033
- Table 28: Global Oil and Gas Digital Rock Analysis Industry Revenue billion Forecast, by Type 2020 & 2033
- Table 29: Global Oil and Gas Digital Rock Analysis Industry Revenue billion Forecast, by Country 2020 & 2033
- Table 30: Saudi Arabia Oil and Gas Digital Rock Analysis Industry Revenue (billion) Forecast, by Application 2020 & 2033
- Table 31: United Arab Emirates Oil and Gas Digital Rock Analysis Industry Revenue (billion) Forecast, by Application 2020 & 2033
- Table 32: Qatar Oil and Gas Digital Rock Analysis Industry Revenue (billion) Forecast, by Application 2020 & 2033
- Table 33: Nigeria Oil and Gas Digital Rock Analysis Industry Revenue (billion) Forecast, by Application 2020 & 2033
- Table 34: Rest of Middle East and Africa Oil and Gas Digital Rock Analysis Industry Revenue (billion) Forecast, by Application 2020 & 2033
Frequently Asked Questions
1. What is the projected Compound Annual Growth Rate (CAGR) of the Oil and Gas Digital Rock Analysis Industry?
The projected CAGR is approximately 7.68%.
2. Which companies are prominent players in the Oil and Gas Digital Rock Analysis Industry?
Key companies in the market include Intertek Group PLC, FREDsense Technologies Corp, Thermo Fisher Scientific Inc, Zeiss International, Petricore Norway AS, Halliburton Company, Core Laboratories N V, Schlumberger Limited.
3. What are the main segments of the Oil and Gas Digital Rock Analysis Industry?
The market segments include Type.
4. Can you provide details about the market size?
The market size is estimated to be USD 1.24 billion as of 2022.
5. What are some drivers contributing to market growth?
4.; Focus On Unconventional Resources4.; Global Energy Demand And Exploration Activities.
6. What are the notable trends driving market growth?
Conventional Segment to Dominate the Market.
7. Are there any restraints impacting market growth?
4.; High Implementation Costs.
8. Can you provide examples of recent developments in the market?
January 2022: Imperial College London announced that they had opened applications for submissions for scholarships related to Digital Rock Analysis technologies as the university is looking to broaden the concept and integrate Pore-to-core linkages and upscaling for CO2 Storage.
9. What pricing options are available for accessing the report?
Pricing options include single-user, multi-user, and enterprise licenses priced at USD 4750, USD 5250, and USD 8750 respectively.
10. Is the market size provided in terms of value or volume?
The market size is provided in terms of value, measured in billion.
11. Are there any specific market keywords associated with the report?
Yes, the market keyword associated with the report is "Oil and Gas Digital Rock Analysis Industry," which aids in identifying and referencing the specific market segment covered.
12. How do I determine which pricing option suits my needs best?
The pricing options vary based on user requirements and access needs. Individual users may opt for single-user licenses, while businesses requiring broader access may choose multi-user or enterprise licenses for cost-effective access to the report.
13. Are there any additional resources or data provided in the Oil and Gas Digital Rock Analysis Industry report?
While the report offers comprehensive insights, it's advisable to review the specific contents or supplementary materials provided to ascertain if additional resources or data are available.
14. How can I stay updated on further developments or reports in the Oil and Gas Digital Rock Analysis Industry?
To stay informed about further developments, trends, and reports in the Oil and Gas Digital Rock Analysis Industry, consider subscribing to industry newsletters, following relevant companies and organizations, or regularly checking reputable industry news sources and publications.
Methodology
Step 1 - Identification of Relevant Samples Size from Population Database


Step 2 - Approaches for Defining Global Market Size (Value, Volume* & Price*)

Note*: In applicable scenarios
Step 3 - Data Sources
Primary Research
- Web Analytics
- Survey Reports
- Research Institute
- Latest Research Reports
- Opinion Leaders
Secondary Research
- Annual Reports
- White Paper
- Latest Press Release
- Industry Association
- Paid Database
- Investor Presentations

Step 4 - Data Triangulation
Involves using different sources of information in order to increase the validity of a study
These sources are likely to be stakeholders in a program - participants, other researchers, program staff, other community members, and so on.
Then we put all data in single framework & apply various statistical tools to find out the dynamic on the market.
During the analysis stage, feedback from the stakeholder groups would be compared to determine areas of agreement as well as areas of divergence