

Key Insights
The global oil and gas pump market is projected for significant expansion, driven by escalating energy demand and continuous upstream, midstream, and downstream exploration and production activities. The market is anticipated to grow at a Compound Annual Growth Rate (CAGR) of 8.8%, reaching a market size of $14.27 billion by 2025. Key growth drivers include the increasing need for efficient fluid handling solutions across all operational segments and technological advancements such as smart pumps and enhanced material science for improved durability and efficiency. The dynamic pumps segment leads due to its versatility, while positive displacement pumps serve specific applications. North America and the Asia-Pacific region are expected to dominate, fueled by substantial investments in oil and gas infrastructure and exploration. Challenges include fluctuating oil prices and stringent environmental regulations.
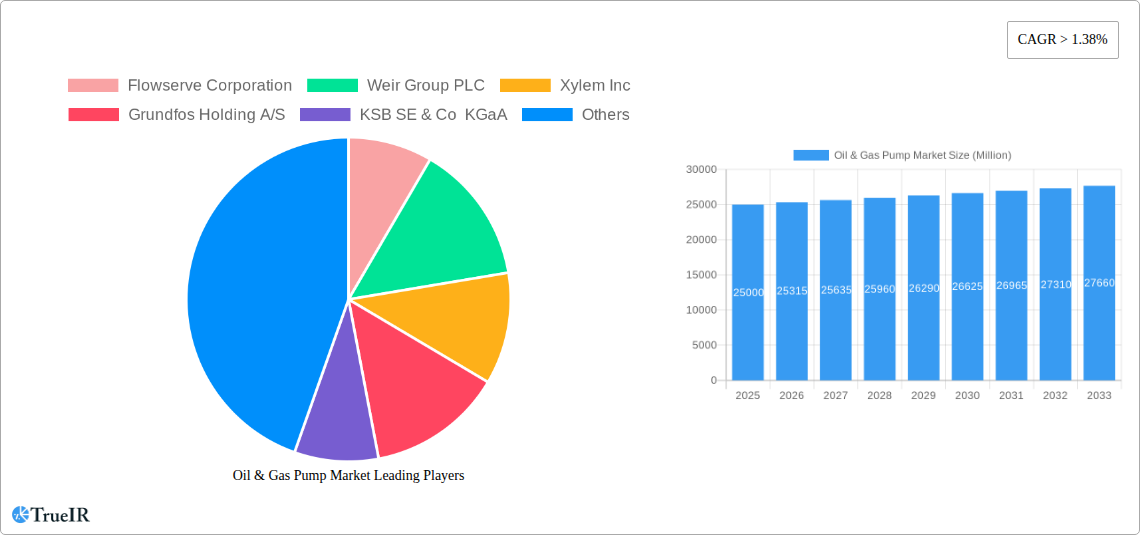
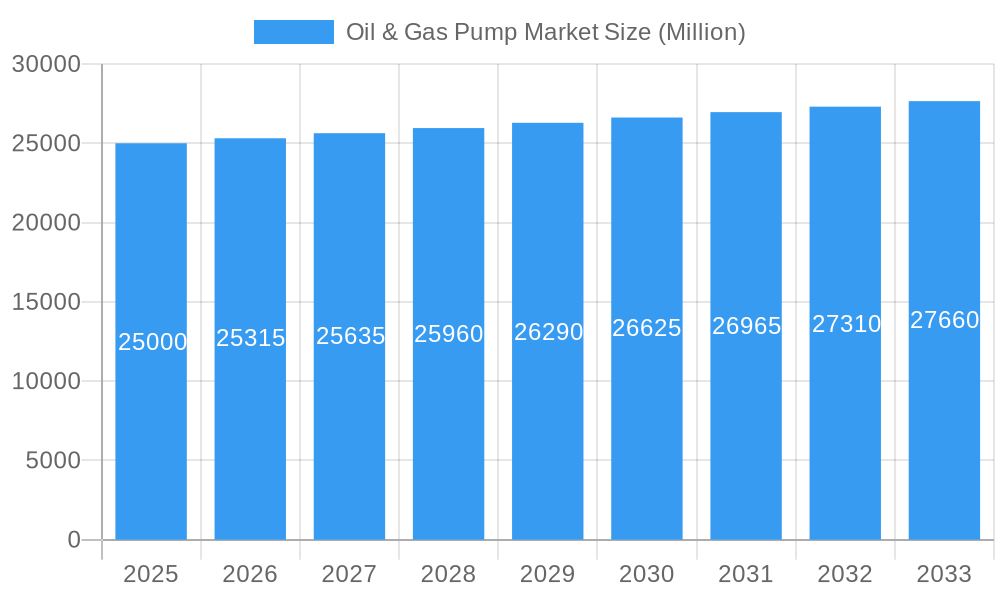
Oil & Gas Pump Market Market Size (In Billion)
The forecast period (2025-2033) indicates sustained market growth, influenced by geopolitical factors and global economic trends. Strategic initiatives such as partnerships, mergers, acquisitions, and product diversification are crucial for market players to enhance competitiveness. The demand for energy-efficient and environmentally friendly pumps is rising, encouraging R&D in sustainable technologies, including pumps with reduced carbon footprints and improved operational efficiency to meet sustainability goals and emission regulations. Segmentation by application (upstream, midstream, and downstream) provides insights into evolving operational requirements and technological needs within the oil and gas sector.
Oil & Gas Pump Market Company Market Share
Oil & Gas Pump Market Report: 2019-2033 Forecast
This comprehensive report provides an in-depth analysis of the global Oil & Gas Pump market, offering invaluable insights for industry stakeholders, investors, and strategic decision-makers. Covering the period from 2019 to 2033, with a base year of 2025 and a forecast period of 2025-2033, this report meticulously examines market size, trends, competitive dynamics, and future growth potential. The report leverages a robust methodology incorporating extensive primary and secondary research, delivering accurate and actionable intelligence.
Oil & Gas Pump Market Structure & Competitive Landscape
The Oil & Gas Pump market exhibits a moderately consolidated structure, with a Herfindahl-Hirschman Index (HHI) of xx in 2024. Key players, including Flowserve Corporation, Weir Group PLC, Xylem Inc, Grundfos Holding A/S, KSB SE & Co KGaA, ITT Inc, Baker Hughes Co, Sulzer AG, Alfa Laval AB, and Gardner Denver Holdings Inc, compete based on technological innovation, operational efficiency, and market reach. The market's competitive intensity is further amplified by continuous technological advancements, resulting in a dynamic landscape characterized by both organic growth strategies and strategic mergers and acquisitions (M&A).
- Market Concentration: The HHI value indicates a moderate level of market concentration, with significant potential for further consolidation through M&A activities. The xx% market share held by the top 5 players highlights the influence of established companies.
- Innovation Drivers: Ongoing research and development efforts focus on improving pump efficiency, durability, and environmental impact. This includes the development of advanced materials, smart sensors, and digital technologies for remote monitoring and predictive maintenance.
- Regulatory Impacts: Stringent environmental regulations globally are driving demand for energy-efficient and environmentally friendly pumps. These regulations influence the design, manufacturing, and operation of oil & gas pumps.
- Product Substitutes: While few direct substitutes exist for oil & gas pumps, alternative technologies like pipeline optimization and improved reservoir management may indirectly impact market growth.
- End-User Segmentation: The market is segmented based on application (Upstream, Midstream, Downstream) and pump type (Dynamic Pumps, Positive Displacement Pumps). The Upstream segment currently holds the largest market share, driven by ongoing exploration and production activities.
- M&A Trends: The past five years have witnessed xx M&A transactions in the Oil & Gas Pump market, with a total value exceeding $xx Million. These activities often involve smaller specialized players being acquired by larger corporations aiming for market expansion.
Oil & Gas Pump Market Trends & Opportunities
The global Oil & Gas Pump market is poised for robust growth, driven by increasing global energy demand and extensive exploration and production activities worldwide. The market is projected to reach $xx Million by 2033, exhibiting a Compound Annual Growth Rate (CAGR) of xx% during the forecast period (2025-2033). Technological advancements, particularly in digitalization and automation, are creating new opportunities for enhancing operational efficiency and reducing operational costs. Furthermore, the growing focus on sustainability and environmental compliance is leading to a shift towards energy-efficient pump technologies. Competitive dynamics are characterized by intense rivalry among established players and the emergence of innovative newcomers offering specialized solutions. Market penetration rates vary across different regions and segments, with mature markets experiencing slower growth compared to rapidly developing regions. Consumer preference trends indicate a growing demand for pumps with advanced functionalities, higher reliability, and reduced environmental footprint.
Dominant Markets & Segments in Oil & Gas Pump Market
The Upstream segment currently holds the largest market share within the Oil & Gas Pump market, accounting for approximately xx% of the total market value in 2024. The strong growth in this segment is attributed to the increasing investments in exploration and production activities, particularly in regions with significant oil and gas reserves.
- Key Growth Drivers in Upstream Segment:
- Significant investments in new oil and gas exploration projects.
- Expansion of existing oil and gas infrastructure.
- Technological advancements in enhanced oil recovery techniques.
The Positive Displacement Pump type demonstrates the highest growth potential, projected to reach $xx Million by 2033. This segment is characterized by its ability to handle high-viscosity fluids and challenging operational conditions, making it particularly suitable for various oil & gas applications.
- Key Growth Drivers in Positive Displacement Pumps Segment:
- Growing demand for pumps capable of handling viscous fluids.
- Increasing adoption of advanced materials for enhanced durability.
- Improved efficiency and reliability compared to traditional pumps.
The North American region dominated the market in 2024, representing xx% of the global market share. This is largely driven by the region’s robust oil and gas production activities and strong infrastructure development.
- Key Growth Drivers in North America:
- Strong domestic oil and gas production.
- Significant investments in pipeline infrastructure development.
- Government support for energy sector expansion.
Oil & Gas Pump Market Product Analysis
Recent product innovations in the oil and gas pump market focus on improving efficiency, reliability, and environmental sustainability. These include advancements in materials science, leading to pumps with extended lifespans and reduced maintenance needs. The integration of smart sensors and digital technologies enables remote monitoring and predictive maintenance, minimizing downtime and operational costs. Furthermore, the development of energy-efficient pump designs reduces the overall energy consumption of oil and gas operations, aligning with growing environmental concerns. This innovative approach enhances the market competitiveness of leading players, providing distinct advantages to early adopters.
Key Drivers, Barriers & Challenges in Oil & Gas Pump Market
Key Drivers: Technological advancements such as the development of more efficient and durable pumps are driving market growth. Increasing global energy demand and rising investments in oil & gas exploration and production activities are significant contributors to market expansion. Moreover, supportive government policies and regulatory frameworks are creating a favorable environment for market growth.
Challenges: Fluctuations in oil and gas prices present a significant challenge to market stability. Supply chain disruptions, particularly related to sourcing critical components, can impact production and increase costs. Stringent environmental regulations may impose significant compliance costs and may also restrict the use of certain pump technologies. Furthermore, intense competition among existing players can pressure profit margins. The estimated impact of these factors on market growth in 2025 is projected to be a reduction of approximately xx% due to supply chain and pricing volatility.
Growth Drivers in the Oil & Gas Pump Market
The Oil & Gas Pump market growth is fuelled by several factors. Firstly, the ongoing expansion of global energy demand and infrastructure developments are directly driving the need for efficient and reliable pumping solutions. Secondly, technological advancements, including the integration of smart technologies and automation for remote monitoring and predictive maintenance, significantly boost operational efficiency and reduce downtime. Finally, stringent environmental regulations stimulate the development and adoption of more energy-efficient and environmentally friendly pump systems. These combined factors create a strong impetus for market growth.
Challenges Impacting Oil & Gas Pump Market Growth
Several factors challenge the Oil & Gas Pump market's growth trajectory. Volatile oil and gas prices create market uncertainty, influencing investment decisions and demand patterns. Supply chain disruptions, exacerbated by geopolitical factors and material shortages, increase production costs and limit supply. Moreover, stringent environmental regulations and compliance requirements increase the cost of operations and can potentially limit the deployment of certain technologies. Intense competition among established players also puts pressure on profit margins. These combined factors create headwinds for sustainable market growth.
Key Players Shaping the Oil & Gas Pump Market
- Flowserve Corporation
- Weir Group PLC
- Xylem Inc
- Grundfos Holding A/S
- KSB SE & Co KGaA
- ITT Inc
- Baker Hughes Co
- Sulzer AG
- Alfa Laval AB
- Gardner Denver Holdings Inc
Significant Oil & Gas Pump Market Industry Milestones
- January 2022: Xylem Inc. launched a new line of energy-efficient pumps designed for offshore oil and gas applications.
- June 2023: Flowserve Corporation acquired a smaller pump manufacturer specializing in high-pressure pumps used in enhanced oil recovery.
- October 2024: A major regulatory update regarding emissions from oil & gas pumping systems was implemented in the European Union.
- December 2024: Baker Hughes Co announced a strategic partnership to develop next-generation smart pumps incorporating AI-based predictive maintenance.
Future Outlook for Oil & Gas Pump Market
The Oil & Gas Pump market is expected to experience continued growth, driven by factors such as rising global energy demand, investments in exploration and production, and technological advancements. Strategic opportunities lie in developing and deploying energy-efficient and sustainable pumping solutions. The focus on digitalization, automation, and predictive maintenance will continue to enhance operational efficiency and reduce environmental impact. The market’s future success hinges on adapting to evolving regulatory landscapes and mitigating supply chain risks. The potential for market expansion is significant, with further penetration into developing economies and emerging applications driving sustained growth.
Oil & Gas Pump Market Segmentation
-
1. Type
- 1.1. Dynamic Pumps
- 1.2. Positive Displacement Pumps
-
2. Application
- 2.1. Upstream
- 2.2. Midstream
- 2.3. Downstream
Oil & Gas Pump Market Segmentation By Geography
- 1. North America
- 2. Europe
- 3. Asia Pacific
- 4. South America
- 5. Middle East and Africa
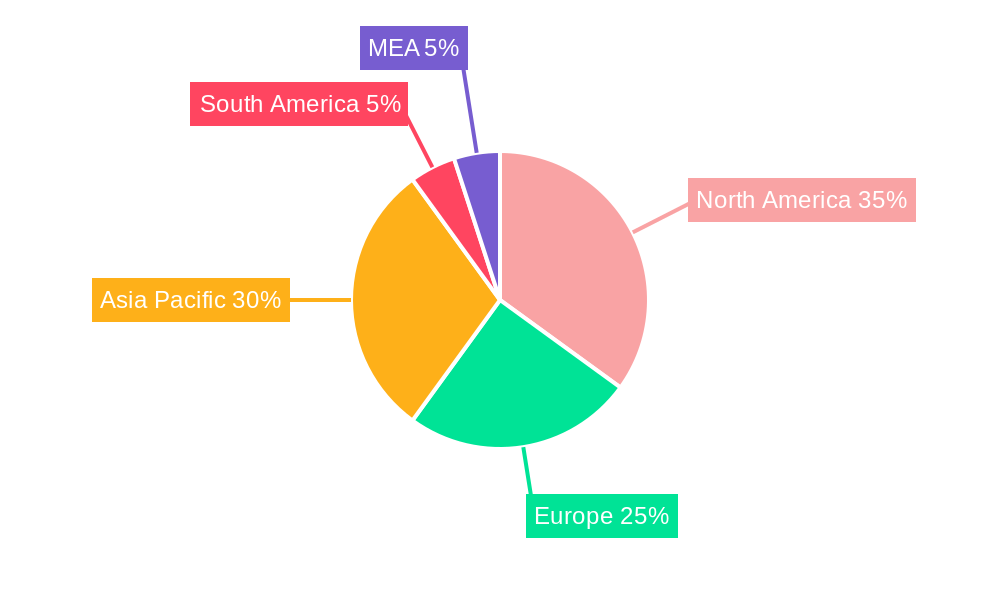
Oil & Gas Pump Market Regional Market Share
Geographic Coverage of Oil & Gas Pump Market
Oil & Gas Pump Market REPORT HIGHLIGHTS
| Aspects | Details |
|---|---|
| Study Period | 2020-2034 |
| Base Year | 2025 |
| Estimated Year | 2026 |
| Forecast Period | 2026-2034 |
| Historical Period | 2020-2025 |
| Growth Rate | CAGR of 8.8% from 2020-2034 |
| Segmentation |
|
Table of Contents
- 1. Introduction
- 1.1. Research Scope
- 1.2. Market Segmentation
- 1.3. Research Objective
- 1.4. Definitions and Assumptions
- 2. Executive Summary
- 2.1. Market Snapshot
- 3. Market Dynamics
- 3.1. Market Drivers
- 3.2. Market Restrains
- 3.3. Market Trends
- 3.4. Market Opportunities
- 4. Market Factor Analysis
- 4.1. Porters Five Forces
- 4.1.1. Bargaining Power of Suppliers
- 4.1.2. Bargaining Power of Buyers
- 4.1.3. Threat of New Entrants
- 4.1.4. Threat of Substitutes
- 4.1.5. Competitive Rivalry
- 4.2. PESTEL analysis
- 4.3. BCG Analysis
- 4.3.1. Stars (High Growth, High Market Share)
- 4.3.2. Cash Cows (Low Growth, High Market Share)
- 4.3.3. Question Mark (High Growth, Low Market Share)
- 4.3.4. Dogs (Low Growth, Low Market Share)
- 4.4. Ansoff Matrix Analysis
- 4.5. Supply Chain Analysis
- 4.6. Regulatory Landscape
- 4.7. Current Market Potential and Opportunity Assessment (TAM–SAM–SOM Framework)
- 4.8. TIR Analyst Note
- 4.1. Porters Five Forces
- 5. Market Analysis, Insights and Forecast 2021-2033
- 5.1. Market Analysis, Insights and Forecast - by Type
- 5.1.1. Dynamic Pumps
- 5.1.2. Positive Displacement Pumps
- 5.2. Market Analysis, Insights and Forecast - by Application
- 5.2.1. Upstream
- 5.2.2. Midstream
- 5.2.3. Downstream
- 5.3. Market Analysis, Insights and Forecast - by Region
- 5.3.1. North America
- 5.3.2. Europe
- 5.3.3. Asia Pacific
- 5.3.4. South America
- 5.3.5. Middle East and Africa
- 5.1. Market Analysis, Insights and Forecast - by Type
- 6. Global Oil & Gas Pump Market Analysis, Insights and Forecast, 2021-2033
- 6.1. Market Analysis, Insights and Forecast - by Type
- 6.1.1. Dynamic Pumps
- 6.1.2. Positive Displacement Pumps
- 6.2. Market Analysis, Insights and Forecast - by Application
- 6.2.1. Upstream
- 6.2.2. Midstream
- 6.2.3. Downstream
- 6.1. Market Analysis, Insights and Forecast - by Type
- 7. North America Oil & Gas Pump Market Analysis, Insights and Forecast, 2020-2032
- 7.1. Market Analysis, Insights and Forecast - by Type
- 7.1.1. Dynamic Pumps
- 7.1.2. Positive Displacement Pumps
- 7.2. Market Analysis, Insights and Forecast - by Application
- 7.2.1. Upstream
- 7.2.2. Midstream
- 7.2.3. Downstream
- 7.1. Market Analysis, Insights and Forecast - by Type
- 8. Europe Oil & Gas Pump Market Analysis, Insights and Forecast, 2020-2032
- 8.1. Market Analysis, Insights and Forecast - by Type
- 8.1.1. Dynamic Pumps
- 8.1.2. Positive Displacement Pumps
- 8.2. Market Analysis, Insights and Forecast - by Application
- 8.2.1. Upstream
- 8.2.2. Midstream
- 8.2.3. Downstream
- 8.1. Market Analysis, Insights and Forecast - by Type
- 9. Asia Pacific Oil & Gas Pump Market Analysis, Insights and Forecast, 2020-2032
- 9.1. Market Analysis, Insights and Forecast - by Type
- 9.1.1. Dynamic Pumps
- 9.1.2. Positive Displacement Pumps
- 9.2. Market Analysis, Insights and Forecast - by Application
- 9.2.1. Upstream
- 9.2.2. Midstream
- 9.2.3. Downstream
- 9.1. Market Analysis, Insights and Forecast - by Type
- 10. South America Oil & Gas Pump Market Analysis, Insights and Forecast, 2020-2032
- 10.1. Market Analysis, Insights and Forecast - by Type
- 10.1.1. Dynamic Pumps
- 10.1.2. Positive Displacement Pumps
- 10.2. Market Analysis, Insights and Forecast - by Application
- 10.2.1. Upstream
- 10.2.2. Midstream
- 10.2.3. Downstream
- 10.1. Market Analysis, Insights and Forecast - by Type
- 11. Middle East and Africa Oil & Gas Pump Market Analysis, Insights and Forecast, 2020-2032
- 11.1. Market Analysis, Insights and Forecast - by Type
- 11.1.1. Dynamic Pumps
- 11.1.2. Positive Displacement Pumps
- 11.2. Market Analysis, Insights and Forecast - by Application
- 11.2.1. Upstream
- 11.2.2. Midstream
- 11.2.3. Downstream
- 11.1. Market Analysis, Insights and Forecast - by Type
- 12. Competitive Analysis
- 12.1. Company Profiles
- 12.1.1 Flowserve Corporation
- 12.1.1.1. Company Overview
- 12.1.1.2. Products
- 12.1.1.3. Company Financials
- 12.1.1.4. SWOT Analysis
- 12.1.2 Weir Group PLC
- 12.1.2.1. Company Overview
- 12.1.2.2. Products
- 12.1.2.3. Company Financials
- 12.1.2.4. SWOT Analysis
- 12.1.3 Xylem Inc
- 12.1.3.1. Company Overview
- 12.1.3.2. Products
- 12.1.3.3. Company Financials
- 12.1.3.4. SWOT Analysis
- 12.1.4 Grundfos Holding A/S
- 12.1.4.1. Company Overview
- 12.1.4.2. Products
- 12.1.4.3. Company Financials
- 12.1.4.4. SWOT Analysis
- 12.1.5 KSB SE & Co KGaA
- 12.1.5.1. Company Overview
- 12.1.5.2. Products
- 12.1.5.3. Company Financials
- 12.1.5.4. SWOT Analysis
- 12.1.6 ITT Inc
- 12.1.6.1. Company Overview
- 12.1.6.2. Products
- 12.1.6.3. Company Financials
- 12.1.6.4. SWOT Analysis
- 12.1.7 Baker Hughes Co
- 12.1.7.1. Company Overview
- 12.1.7.2. Products
- 12.1.7.3. Company Financials
- 12.1.7.4. SWOT Analysis
- 12.1.8 Sulzer AG
- 12.1.8.1. Company Overview
- 12.1.8.2. Products
- 12.1.8.3. Company Financials
- 12.1.8.4. SWOT Analysis
- 12.1.9 Alfa Laval AB
- 12.1.9.1. Company Overview
- 12.1.9.2. Products
- 12.1.9.3. Company Financials
- 12.1.9.4. SWOT Analysis
- 12.1.10 Gardner Denver Holdings Inc
- 12.1.10.1. Company Overview
- 12.1.10.2. Products
- 12.1.10.3. Company Financials
- 12.1.10.4. SWOT Analysis
- 12.1.1 Flowserve Corporation
- 12.2. Market Entropy
- 12.2.1 Company's Key Areas Served
- 12.2.2 Recent Developments
- 12.3. Company Market Share Analysis 2025
- 12.3.1 Top 5 Companies Market Share Analysis
- 12.3.2 Top 3 Companies Market Share Analysis
- 12.4. List of Potential Customers
- 13. Research Methodology
List of Figures
- Figure 1: Global Oil & Gas Pump Market Revenue Breakdown (billion, %) by Region 2025 & 2033
- Figure 2: Global Oil & Gas Pump Market Volume Breakdown (K Units, %) by Region 2025 & 2033
- Figure 3: North America Oil & Gas Pump Market Revenue (billion), by Type 2025 & 2033
- Figure 4: North America Oil & Gas Pump Market Volume (K Units), by Type 2025 & 2033
- Figure 5: North America Oil & Gas Pump Market Revenue Share (%), by Type 2025 & 2033
- Figure 6: North America Oil & Gas Pump Market Volume Share (%), by Type 2025 & 2033
- Figure 7: North America Oil & Gas Pump Market Revenue (billion), by Application 2025 & 2033
- Figure 8: North America Oil & Gas Pump Market Volume (K Units), by Application 2025 & 2033
- Figure 9: North America Oil & Gas Pump Market Revenue Share (%), by Application 2025 & 2033
- Figure 10: North America Oil & Gas Pump Market Volume Share (%), by Application 2025 & 2033
- Figure 11: North America Oil & Gas Pump Market Revenue (billion), by Country 2025 & 2033
- Figure 12: North America Oil & Gas Pump Market Volume (K Units), by Country 2025 & 2033
- Figure 13: North America Oil & Gas Pump Market Revenue Share (%), by Country 2025 & 2033
- Figure 14: North America Oil & Gas Pump Market Volume Share (%), by Country 2025 & 2033
- Figure 15: Europe Oil & Gas Pump Market Revenue (billion), by Type 2025 & 2033
- Figure 16: Europe Oil & Gas Pump Market Volume (K Units), by Type 2025 & 2033
- Figure 17: Europe Oil & Gas Pump Market Revenue Share (%), by Type 2025 & 2033
- Figure 18: Europe Oil & Gas Pump Market Volume Share (%), by Type 2025 & 2033
- Figure 19: Europe Oil & Gas Pump Market Revenue (billion), by Application 2025 & 2033
- Figure 20: Europe Oil & Gas Pump Market Volume (K Units), by Application 2025 & 2033
- Figure 21: Europe Oil & Gas Pump Market Revenue Share (%), by Application 2025 & 2033
- Figure 22: Europe Oil & Gas Pump Market Volume Share (%), by Application 2025 & 2033
- Figure 23: Europe Oil & Gas Pump Market Revenue (billion), by Country 2025 & 2033
- Figure 24: Europe Oil & Gas Pump Market Volume (K Units), by Country 2025 & 2033
- Figure 25: Europe Oil & Gas Pump Market Revenue Share (%), by Country 2025 & 2033
- Figure 26: Europe Oil & Gas Pump Market Volume Share (%), by Country 2025 & 2033
- Figure 27: Asia Pacific Oil & Gas Pump Market Revenue (billion), by Type 2025 & 2033
- Figure 28: Asia Pacific Oil & Gas Pump Market Volume (K Units), by Type 2025 & 2033
- Figure 29: Asia Pacific Oil & Gas Pump Market Revenue Share (%), by Type 2025 & 2033
- Figure 30: Asia Pacific Oil & Gas Pump Market Volume Share (%), by Type 2025 & 2033
- Figure 31: Asia Pacific Oil & Gas Pump Market Revenue (billion), by Application 2025 & 2033
- Figure 32: Asia Pacific Oil & Gas Pump Market Volume (K Units), by Application 2025 & 2033
- Figure 33: Asia Pacific Oil & Gas Pump Market Revenue Share (%), by Application 2025 & 2033
- Figure 34: Asia Pacific Oil & Gas Pump Market Volume Share (%), by Application 2025 & 2033
- Figure 35: Asia Pacific Oil & Gas Pump Market Revenue (billion), by Country 2025 & 2033
- Figure 36: Asia Pacific Oil & Gas Pump Market Volume (K Units), by Country 2025 & 2033
- Figure 37: Asia Pacific Oil & Gas Pump Market Revenue Share (%), by Country 2025 & 2033
- Figure 38: Asia Pacific Oil & Gas Pump Market Volume Share (%), by Country 2025 & 2033
- Figure 39: South America Oil & Gas Pump Market Revenue (billion), by Type 2025 & 2033
- Figure 40: South America Oil & Gas Pump Market Volume (K Units), by Type 2025 & 2033
- Figure 41: South America Oil & Gas Pump Market Revenue Share (%), by Type 2025 & 2033
- Figure 42: South America Oil & Gas Pump Market Volume Share (%), by Type 2025 & 2033
- Figure 43: South America Oil & Gas Pump Market Revenue (billion), by Application 2025 & 2033
- Figure 44: South America Oil & Gas Pump Market Volume (K Units), by Application 2025 & 2033
- Figure 45: South America Oil & Gas Pump Market Revenue Share (%), by Application 2025 & 2033
- Figure 46: South America Oil & Gas Pump Market Volume Share (%), by Application 2025 & 2033
- Figure 47: South America Oil & Gas Pump Market Revenue (billion), by Country 2025 & 2033
- Figure 48: South America Oil & Gas Pump Market Volume (K Units), by Country 2025 & 2033
- Figure 49: South America Oil & Gas Pump Market Revenue Share (%), by Country 2025 & 2033
- Figure 50: South America Oil & Gas Pump Market Volume Share (%), by Country 2025 & 2033
- Figure 51: Middle East and Africa Oil & Gas Pump Market Revenue (billion), by Type 2025 & 2033
- Figure 52: Middle East and Africa Oil & Gas Pump Market Volume (K Units), by Type 2025 & 2033
- Figure 53: Middle East and Africa Oil & Gas Pump Market Revenue Share (%), by Type 2025 & 2033
- Figure 54: Middle East and Africa Oil & Gas Pump Market Volume Share (%), by Type 2025 & 2033
- Figure 55: Middle East and Africa Oil & Gas Pump Market Revenue (billion), by Application 2025 & 2033
- Figure 56: Middle East and Africa Oil & Gas Pump Market Volume (K Units), by Application 2025 & 2033
- Figure 57: Middle East and Africa Oil & Gas Pump Market Revenue Share (%), by Application 2025 & 2033
- Figure 58: Middle East and Africa Oil & Gas Pump Market Volume Share (%), by Application 2025 & 2033
- Figure 59: Middle East and Africa Oil & Gas Pump Market Revenue (billion), by Country 2025 & 2033
- Figure 60: Middle East and Africa Oil & Gas Pump Market Volume (K Units), by Country 2025 & 2033
- Figure 61: Middle East and Africa Oil & Gas Pump Market Revenue Share (%), by Country 2025 & 2033
- Figure 62: Middle East and Africa Oil & Gas Pump Market Volume Share (%), by Country 2025 & 2033
List of Tables
- Table 1: Global Oil & Gas Pump Market Revenue billion Forecast, by Type 2020 & 2033
- Table 2: Global Oil & Gas Pump Market Volume K Units Forecast, by Type 2020 & 2033
- Table 3: Global Oil & Gas Pump Market Revenue billion Forecast, by Application 2020 & 2033
- Table 4: Global Oil & Gas Pump Market Volume K Units Forecast, by Application 2020 & 2033
- Table 5: Global Oil & Gas Pump Market Revenue billion Forecast, by Region 2020 & 2033
- Table 6: Global Oil & Gas Pump Market Volume K Units Forecast, by Region 2020 & 2033
- Table 7: Global Oil & Gas Pump Market Revenue billion Forecast, by Type 2020 & 2033
- Table 8: Global Oil & Gas Pump Market Volume K Units Forecast, by Type 2020 & 2033
- Table 9: Global Oil & Gas Pump Market Revenue billion Forecast, by Application 2020 & 2033
- Table 10: Global Oil & Gas Pump Market Volume K Units Forecast, by Application 2020 & 2033
- Table 11: Global Oil & Gas Pump Market Revenue billion Forecast, by Country 2020 & 2033
- Table 12: Global Oil & Gas Pump Market Volume K Units Forecast, by Country 2020 & 2033
- Table 13: Global Oil & Gas Pump Market Revenue billion Forecast, by Type 2020 & 2033
- Table 14: Global Oil & Gas Pump Market Volume K Units Forecast, by Type 2020 & 2033
- Table 15: Global Oil & Gas Pump Market Revenue billion Forecast, by Application 2020 & 2033
- Table 16: Global Oil & Gas Pump Market Volume K Units Forecast, by Application 2020 & 2033
- Table 17: Global Oil & Gas Pump Market Revenue billion Forecast, by Country 2020 & 2033
- Table 18: Global Oil & Gas Pump Market Volume K Units Forecast, by Country 2020 & 2033
- Table 19: Global Oil & Gas Pump Market Revenue billion Forecast, by Type 2020 & 2033
- Table 20: Global Oil & Gas Pump Market Volume K Units Forecast, by Type 2020 & 2033
- Table 21: Global Oil & Gas Pump Market Revenue billion Forecast, by Application 2020 & 2033
- Table 22: Global Oil & Gas Pump Market Volume K Units Forecast, by Application 2020 & 2033
- Table 23: Global Oil & Gas Pump Market Revenue billion Forecast, by Country 2020 & 2033
- Table 24: Global Oil & Gas Pump Market Volume K Units Forecast, by Country 2020 & 2033
- Table 25: Global Oil & Gas Pump Market Revenue billion Forecast, by Type 2020 & 2033
- Table 26: Global Oil & Gas Pump Market Volume K Units Forecast, by Type 2020 & 2033
- Table 27: Global Oil & Gas Pump Market Revenue billion Forecast, by Application 2020 & 2033
- Table 28: Global Oil & Gas Pump Market Volume K Units Forecast, by Application 2020 & 2033
- Table 29: Global Oil & Gas Pump Market Revenue billion Forecast, by Country 2020 & 2033
- Table 30: Global Oil & Gas Pump Market Volume K Units Forecast, by Country 2020 & 2033
- Table 31: Global Oil & Gas Pump Market Revenue billion Forecast, by Type 2020 & 2033
- Table 32: Global Oil & Gas Pump Market Volume K Units Forecast, by Type 2020 & 2033
- Table 33: Global Oil & Gas Pump Market Revenue billion Forecast, by Application 2020 & 2033
- Table 34: Global Oil & Gas Pump Market Volume K Units Forecast, by Application 2020 & 2033
- Table 35: Global Oil & Gas Pump Market Revenue billion Forecast, by Country 2020 & 2033
- Table 36: Global Oil & Gas Pump Market Volume K Units Forecast, by Country 2020 & 2033
Frequently Asked Questions
1. What is the projected Compound Annual Growth Rate (CAGR) of the Oil & Gas Pump Market?
The projected CAGR is approximately 8.8%.
2. Which companies are prominent players in the Oil & Gas Pump Market?
Key companies in the market include Flowserve Corporation, Weir Group PLC, Xylem Inc, Grundfos Holding A/S, KSB SE & Co KGaA, ITT Inc, Baker Hughes Co, Sulzer AG, Alfa Laval AB, Gardner Denver Holdings Inc.
3. What are the main segments of the Oil & Gas Pump Market?
The market segments include Type, Application.
4. Can you provide details about the market size?
The market size is estimated to be USD 14.27 billion as of 2022.
5. What are some drivers contributing to market growth?
4.; Increasing Investments in Offshore Wind Power Projects4.; Supportive Government Policies.
6. What are the notable trends driving market growth?
Increasing Demand for Dynamic Pumps (Centrifugal pumps) from Refineries.
7. Are there any restraints impacting market growth?
4.; Increasing Adopting of Alternative Clean Energy Sources (Ex: Solar. Hydro).
8. Can you provide examples of recent developments in the market?
N/A
9. What pricing options are available for accessing the report?
Pricing options include single-user, multi-user, and enterprise licenses priced at USD 4750, USD 5250, and USD 8750 respectively.
10. Is the market size provided in terms of value or volume?
The market size is provided in terms of value, measured in billion and volume, measured in K Units.
11. Are there any specific market keywords associated with the report?
Yes, the market keyword associated with the report is "Oil & Gas Pump Market," which aids in identifying and referencing the specific market segment covered.
12. How do I determine which pricing option suits my needs best?
The pricing options vary based on user requirements and access needs. Individual users may opt for single-user licenses, while businesses requiring broader access may choose multi-user or enterprise licenses for cost-effective access to the report.
13. Are there any additional resources or data provided in the Oil & Gas Pump Market report?
While the report offers comprehensive insights, it's advisable to review the specific contents or supplementary materials provided to ascertain if additional resources or data are available.
14. How can I stay updated on further developments or reports in the Oil & Gas Pump Market?
To stay informed about further developments, trends, and reports in the Oil & Gas Pump Market, consider subscribing to industry newsletters, following relevant companies and organizations, or regularly checking reputable industry news sources and publications.
Methodology
Step 1 - Identification of Relevant Samples Size from Population Database


Step 2 - Approaches for Defining Global Market Size (Value, Volume* & Price*)

Note*: In applicable scenarios
Step 3 - Data Sources
Primary Research
- Web Analytics
- Survey Reports
- Research Institute
- Latest Research Reports
- Opinion Leaders
Secondary Research
- Annual Reports
- White Paper
- Latest Press Release
- Industry Association
- Paid Database
- Investor Presentations

Step 4 - Data Triangulation
Involves using different sources of information in order to increase the validity of a study
These sources are likely to be stakeholders in a program - participants, other researchers, program staff, other community members, and so on.
Then we put all data in single framework & apply various statistical tools to find out the dynamic on the market.
During the analysis stage, feedback from the stakeholder groups would be compared to determine areas of agreement as well as areas of divergence