

Key Insights
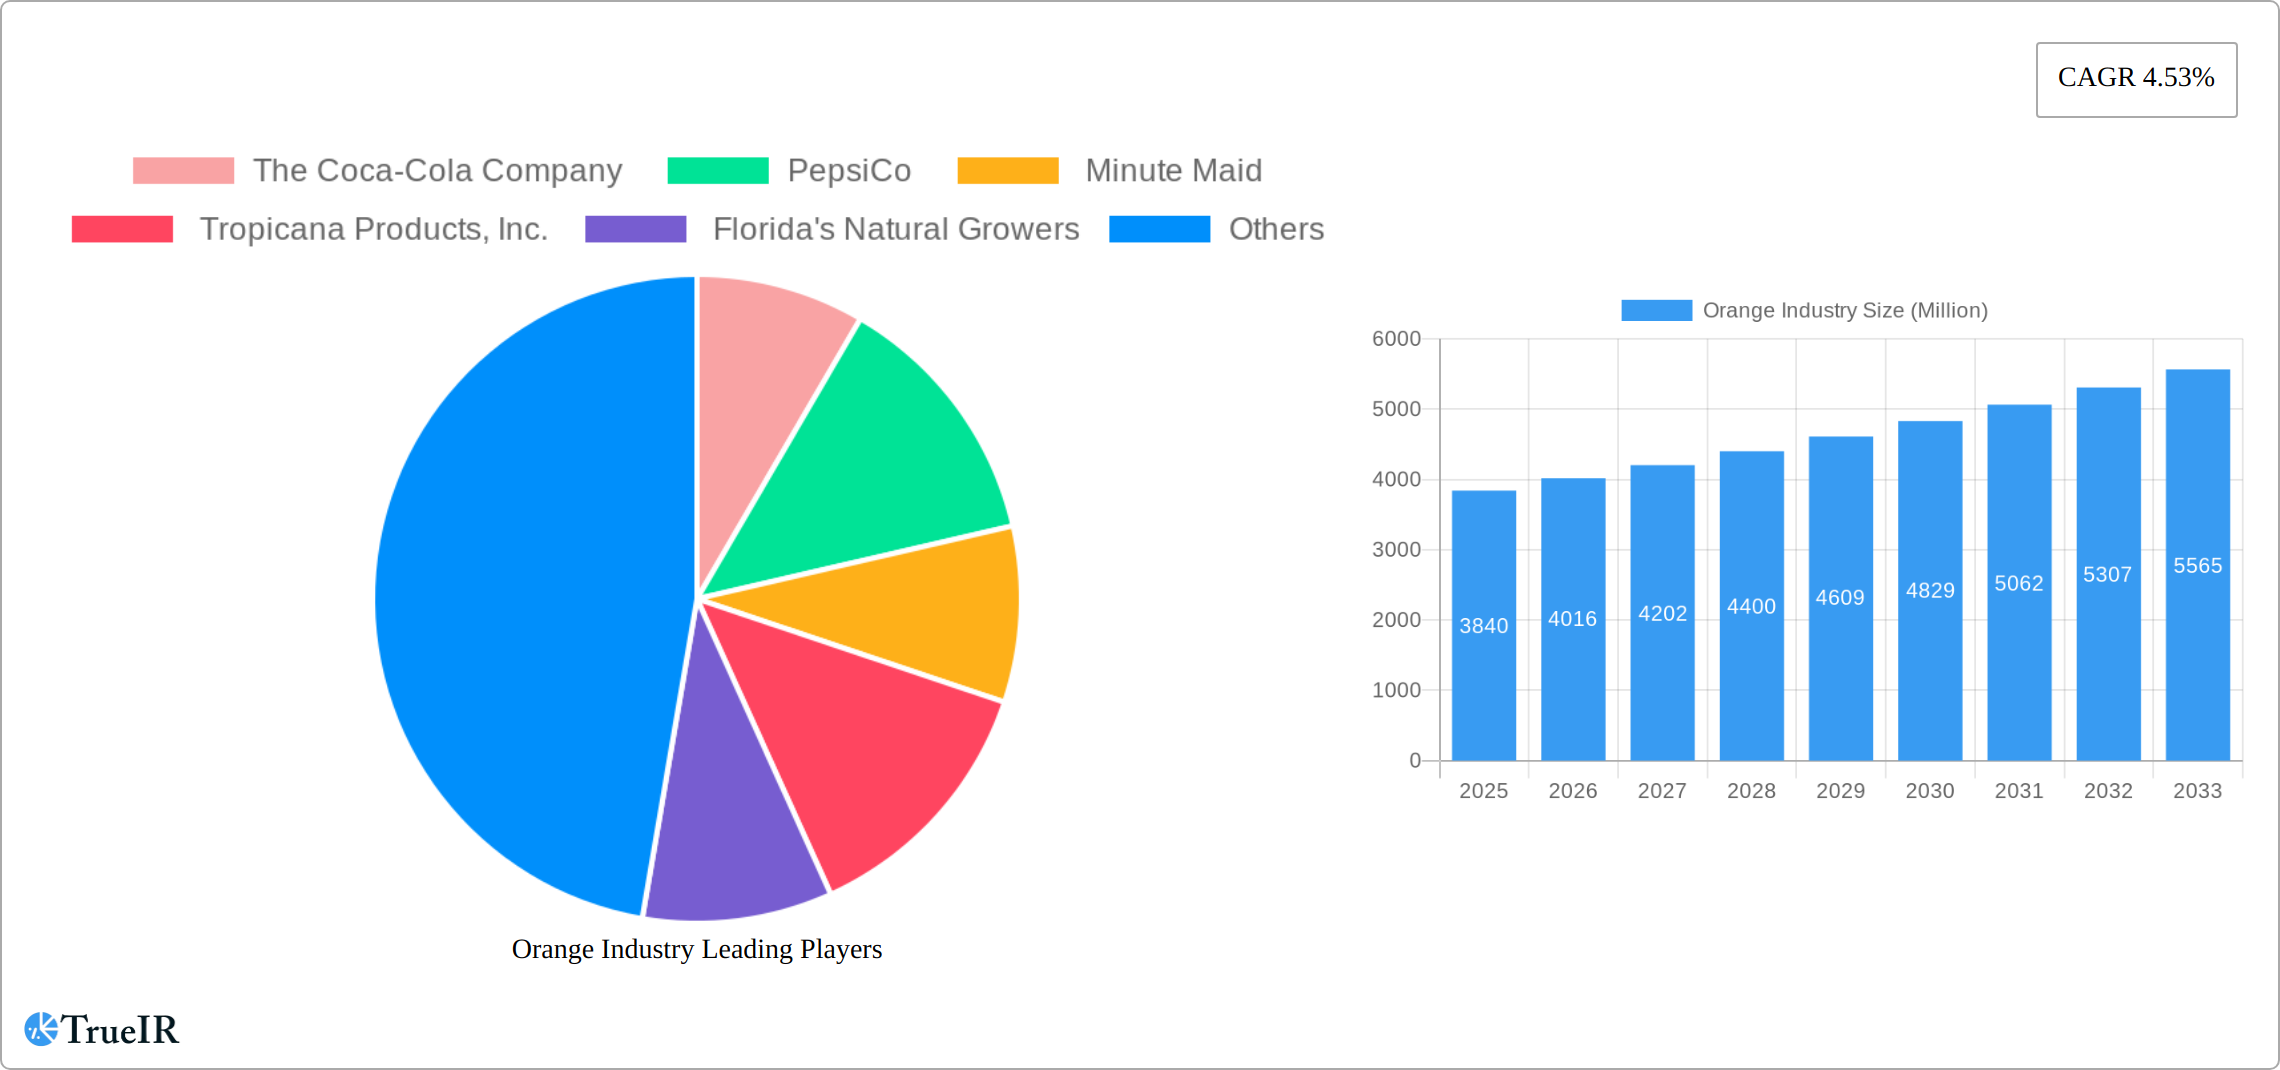
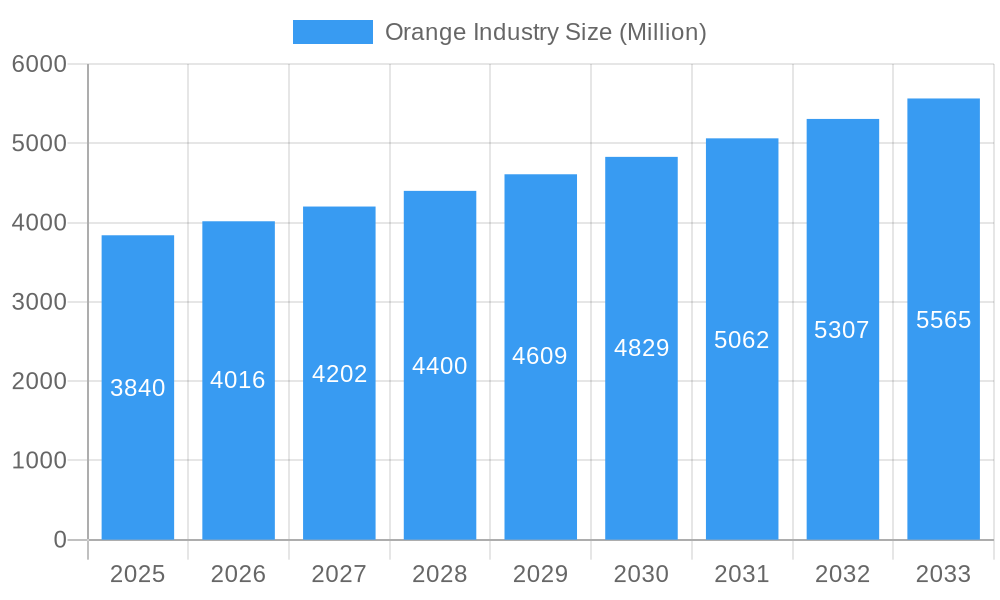
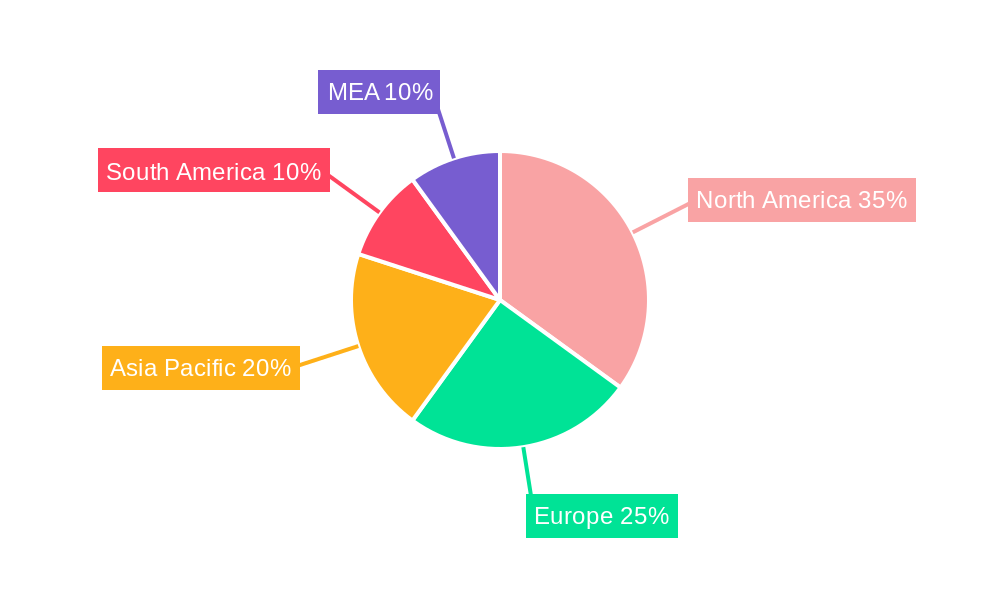
The global orange industry, valued at $3.84 billion in 2025, is projected to experience robust growth, driven by increasing consumer demand for fresh oranges, orange juice, and processed orange products. A Compound Annual Growth Rate (CAGR) of 4.53% from 2025 to 2033 indicates a significant expansion of the market. This growth is fueled by several factors. The rising popularity of healthy and nutritious beverages, including orange juice, is a major driver. Furthermore, the versatile nature of oranges, lending themselves to various applications in the food and beverage sectors, contributes significantly. Increasing health consciousness among consumers and the growing preference for natural and minimally processed foods further boost market expansion. The beverage industry remains the largest application segment, followed by food processing and direct consumption. Geographic distribution shows strong performance across North America, particularly the United States, driven by established production and consumption patterns. Europe and Asia-Pacific also represent significant market segments, with increasing demand from countries like China and India. However, fluctuations in orange production due to climatic conditions and pest infestations represent potential market restraints. Competition from other fruit juices and beverages also influences market growth. Major players, such as Coca-Cola, PepsiCo, Minute Maid, and Tropicana, leverage their extensive distribution networks and brand recognition to maintain market share. The industry is also marked by a growing trend towards sustainable and ethical sourcing practices, further shaping market dynamics.
Orange Industry Market Size (In Billion)
The segment breakdown shows considerable diversity within the orange industry. Fresh oranges retain a dominant share, followed by orange juice and concentrates. Frozen oranges cater to specific markets demanding convenience and extended shelf life. Orange peels are also utilized in various food and cosmetic products, adding a niche value stream. Regional variations are apparent, with North America showcasing higher per capita consumption compared to other regions. However, Asia-Pacific presents significant untapped potential, given its large population and growing middle class with increasing disposable incomes. Future growth will be driven by product innovation, such as functional orange beverages enriched with vitamins or antioxidants. Sustainability initiatives, focusing on reducing environmental impact and promoting ethical sourcing, will also play a key role in shaping the industry's trajectory. Overall, the orange industry is poised for substantial growth, reflecting the enduring appeal of this versatile and nutritious fruit.
Orange Industry Company Market Share
Dynamic Orange Industry Market Report: 2019-2033
This comprehensive report delivers an in-depth analysis of the global orange industry, projecting a vibrant future with significant growth opportunities. The report covers the period 2019-2033, with a focus on the year 2025, providing valuable insights for industry stakeholders, investors, and strategic decision-makers. We analyze market size, segmentation (by type and application), key players, competitive dynamics, and future trends across various regions, offering a complete picture of this dynamic sector. Expect detailed analysis of the orange juice market, orange concentrate market, and the broader orange industry value chain.
Orange Industry Market Structure & Competitive Landscape
This section analyzes the competitive landscape of the orange industry, examining market concentration, innovation drivers, regulatory influences, and industry dynamics. We explore the impact of mergers and acquisitions (M&A) activity, highlighting key strategic shifts. The report estimates the market concentration ratio to be around xx% in 2025, indicating a moderately concentrated market.
Market Concentration: The global orange market is characterized by the presence of several large players, including The Coca-Cola Company, PepsiCo, Minute Maid, Tropicana Products, Inc., and Florida's Natural Growers. These companies exert significant influence over pricing, distribution, and innovation. However, smaller regional players and emerging brands are also contributing to market dynamism.
Innovation Drivers: Ongoing R&D efforts focusing on improved processing techniques, enhanced product varieties (e.g., organic oranges, functional juices), and sustainable packaging solutions are driving innovation in the orange industry.
Regulatory Impacts: Government regulations concerning food safety, labeling requirements, and environmental standards influence industry practices and operational costs. These regulations, while crucial for consumer safety, can also introduce challenges for market participants.
Product Substitutes: The orange industry faces competition from other fruit juices, beverages, and healthy alternatives. The growing popularity of other fruit juices and health drinks influences consumer preferences, affecting the overall market share of orange-based products.
End-User Segmentation: The primary end-user segments are the beverage industry, food processing sector, and direct consumers. Each segment presents unique opportunities and challenges.
M&A Trends: The volume of M&A activity in the orange industry has fluctuated in recent years. We estimate that approximately xx million USD worth of M&A transactions were recorded between 2019 and 2024. These activities reflect consolidation trends and strategic expansion efforts by major players.
Orange Industry Market Trends & Opportunities
The global orange industry is experiencing dynamic growth, driven by a confluence of factors shaping market trends and presenting lucrative opportunities. Projected to achieve a Compound Annual Growth Rate (CAGR) of [Insert Projected CAGR]% during the forecast period (2025-2033), the market is poised to reach a value of [Insert Projected Market Value in USD Million] by 2033. This expansion is particularly notable in emerging markets, where penetration rates are steadily increasing. Key factors influencing this growth include technological advancements in processing and preservation, leading to enhanced product quality and efficiency; a rising consumer preference for healthier, convenient food and beverage options stimulating innovation; and the increasing importance of sustainable sourcing and ethical production practices within the supply chain.
The competitive landscape is highly dynamic, characterized by significant investments in research and development, marketing strategies, and new product development. Companies are focusing on product differentiation, brand building, and meeting the growing demand for environmentally friendly packaging. This section provides a detailed analysis of these evolving trends, identifying specific opportunities for growth within various market segments and geographic regions.
Dominant Markets & Segments in Orange Industry
The global orange industry is geographically diverse, with certain regions and countries exhibiting stronger market dominance based on production and consumption data. Currently, the [Insert Region] region holds the leading position in the global market, with [Insert Country] emerging as a key player. This leadership is attributed to a combination of factors, including favorable climatic conditions, established agricultural infrastructure, and effective government policies supporting the industry.
By Type:
- Fresh Oranges: The fresh orange segment continues to experience robust growth, fueled by increasing consumer demand for fresh produce, improvements in farming techniques, and favorable climatic conditions in major producing areas. Premium varieties and organic options are driving further market segmentation.
- Frozen Oranges: This segment provides extended shelf life and is a crucial ingredient in various processed foods, contributing to its consistent market demand.
- Orange Juice: Orange juice remains a cornerstone product category, benefiting from established distribution channels and a large consumer base. Innovations in packaging and flavor profiles are helping maintain its popularity.
- Orange Concentrates: The concentration of orange juice provides cost-effectiveness and convenience, making it a vital component for the beverage industry and food manufacturers.
- Orange Peels: The increasing utilization of orange peels in food and cosmetics, driven by demand for natural ingredients, represents a significant growth area within the industry.
By Application:
- Beverage Industry: The beverage industry remains the largest application segment for oranges, with orange juice and orange-flavored beverages contributing significantly to market volume.
- Food Processing: Oranges and their derivatives are widely used as ingredients in confectionery, bakery goods, and a broad range of processed food products.
- Direct Consumption: Growing awareness of oranges' health benefits fuels direct consumption, especially among health-conscious consumers who appreciate their vitamin C content and other nutritional values.
Key Growth Drivers:
- Favorable climatic conditions in major orange-producing regions.
- Government initiatives supporting agricultural development and export promotion.
- The escalating consumer preference for healthier beverage options.
- Increased demand for convenient and ready-to-consume food products.
- Expansion into new markets and diversification of product offerings.
Orange Industry Product Analysis
The orange industry encompasses a diverse range of products, from fresh fruit to processed juice and concentrates. Continuous advancements in processing and packaging technologies enhance the quality, shelf life, and convenience of orange products, driving market penetration across various consumer segments. Sustainability is a key focus, with companies increasingly adopting eco-friendly packaging materials to meet consumer demand for environmentally conscious choices. The competitive landscape remains dynamic, with companies constantly innovating to create unique product offerings and build strong brand recognition.
Key Drivers, Barriers & Challenges in Orange Industry
Key Drivers:
- Increasing consumer demand for healthy beverages and snacks
- Technological advancements in processing and preservation techniques, leading to higher yields and improved product quality
- Favorable government policies supporting agricultural development and exports
Challenges and Restraints:
- Fluctuations in orange yields due to weather patterns and diseases
- Intense competition from substitute products and other fruit juices
- Rising costs of raw materials, packaging, and transportation
- Stringent food safety and quality regulations
- Supply chain disruptions and logistical challenges
Growth Drivers in the Orange Industry Market
The orange industry’s growth is fueled by several factors, including rising health consciousness (boosting demand for fresh and processed orange products), innovation in processing technologies (improving efficiency and reducing waste), and expanding global trade (opening new markets for orange producers). Government initiatives to support agricultural growth and export promotion provide additional impetus.
Challenges Impacting Orange Industry Growth
Challenges facing the orange industry include climate change impacts on orange production, increasing input costs, and stiff competition from substitute products. Supply chain vulnerabilities and regulatory hurdles further complicate the landscape. These factors can negatively impact production volumes and profitability if not effectively managed.
Key Players Shaping the Orange Industry Market
- The Coca-Cola Company
- PepsiCo
- Minute Maid
- Tropicana Products, Inc.
- Florida's Natural Growers
- [Add other key players as needed]
Significant Orange Industry Industry Milestones
- May 2022: An agreement to increase orange exports from USD 61.2 million to USD 612.0 million through organic farming and improved hybrids was signed. This highlights a major push for export expansion.
- September 2022: Virtue Clean Energy launched an orange-flavored energy drink, showcasing product innovation in the broader beverage market and expanding orange's application beyond traditional juice.
- November 2022: The first export of Arunachal Pradesh oranges to the UAE and Qatar demonstrates market expansion into new regions.
Future Outlook for Orange Industry Market
The future of the orange industry appears promising, driven by continued consumer demand, technological advancements, and expansion into new markets. Strategic partnerships, product diversification, and sustainability initiatives will play key roles in shaping the industry's growth trajectory. The industry's ability to adapt to challenges and innovate will determine its overall success in the coming decade.
Orange Industry Segmentation
- 1. Production Analysis
- 2. Consumption Analysis
- 3. Import Market Analysis (Value & Volume)
- 4. Export Market Analysis (Value & Volume)
- 5. Price Trend Analysis
Orange Industry Segmentation By Geography
- 1. Brazil
- 2. China
- 3. India
- 4. Mexico
- 5. United States
- 6. European Union
- 7. Egypt
- 8. South Africa
- 9. Indonesia
- 10. Turkey
Orange Industry Regional Market Share
Geographic Coverage of Orange Industry
Orange Industry REPORT HIGHLIGHTS
| Aspects | Details |
|---|---|
| Study Period | 2020-2034 |
| Base Year | 2025 |
| Estimated Year | 2026 |
| Forecast Period | 2026-2034 |
| Historical Period | 2020-2025 |
| Growth Rate | CAGR of 4.53% from 2020-2034 |
| Segmentation |
|
Table of Contents
- 1. Introduction
- 1.1. Research Scope
- 1.2. Market Segmentation
- 1.3. Research Methodology
- 1.4. Definitions and Assumptions
- 2. Executive Summary
- 2.1. Introduction
- 3. Market Dynamics
- 3.1. Introduction
- 3.2. Market Drivers
- 3.2.1. Rising Consumption of Cashew Nuts as a Healthy Snack; Increasing Government initiatives; Growing Cashew Nut Imports in The United States
- 3.3. Market Restrains
- 3.3.1. Hazardous Climatic Condition Hinders Cashew Production; Stringent Regulations Related To Food Quality Standards
- 3.4. Market Trends
- 3.4.1. Growing Seasonal Consumption of Orange
- 4. Market Factor Analysis
- 4.1. Porters Five Forces
- 4.2. Supply/Value Chain
- 4.3. PESTEL analysis
- 4.4. Market Entropy
- 4.5. Patent/Trademark Analysis
- 5. Global Orange Industry Analysis, Insights and Forecast, 2020-2032
- 5.1. Market Analysis, Insights and Forecast - by Production Analysis
- 5.2. Market Analysis, Insights and Forecast - by Consumption Analysis
- 5.3. Market Analysis, Insights and Forecast - by Import Market Analysis (Value & Volume)
- 5.4. Market Analysis, Insights and Forecast - by Export Market Analysis (Value & Volume)
- 5.5. Market Analysis, Insights and Forecast - by Price Trend Analysis
- 5.6. Market Analysis, Insights and Forecast - by Region
- 5.6.1. Brazil
- 5.6.2. China
- 5.6.3. India
- 5.6.4. Mexico
- 5.6.5. United States
- 5.6.6. European Union
- 5.6.7. Egypt
- 5.6.8. South Africa
- 5.6.9. Indonesia
- 5.6.10. Turkey
- 5.1. Market Analysis, Insights and Forecast - by Production Analysis
- 6. Brazil Orange Industry Analysis, Insights and Forecast, 2020-2032
- 6.1. Market Analysis, Insights and Forecast - by Production Analysis
- 6.2. Market Analysis, Insights and Forecast - by Consumption Analysis
- 6.3. Market Analysis, Insights and Forecast - by Import Market Analysis (Value & Volume)
- 6.4. Market Analysis, Insights and Forecast - by Export Market Analysis (Value & Volume)
- 6.5. Market Analysis, Insights and Forecast - by Price Trend Analysis
- 6.1. Market Analysis, Insights and Forecast - by Production Analysis
- 7. China Orange Industry Analysis, Insights and Forecast, 2020-2032
- 7.1. Market Analysis, Insights and Forecast - by Production Analysis
- 7.2. Market Analysis, Insights and Forecast - by Consumption Analysis
- 7.3. Market Analysis, Insights and Forecast - by Import Market Analysis (Value & Volume)
- 7.4. Market Analysis, Insights and Forecast - by Export Market Analysis (Value & Volume)
- 7.5. Market Analysis, Insights and Forecast - by Price Trend Analysis
- 7.1. Market Analysis, Insights and Forecast - by Production Analysis
- 8. India Orange Industry Analysis, Insights and Forecast, 2020-2032
- 8.1. Market Analysis, Insights and Forecast - by Production Analysis
- 8.2. Market Analysis, Insights and Forecast - by Consumption Analysis
- 8.3. Market Analysis, Insights and Forecast - by Import Market Analysis (Value & Volume)
- 8.4. Market Analysis, Insights and Forecast - by Export Market Analysis (Value & Volume)
- 8.5. Market Analysis, Insights and Forecast - by Price Trend Analysis
- 8.1. Market Analysis, Insights and Forecast - by Production Analysis
- 9. Mexico Orange Industry Analysis, Insights and Forecast, 2020-2032
- 9.1. Market Analysis, Insights and Forecast - by Production Analysis
- 9.2. Market Analysis, Insights and Forecast - by Consumption Analysis
- 9.3. Market Analysis, Insights and Forecast - by Import Market Analysis (Value & Volume)
- 9.4. Market Analysis, Insights and Forecast - by Export Market Analysis (Value & Volume)
- 9.5. Market Analysis, Insights and Forecast - by Price Trend Analysis
- 9.1. Market Analysis, Insights and Forecast - by Production Analysis
- 10. United States Orange Industry Analysis, Insights and Forecast, 2020-2032
- 10.1. Market Analysis, Insights and Forecast - by Production Analysis
- 10.2. Market Analysis, Insights and Forecast - by Consumption Analysis
- 10.3. Market Analysis, Insights and Forecast - by Import Market Analysis (Value & Volume)
- 10.4. Market Analysis, Insights and Forecast - by Export Market Analysis (Value & Volume)
- 10.5. Market Analysis, Insights and Forecast - by Price Trend Analysis
- 10.1. Market Analysis, Insights and Forecast - by Production Analysis
- 11. European Union Orange Industry Analysis, Insights and Forecast, 2020-2032
- 11.1. Market Analysis, Insights and Forecast - by Production Analysis
- 11.2. Market Analysis, Insights and Forecast - by Consumption Analysis
- 11.3. Market Analysis, Insights and Forecast - by Import Market Analysis (Value & Volume)
- 11.4. Market Analysis, Insights and Forecast - by Export Market Analysis (Value & Volume)
- 11.5. Market Analysis, Insights and Forecast - by Price Trend Analysis
- 11.1. Market Analysis, Insights and Forecast - by Production Analysis
- 12. Egypt Orange Industry Analysis, Insights and Forecast, 2020-2032
- 12.1. Market Analysis, Insights and Forecast - by Production Analysis
- 12.2. Market Analysis, Insights and Forecast - by Consumption Analysis
- 12.3. Market Analysis, Insights and Forecast - by Import Market Analysis (Value & Volume)
- 12.4. Market Analysis, Insights and Forecast - by Export Market Analysis (Value & Volume)
- 12.5. Market Analysis, Insights and Forecast - by Price Trend Analysis
- 12.1. Market Analysis, Insights and Forecast - by Production Analysis
- 13. South Africa Orange Industry Analysis, Insights and Forecast, 2020-2032
- 13.1. Market Analysis, Insights and Forecast - by Production Analysis
- 13.2. Market Analysis, Insights and Forecast - by Consumption Analysis
- 13.3. Market Analysis, Insights and Forecast - by Import Market Analysis (Value & Volume)
- 13.4. Market Analysis, Insights and Forecast - by Export Market Analysis (Value & Volume)
- 13.5. Market Analysis, Insights and Forecast - by Price Trend Analysis
- 13.1. Market Analysis, Insights and Forecast - by Production Analysis
- 14. Indonesia Orange Industry Analysis, Insights and Forecast, 2020-2032
- 14.1. Market Analysis, Insights and Forecast - by Production Analysis
- 14.2. Market Analysis, Insights and Forecast - by Consumption Analysis
- 14.3. Market Analysis, Insights and Forecast - by Import Market Analysis (Value & Volume)
- 14.4. Market Analysis, Insights and Forecast - by Export Market Analysis (Value & Volume)
- 14.5. Market Analysis, Insights and Forecast - by Price Trend Analysis
- 14.1. Market Analysis, Insights and Forecast - by Production Analysis
- 15. Turkey Orange Industry Analysis, Insights and Forecast, 2020-2032
- 15.1. Market Analysis, Insights and Forecast - by Production Analysis
- 15.2. Market Analysis, Insights and Forecast - by Consumption Analysis
- 15.3. Market Analysis, Insights and Forecast - by Import Market Analysis (Value & Volume)
- 15.4. Market Analysis, Insights and Forecast - by Export Market Analysis (Value & Volume)
- 15.5. Market Analysis, Insights and Forecast - by Price Trend Analysis
- 15.1. Market Analysis, Insights and Forecast - by Production Analysis
- 16. Competitive Analysis
- 16.1. Global Market Share Analysis 2025
- 16.2. Company Profiles
- 16.2.1 The Coca-Cola Company
- 16.2.1.1. Overview
- 16.2.1.2. Products
- 16.2.1.3. SWOT Analysis
- 16.2.1.4. Recent Developments
- 16.2.1.5. Financials (Based on Availability)
- 16.2.2 PepsiCo
- 16.2.2.1. Overview
- 16.2.2.2. Products
- 16.2.2.3. SWOT Analysis
- 16.2.2.4. Recent Developments
- 16.2.2.5. Financials (Based on Availability)
- 16.2.3 Minute Maid
- 16.2.3.1. Overview
- 16.2.3.2. Products
- 16.2.3.3. SWOT Analysis
- 16.2.3.4. Recent Developments
- 16.2.3.5. Financials (Based on Availability)
- 16.2.4 Tropicana Products Inc.
- 16.2.4.1. Overview
- 16.2.4.2. Products
- 16.2.4.3. SWOT Analysis
- 16.2.4.4. Recent Developments
- 16.2.4.5. Financials (Based on Availability)
- 16.2.5 Florida's Natural Growers
- 16.2.5.1. Overview
- 16.2.5.2. Products
- 16.2.5.3. SWOT Analysis
- 16.2.5.4. Recent Developments
- 16.2.5.5. Financials (Based on Availability)
- 16.2.1 The Coca-Cola Company
List of Figures
- Figure 1: Global Orange Industry Revenue Breakdown (Million, %) by Region 2025 & 2033
- Figure 2: Global Orange Industry Volume Breakdown (Kiloton, %) by Region 2025 & 2033
- Figure 3: Brazil Orange Industry Revenue (Million), by Production Analysis 2025 & 2033
- Figure 4: Brazil Orange Industry Volume (Kiloton), by Production Analysis 2025 & 2033
- Figure 5: Brazil Orange Industry Revenue Share (%), by Production Analysis 2025 & 2033
- Figure 6: Brazil Orange Industry Volume Share (%), by Production Analysis 2025 & 2033
- Figure 7: Brazil Orange Industry Revenue (Million), by Consumption Analysis 2025 & 2033
- Figure 8: Brazil Orange Industry Volume (Kiloton), by Consumption Analysis 2025 & 2033
- Figure 9: Brazil Orange Industry Revenue Share (%), by Consumption Analysis 2025 & 2033
- Figure 10: Brazil Orange Industry Volume Share (%), by Consumption Analysis 2025 & 2033
- Figure 11: Brazil Orange Industry Revenue (Million), by Import Market Analysis (Value & Volume) 2025 & 2033
- Figure 12: Brazil Orange Industry Volume (Kiloton), by Import Market Analysis (Value & Volume) 2025 & 2033
- Figure 13: Brazil Orange Industry Revenue Share (%), by Import Market Analysis (Value & Volume) 2025 & 2033
- Figure 14: Brazil Orange Industry Volume Share (%), by Import Market Analysis (Value & Volume) 2025 & 2033
- Figure 15: Brazil Orange Industry Revenue (Million), by Export Market Analysis (Value & Volume) 2025 & 2033
- Figure 16: Brazil Orange Industry Volume (Kiloton), by Export Market Analysis (Value & Volume) 2025 & 2033
- Figure 17: Brazil Orange Industry Revenue Share (%), by Export Market Analysis (Value & Volume) 2025 & 2033
- Figure 18: Brazil Orange Industry Volume Share (%), by Export Market Analysis (Value & Volume) 2025 & 2033
- Figure 19: Brazil Orange Industry Revenue (Million), by Price Trend Analysis 2025 & 2033
- Figure 20: Brazil Orange Industry Volume (Kiloton), by Price Trend Analysis 2025 & 2033
- Figure 21: Brazil Orange Industry Revenue Share (%), by Price Trend Analysis 2025 & 2033
- Figure 22: Brazil Orange Industry Volume Share (%), by Price Trend Analysis 2025 & 2033
- Figure 23: Brazil Orange Industry Revenue (Million), by Country 2025 & 2033
- Figure 24: Brazil Orange Industry Volume (Kiloton), by Country 2025 & 2033
- Figure 25: Brazil Orange Industry Revenue Share (%), by Country 2025 & 2033
- Figure 26: Brazil Orange Industry Volume Share (%), by Country 2025 & 2033
- Figure 27: China Orange Industry Revenue (Million), by Production Analysis 2025 & 2033
- Figure 28: China Orange Industry Volume (Kiloton), by Production Analysis 2025 & 2033
- Figure 29: China Orange Industry Revenue Share (%), by Production Analysis 2025 & 2033
- Figure 30: China Orange Industry Volume Share (%), by Production Analysis 2025 & 2033
- Figure 31: China Orange Industry Revenue (Million), by Consumption Analysis 2025 & 2033
- Figure 32: China Orange Industry Volume (Kiloton), by Consumption Analysis 2025 & 2033
- Figure 33: China Orange Industry Revenue Share (%), by Consumption Analysis 2025 & 2033
- Figure 34: China Orange Industry Volume Share (%), by Consumption Analysis 2025 & 2033
- Figure 35: China Orange Industry Revenue (Million), by Import Market Analysis (Value & Volume) 2025 & 2033
- Figure 36: China Orange Industry Volume (Kiloton), by Import Market Analysis (Value & Volume) 2025 & 2033
- Figure 37: China Orange Industry Revenue Share (%), by Import Market Analysis (Value & Volume) 2025 & 2033
- Figure 38: China Orange Industry Volume Share (%), by Import Market Analysis (Value & Volume) 2025 & 2033
- Figure 39: China Orange Industry Revenue (Million), by Export Market Analysis (Value & Volume) 2025 & 2033
- Figure 40: China Orange Industry Volume (Kiloton), by Export Market Analysis (Value & Volume) 2025 & 2033
- Figure 41: China Orange Industry Revenue Share (%), by Export Market Analysis (Value & Volume) 2025 & 2033
- Figure 42: China Orange Industry Volume Share (%), by Export Market Analysis (Value & Volume) 2025 & 2033
- Figure 43: China Orange Industry Revenue (Million), by Price Trend Analysis 2025 & 2033
- Figure 44: China Orange Industry Volume (Kiloton), by Price Trend Analysis 2025 & 2033
- Figure 45: China Orange Industry Revenue Share (%), by Price Trend Analysis 2025 & 2033
- Figure 46: China Orange Industry Volume Share (%), by Price Trend Analysis 2025 & 2033
- Figure 47: China Orange Industry Revenue (Million), by Country 2025 & 2033
- Figure 48: China Orange Industry Volume (Kiloton), by Country 2025 & 2033
- Figure 49: China Orange Industry Revenue Share (%), by Country 2025 & 2033
- Figure 50: China Orange Industry Volume Share (%), by Country 2025 & 2033
- Figure 51: India Orange Industry Revenue (Million), by Production Analysis 2025 & 2033
- Figure 52: India Orange Industry Volume (Kiloton), by Production Analysis 2025 & 2033
- Figure 53: India Orange Industry Revenue Share (%), by Production Analysis 2025 & 2033
- Figure 54: India Orange Industry Volume Share (%), by Production Analysis 2025 & 2033
- Figure 55: India Orange Industry Revenue (Million), by Consumption Analysis 2025 & 2033
- Figure 56: India Orange Industry Volume (Kiloton), by Consumption Analysis 2025 & 2033
- Figure 57: India Orange Industry Revenue Share (%), by Consumption Analysis 2025 & 2033
- Figure 58: India Orange Industry Volume Share (%), by Consumption Analysis 2025 & 2033
- Figure 59: India Orange Industry Revenue (Million), by Import Market Analysis (Value & Volume) 2025 & 2033
- Figure 60: India Orange Industry Volume (Kiloton), by Import Market Analysis (Value & Volume) 2025 & 2033
- Figure 61: India Orange Industry Revenue Share (%), by Import Market Analysis (Value & Volume) 2025 & 2033
- Figure 62: India Orange Industry Volume Share (%), by Import Market Analysis (Value & Volume) 2025 & 2033
- Figure 63: India Orange Industry Revenue (Million), by Export Market Analysis (Value & Volume) 2025 & 2033
- Figure 64: India Orange Industry Volume (Kiloton), by Export Market Analysis (Value & Volume) 2025 & 2033
- Figure 65: India Orange Industry Revenue Share (%), by Export Market Analysis (Value & Volume) 2025 & 2033
- Figure 66: India Orange Industry Volume Share (%), by Export Market Analysis (Value & Volume) 2025 & 2033
- Figure 67: India Orange Industry Revenue (Million), by Price Trend Analysis 2025 & 2033
- Figure 68: India Orange Industry Volume (Kiloton), by Price Trend Analysis 2025 & 2033
- Figure 69: India Orange Industry Revenue Share (%), by Price Trend Analysis 2025 & 2033
- Figure 70: India Orange Industry Volume Share (%), by Price Trend Analysis 2025 & 2033
- Figure 71: India Orange Industry Revenue (Million), by Country 2025 & 2033
- Figure 72: India Orange Industry Volume (Kiloton), by Country 2025 & 2033
- Figure 73: India Orange Industry Revenue Share (%), by Country 2025 & 2033
- Figure 74: India Orange Industry Volume Share (%), by Country 2025 & 2033
- Figure 75: Mexico Orange Industry Revenue (Million), by Production Analysis 2025 & 2033
- Figure 76: Mexico Orange Industry Volume (Kiloton), by Production Analysis 2025 & 2033
- Figure 77: Mexico Orange Industry Revenue Share (%), by Production Analysis 2025 & 2033
- Figure 78: Mexico Orange Industry Volume Share (%), by Production Analysis 2025 & 2033
- Figure 79: Mexico Orange Industry Revenue (Million), by Consumption Analysis 2025 & 2033
- Figure 80: Mexico Orange Industry Volume (Kiloton), by Consumption Analysis 2025 & 2033
- Figure 81: Mexico Orange Industry Revenue Share (%), by Consumption Analysis 2025 & 2033
- Figure 82: Mexico Orange Industry Volume Share (%), by Consumption Analysis 2025 & 2033
- Figure 83: Mexico Orange Industry Revenue (Million), by Import Market Analysis (Value & Volume) 2025 & 2033
- Figure 84: Mexico Orange Industry Volume (Kiloton), by Import Market Analysis (Value & Volume) 2025 & 2033
- Figure 85: Mexico Orange Industry Revenue Share (%), by Import Market Analysis (Value & Volume) 2025 & 2033
- Figure 86: Mexico Orange Industry Volume Share (%), by Import Market Analysis (Value & Volume) 2025 & 2033
- Figure 87: Mexico Orange Industry Revenue (Million), by Export Market Analysis (Value & Volume) 2025 & 2033
- Figure 88: Mexico Orange Industry Volume (Kiloton), by Export Market Analysis (Value & Volume) 2025 & 2033
- Figure 89: Mexico Orange Industry Revenue Share (%), by Export Market Analysis (Value & Volume) 2025 & 2033
- Figure 90: Mexico Orange Industry Volume Share (%), by Export Market Analysis (Value & Volume) 2025 & 2033
- Figure 91: Mexico Orange Industry Revenue (Million), by Price Trend Analysis 2025 & 2033
- Figure 92: Mexico Orange Industry Volume (Kiloton), by Price Trend Analysis 2025 & 2033
- Figure 93: Mexico Orange Industry Revenue Share (%), by Price Trend Analysis 2025 & 2033
- Figure 94: Mexico Orange Industry Volume Share (%), by Price Trend Analysis 2025 & 2033
- Figure 95: Mexico Orange Industry Revenue (Million), by Country 2025 & 2033
- Figure 96: Mexico Orange Industry Volume (Kiloton), by Country 2025 & 2033
- Figure 97: Mexico Orange Industry Revenue Share (%), by Country 2025 & 2033
- Figure 98: Mexico Orange Industry Volume Share (%), by Country 2025 & 2033
- Figure 99: United States Orange Industry Revenue (Million), by Production Analysis 2025 & 2033
- Figure 100: United States Orange Industry Volume (Kiloton), by Production Analysis 2025 & 2033
- Figure 101: United States Orange Industry Revenue Share (%), by Production Analysis 2025 & 2033
- Figure 102: United States Orange Industry Volume Share (%), by Production Analysis 2025 & 2033
- Figure 103: United States Orange Industry Revenue (Million), by Consumption Analysis 2025 & 2033
- Figure 104: United States Orange Industry Volume (Kiloton), by Consumption Analysis 2025 & 2033
- Figure 105: United States Orange Industry Revenue Share (%), by Consumption Analysis 2025 & 2033
- Figure 106: United States Orange Industry Volume Share (%), by Consumption Analysis 2025 & 2033
- Figure 107: United States Orange Industry Revenue (Million), by Import Market Analysis (Value & Volume) 2025 & 2033
- Figure 108: United States Orange Industry Volume (Kiloton), by Import Market Analysis (Value & Volume) 2025 & 2033
- Figure 109: United States Orange Industry Revenue Share (%), by Import Market Analysis (Value & Volume) 2025 & 2033
- Figure 110: United States Orange Industry Volume Share (%), by Import Market Analysis (Value & Volume) 2025 & 2033
- Figure 111: United States Orange Industry Revenue (Million), by Export Market Analysis (Value & Volume) 2025 & 2033
- Figure 112: United States Orange Industry Volume (Kiloton), by Export Market Analysis (Value & Volume) 2025 & 2033
- Figure 113: United States Orange Industry Revenue Share (%), by Export Market Analysis (Value & Volume) 2025 & 2033
- Figure 114: United States Orange Industry Volume Share (%), by Export Market Analysis (Value & Volume) 2025 & 2033
- Figure 115: United States Orange Industry Revenue (Million), by Price Trend Analysis 2025 & 2033
- Figure 116: United States Orange Industry Volume (Kiloton), by Price Trend Analysis 2025 & 2033
- Figure 117: United States Orange Industry Revenue Share (%), by Price Trend Analysis 2025 & 2033
- Figure 118: United States Orange Industry Volume Share (%), by Price Trend Analysis 2025 & 2033
- Figure 119: United States Orange Industry Revenue (Million), by Country 2025 & 2033
- Figure 120: United States Orange Industry Volume (Kiloton), by Country 2025 & 2033
- Figure 121: United States Orange Industry Revenue Share (%), by Country 2025 & 2033
- Figure 122: United States Orange Industry Volume Share (%), by Country 2025 & 2033
- Figure 123: European Union Orange Industry Revenue (Million), by Production Analysis 2025 & 2033
- Figure 124: European Union Orange Industry Volume (Kiloton), by Production Analysis 2025 & 2033
- Figure 125: European Union Orange Industry Revenue Share (%), by Production Analysis 2025 & 2033
- Figure 126: European Union Orange Industry Volume Share (%), by Production Analysis 2025 & 2033
- Figure 127: European Union Orange Industry Revenue (Million), by Consumption Analysis 2025 & 2033
- Figure 128: European Union Orange Industry Volume (Kiloton), by Consumption Analysis 2025 & 2033
- Figure 129: European Union Orange Industry Revenue Share (%), by Consumption Analysis 2025 & 2033
- Figure 130: European Union Orange Industry Volume Share (%), by Consumption Analysis 2025 & 2033
- Figure 131: European Union Orange Industry Revenue (Million), by Import Market Analysis (Value & Volume) 2025 & 2033
- Figure 132: European Union Orange Industry Volume (Kiloton), by Import Market Analysis (Value & Volume) 2025 & 2033
- Figure 133: European Union Orange Industry Revenue Share (%), by Import Market Analysis (Value & Volume) 2025 & 2033
- Figure 134: European Union Orange Industry Volume Share (%), by Import Market Analysis (Value & Volume) 2025 & 2033
- Figure 135: European Union Orange Industry Revenue (Million), by Export Market Analysis (Value & Volume) 2025 & 2033
- Figure 136: European Union Orange Industry Volume (Kiloton), by Export Market Analysis (Value & Volume) 2025 & 2033
- Figure 137: European Union Orange Industry Revenue Share (%), by Export Market Analysis (Value & Volume) 2025 & 2033
- Figure 138: European Union Orange Industry Volume Share (%), by Export Market Analysis (Value & Volume) 2025 & 2033
- Figure 139: European Union Orange Industry Revenue (Million), by Price Trend Analysis 2025 & 2033
- Figure 140: European Union Orange Industry Volume (Kiloton), by Price Trend Analysis 2025 & 2033
- Figure 141: European Union Orange Industry Revenue Share (%), by Price Trend Analysis 2025 & 2033
- Figure 142: European Union Orange Industry Volume Share (%), by Price Trend Analysis 2025 & 2033
- Figure 143: European Union Orange Industry Revenue (Million), by Country 2025 & 2033
- Figure 144: European Union Orange Industry Volume (Kiloton), by Country 2025 & 2033
- Figure 145: European Union Orange Industry Revenue Share (%), by Country 2025 & 2033
- Figure 146: European Union Orange Industry Volume Share (%), by Country 2025 & 2033
- Figure 147: Egypt Orange Industry Revenue (Million), by Production Analysis 2025 & 2033
- Figure 148: Egypt Orange Industry Volume (Kiloton), by Production Analysis 2025 & 2033
- Figure 149: Egypt Orange Industry Revenue Share (%), by Production Analysis 2025 & 2033
- Figure 150: Egypt Orange Industry Volume Share (%), by Production Analysis 2025 & 2033
- Figure 151: Egypt Orange Industry Revenue (Million), by Consumption Analysis 2025 & 2033
- Figure 152: Egypt Orange Industry Volume (Kiloton), by Consumption Analysis 2025 & 2033
- Figure 153: Egypt Orange Industry Revenue Share (%), by Consumption Analysis 2025 & 2033
- Figure 154: Egypt Orange Industry Volume Share (%), by Consumption Analysis 2025 & 2033
- Figure 155: Egypt Orange Industry Revenue (Million), by Import Market Analysis (Value & Volume) 2025 & 2033
- Figure 156: Egypt Orange Industry Volume (Kiloton), by Import Market Analysis (Value & Volume) 2025 & 2033
- Figure 157: Egypt Orange Industry Revenue Share (%), by Import Market Analysis (Value & Volume) 2025 & 2033
- Figure 158: Egypt Orange Industry Volume Share (%), by Import Market Analysis (Value & Volume) 2025 & 2033
- Figure 159: Egypt Orange Industry Revenue (Million), by Export Market Analysis (Value & Volume) 2025 & 2033
- Figure 160: Egypt Orange Industry Volume (Kiloton), by Export Market Analysis (Value & Volume) 2025 & 2033
- Figure 161: Egypt Orange Industry Revenue Share (%), by Export Market Analysis (Value & Volume) 2025 & 2033
- Figure 162: Egypt Orange Industry Volume Share (%), by Export Market Analysis (Value & Volume) 2025 & 2033
- Figure 163: Egypt Orange Industry Revenue (Million), by Price Trend Analysis 2025 & 2033
- Figure 164: Egypt Orange Industry Volume (Kiloton), by Price Trend Analysis 2025 & 2033
- Figure 165: Egypt Orange Industry Revenue Share (%), by Price Trend Analysis 2025 & 2033
- Figure 166: Egypt Orange Industry Volume Share (%), by Price Trend Analysis 2025 & 2033
- Figure 167: Egypt Orange Industry Revenue (Million), by Country 2025 & 2033
- Figure 168: Egypt Orange Industry Volume (Kiloton), by Country 2025 & 2033
- Figure 169: Egypt Orange Industry Revenue Share (%), by Country 2025 & 2033
- Figure 170: Egypt Orange Industry Volume Share (%), by Country 2025 & 2033
- Figure 171: South Africa Orange Industry Revenue (Million), by Production Analysis 2025 & 2033
- Figure 172: South Africa Orange Industry Volume (Kiloton), by Production Analysis 2025 & 2033
- Figure 173: South Africa Orange Industry Revenue Share (%), by Production Analysis 2025 & 2033
- Figure 174: South Africa Orange Industry Volume Share (%), by Production Analysis 2025 & 2033
- Figure 175: South Africa Orange Industry Revenue (Million), by Consumption Analysis 2025 & 2033
- Figure 176: South Africa Orange Industry Volume (Kiloton), by Consumption Analysis 2025 & 2033
- Figure 177: South Africa Orange Industry Revenue Share (%), by Consumption Analysis 2025 & 2033
- Figure 178: South Africa Orange Industry Volume Share (%), by Consumption Analysis 2025 & 2033
- Figure 179: South Africa Orange Industry Revenue (Million), by Import Market Analysis (Value & Volume) 2025 & 2033
- Figure 180: South Africa Orange Industry Volume (Kiloton), by Import Market Analysis (Value & Volume) 2025 & 2033
- Figure 181: South Africa Orange Industry Revenue Share (%), by Import Market Analysis (Value & Volume) 2025 & 2033
- Figure 182: South Africa Orange Industry Volume Share (%), by Import Market Analysis (Value & Volume) 2025 & 2033
- Figure 183: South Africa Orange Industry Revenue (Million), by Export Market Analysis (Value & Volume) 2025 & 2033
- Figure 184: South Africa Orange Industry Volume (Kiloton), by Export Market Analysis (Value & Volume) 2025 & 2033
- Figure 185: South Africa Orange Industry Revenue Share (%), by Export Market Analysis (Value & Volume) 2025 & 2033
- Figure 186: South Africa Orange Industry Volume Share (%), by Export Market Analysis (Value & Volume) 2025 & 2033
- Figure 187: South Africa Orange Industry Revenue (Million), by Price Trend Analysis 2025 & 2033
- Figure 188: South Africa Orange Industry Volume (Kiloton), by Price Trend Analysis 2025 & 2033
- Figure 189: South Africa Orange Industry Revenue Share (%), by Price Trend Analysis 2025 & 2033
- Figure 190: South Africa Orange Industry Volume Share (%), by Price Trend Analysis 2025 & 2033
- Figure 191: South Africa Orange Industry Revenue (Million), by Country 2025 & 2033
- Figure 192: South Africa Orange Industry Volume (Kiloton), by Country 2025 & 2033
- Figure 193: South Africa Orange Industry Revenue Share (%), by Country 2025 & 2033
- Figure 194: South Africa Orange Industry Volume Share (%), by Country 2025 & 2033
- Figure 195: Indonesia Orange Industry Revenue (Million), by Production Analysis 2025 & 2033
- Figure 196: Indonesia Orange Industry Volume (Kiloton), by Production Analysis 2025 & 2033
- Figure 197: Indonesia Orange Industry Revenue Share (%), by Production Analysis 2025 & 2033
- Figure 198: Indonesia Orange Industry Volume Share (%), by Production Analysis 2025 & 2033
- Figure 199: Indonesia Orange Industry Revenue (Million), by Consumption Analysis 2025 & 2033
- Figure 200: Indonesia Orange Industry Volume (Kiloton), by Consumption Analysis 2025 & 2033
- Figure 201: Indonesia Orange Industry Revenue Share (%), by Consumption Analysis 2025 & 2033
- Figure 202: Indonesia Orange Industry Volume Share (%), by Consumption Analysis 2025 & 2033
- Figure 203: Indonesia Orange Industry Revenue (Million), by Import Market Analysis (Value & Volume) 2025 & 2033
- Figure 204: Indonesia Orange Industry Volume (Kiloton), by Import Market Analysis (Value & Volume) 2025 & 2033
- Figure 205: Indonesia Orange Industry Revenue Share (%), by Import Market Analysis (Value & Volume) 2025 & 2033
- Figure 206: Indonesia Orange Industry Volume Share (%), by Import Market Analysis (Value & Volume) 2025 & 2033
- Figure 207: Indonesia Orange Industry Revenue (Million), by Export Market Analysis (Value & Volume) 2025 & 2033
- Figure 208: Indonesia Orange Industry Volume (Kiloton), by Export Market Analysis (Value & Volume) 2025 & 2033
- Figure 209: Indonesia Orange Industry Revenue Share (%), by Export Market Analysis (Value & Volume) 2025 & 2033
- Figure 210: Indonesia Orange Industry Volume Share (%), by Export Market Analysis (Value & Volume) 2025 & 2033
- Figure 211: Indonesia Orange Industry Revenue (Million), by Price Trend Analysis 2025 & 2033
- Figure 212: Indonesia Orange Industry Volume (Kiloton), by Price Trend Analysis 2025 & 2033
- Figure 213: Indonesia Orange Industry Revenue Share (%), by Price Trend Analysis 2025 & 2033
- Figure 214: Indonesia Orange Industry Volume Share (%), by Price Trend Analysis 2025 & 2033
- Figure 215: Indonesia Orange Industry Revenue (Million), by Country 2025 & 2033
- Figure 216: Indonesia Orange Industry Volume (Kiloton), by Country 2025 & 2033
- Figure 217: Indonesia Orange Industry Revenue Share (%), by Country 2025 & 2033
- Figure 218: Indonesia Orange Industry Volume Share (%), by Country 2025 & 2033
- Figure 219: Turkey Orange Industry Revenue (Million), by Production Analysis 2025 & 2033
- Figure 220: Turkey Orange Industry Volume (Kiloton), by Production Analysis 2025 & 2033
- Figure 221: Turkey Orange Industry Revenue Share (%), by Production Analysis 2025 & 2033
- Figure 222: Turkey Orange Industry Volume Share (%), by Production Analysis 2025 & 2033
- Figure 223: Turkey Orange Industry Revenue (Million), by Consumption Analysis 2025 & 2033
- Figure 224: Turkey Orange Industry Volume (Kiloton), by Consumption Analysis 2025 & 2033
- Figure 225: Turkey Orange Industry Revenue Share (%), by Consumption Analysis 2025 & 2033
- Figure 226: Turkey Orange Industry Volume Share (%), by Consumption Analysis 2025 & 2033
- Figure 227: Turkey Orange Industry Revenue (Million), by Import Market Analysis (Value & Volume) 2025 & 2033
- Figure 228: Turkey Orange Industry Volume (Kiloton), by Import Market Analysis (Value & Volume) 2025 & 2033
- Figure 229: Turkey Orange Industry Revenue Share (%), by Import Market Analysis (Value & Volume) 2025 & 2033
- Figure 230: Turkey Orange Industry Volume Share (%), by Import Market Analysis (Value & Volume) 2025 & 2033
- Figure 231: Turkey Orange Industry Revenue (Million), by Export Market Analysis (Value & Volume) 2025 & 2033
- Figure 232: Turkey Orange Industry Volume (Kiloton), by Export Market Analysis (Value & Volume) 2025 & 2033
- Figure 233: Turkey Orange Industry Revenue Share (%), by Export Market Analysis (Value & Volume) 2025 & 2033
- Figure 234: Turkey Orange Industry Volume Share (%), by Export Market Analysis (Value & Volume) 2025 & 2033
- Figure 235: Turkey Orange Industry Revenue (Million), by Price Trend Analysis 2025 & 2033
- Figure 236: Turkey Orange Industry Volume (Kiloton), by Price Trend Analysis 2025 & 2033
- Figure 237: Turkey Orange Industry Revenue Share (%), by Price Trend Analysis 2025 & 2033
- Figure 238: Turkey Orange Industry Volume Share (%), by Price Trend Analysis 2025 & 2033
- Figure 239: Turkey Orange Industry Revenue (Million), by Country 2025 & 2033
- Figure 240: Turkey Orange Industry Volume (Kiloton), by Country 2025 & 2033
- Figure 241: Turkey Orange Industry Revenue Share (%), by Country 2025 & 2033
- Figure 242: Turkey Orange Industry Volume Share (%), by Country 2025 & 2033
List of Tables
- Table 1: Global Orange Industry Revenue Million Forecast, by Production Analysis 2020 & 2033
- Table 2: Global Orange Industry Volume Kiloton Forecast, by Production Analysis 2020 & 2033
- Table 3: Global Orange Industry Revenue Million Forecast, by Consumption Analysis 2020 & 2033
- Table 4: Global Orange Industry Volume Kiloton Forecast, by Consumption Analysis 2020 & 2033
- Table 5: Global Orange Industry Revenue Million Forecast, by Import Market Analysis (Value & Volume) 2020 & 2033
- Table 6: Global Orange Industry Volume Kiloton Forecast, by Import Market Analysis (Value & Volume) 2020 & 2033
- Table 7: Global Orange Industry Revenue Million Forecast, by Export Market Analysis (Value & Volume) 2020 & 2033
- Table 8: Global Orange Industry Volume Kiloton Forecast, by Export Market Analysis (Value & Volume) 2020 & 2033
- Table 9: Global Orange Industry Revenue Million Forecast, by Price Trend Analysis 2020 & 2033
- Table 10: Global Orange Industry Volume Kiloton Forecast, by Price Trend Analysis 2020 & 2033
- Table 11: Global Orange Industry Revenue Million Forecast, by Region 2020 & 2033
- Table 12: Global Orange Industry Volume Kiloton Forecast, by Region 2020 & 2033
- Table 13: Global Orange Industry Revenue Million Forecast, by Production Analysis 2020 & 2033
- Table 14: Global Orange Industry Volume Kiloton Forecast, by Production Analysis 2020 & 2033
- Table 15: Global Orange Industry Revenue Million Forecast, by Consumption Analysis 2020 & 2033
- Table 16: Global Orange Industry Volume Kiloton Forecast, by Consumption Analysis 2020 & 2033
- Table 17: Global Orange Industry Revenue Million Forecast, by Import Market Analysis (Value & Volume) 2020 & 2033
- Table 18: Global Orange Industry Volume Kiloton Forecast, by Import Market Analysis (Value & Volume) 2020 & 2033
- Table 19: Global Orange Industry Revenue Million Forecast, by Export Market Analysis (Value & Volume) 2020 & 2033
- Table 20: Global Orange Industry Volume Kiloton Forecast, by Export Market Analysis (Value & Volume) 2020 & 2033
- Table 21: Global Orange Industry Revenue Million Forecast, by Price Trend Analysis 2020 & 2033
- Table 22: Global Orange Industry Volume Kiloton Forecast, by Price Trend Analysis 2020 & 2033
- Table 23: Global Orange Industry Revenue Million Forecast, by Country 2020 & 2033
- Table 24: Global Orange Industry Volume Kiloton Forecast, by Country 2020 & 2033
- Table 25: Global Orange Industry Revenue Million Forecast, by Production Analysis 2020 & 2033
- Table 26: Global Orange Industry Volume Kiloton Forecast, by Production Analysis 2020 & 2033
- Table 27: Global Orange Industry Revenue Million Forecast, by Consumption Analysis 2020 & 2033
- Table 28: Global Orange Industry Volume Kiloton Forecast, by Consumption Analysis 2020 & 2033
- Table 29: Global Orange Industry Revenue Million Forecast, by Import Market Analysis (Value & Volume) 2020 & 2033
- Table 30: Global Orange Industry Volume Kiloton Forecast, by Import Market Analysis (Value & Volume) 2020 & 2033
- Table 31: Global Orange Industry Revenue Million Forecast, by Export Market Analysis (Value & Volume) 2020 & 2033
- Table 32: Global Orange Industry Volume Kiloton Forecast, by Export Market Analysis (Value & Volume) 2020 & 2033
- Table 33: Global Orange Industry Revenue Million Forecast, by Price Trend Analysis 2020 & 2033
- Table 34: Global Orange Industry Volume Kiloton Forecast, by Price Trend Analysis 2020 & 2033
- Table 35: Global Orange Industry Revenue Million Forecast, by Country 2020 & 2033
- Table 36: Global Orange Industry Volume Kiloton Forecast, by Country 2020 & 2033
- Table 37: Global Orange Industry Revenue Million Forecast, by Production Analysis 2020 & 2033
- Table 38: Global Orange Industry Volume Kiloton Forecast, by Production Analysis 2020 & 2033
- Table 39: Global Orange Industry Revenue Million Forecast, by Consumption Analysis 2020 & 2033
- Table 40: Global Orange Industry Volume Kiloton Forecast, by Consumption Analysis 2020 & 2033
- Table 41: Global Orange Industry Revenue Million Forecast, by Import Market Analysis (Value & Volume) 2020 & 2033
- Table 42: Global Orange Industry Volume Kiloton Forecast, by Import Market Analysis (Value & Volume) 2020 & 2033
- Table 43: Global Orange Industry Revenue Million Forecast, by Export Market Analysis (Value & Volume) 2020 & 2033
- Table 44: Global Orange Industry Volume Kiloton Forecast, by Export Market Analysis (Value & Volume) 2020 & 2033
- Table 45: Global Orange Industry Revenue Million Forecast, by Price Trend Analysis 2020 & 2033
- Table 46: Global Orange Industry Volume Kiloton Forecast, by Price Trend Analysis 2020 & 2033
- Table 47: Global Orange Industry Revenue Million Forecast, by Country 2020 & 2033
- Table 48: Global Orange Industry Volume Kiloton Forecast, by Country 2020 & 2033
- Table 49: Global Orange Industry Revenue Million Forecast, by Production Analysis 2020 & 2033
- Table 50: Global Orange Industry Volume Kiloton Forecast, by Production Analysis 2020 & 2033
- Table 51: Global Orange Industry Revenue Million Forecast, by Consumption Analysis 2020 & 2033
- Table 52: Global Orange Industry Volume Kiloton Forecast, by Consumption Analysis 2020 & 2033
- Table 53: Global Orange Industry Revenue Million Forecast, by Import Market Analysis (Value & Volume) 2020 & 2033
- Table 54: Global Orange Industry Volume Kiloton Forecast, by Import Market Analysis (Value & Volume) 2020 & 2033
- Table 55: Global Orange Industry Revenue Million Forecast, by Export Market Analysis (Value & Volume) 2020 & 2033
- Table 56: Global Orange Industry Volume Kiloton Forecast, by Export Market Analysis (Value & Volume) 2020 & 2033
- Table 57: Global Orange Industry Revenue Million Forecast, by Price Trend Analysis 2020 & 2033
- Table 58: Global Orange Industry Volume Kiloton Forecast, by Price Trend Analysis 2020 & 2033
- Table 59: Global Orange Industry Revenue Million Forecast, by Country 2020 & 2033
- Table 60: Global Orange Industry Volume Kiloton Forecast, by Country 2020 & 2033
- Table 61: Global Orange Industry Revenue Million Forecast, by Production Analysis 2020 & 2033
- Table 62: Global Orange Industry Volume Kiloton Forecast, by Production Analysis 2020 & 2033
- Table 63: Global Orange Industry Revenue Million Forecast, by Consumption Analysis 2020 & 2033
- Table 64: Global Orange Industry Volume Kiloton Forecast, by Consumption Analysis 2020 & 2033
- Table 65: Global Orange Industry Revenue Million Forecast, by Import Market Analysis (Value & Volume) 2020 & 2033
- Table 66: Global Orange Industry Volume Kiloton Forecast, by Import Market Analysis (Value & Volume) 2020 & 2033
- Table 67: Global Orange Industry Revenue Million Forecast, by Export Market Analysis (Value & Volume) 2020 & 2033
- Table 68: Global Orange Industry Volume Kiloton Forecast, by Export Market Analysis (Value & Volume) 2020 & 2033
- Table 69: Global Orange Industry Revenue Million Forecast, by Price Trend Analysis 2020 & 2033
- Table 70: Global Orange Industry Volume Kiloton Forecast, by Price Trend Analysis 2020 & 2033
- Table 71: Global Orange Industry Revenue Million Forecast, by Country 2020 & 2033
- Table 72: Global Orange Industry Volume Kiloton Forecast, by Country 2020 & 2033
- Table 73: Global Orange Industry Revenue Million Forecast, by Production Analysis 2020 & 2033
- Table 74: Global Orange Industry Volume Kiloton Forecast, by Production Analysis 2020 & 2033
- Table 75: Global Orange Industry Revenue Million Forecast, by Consumption Analysis 2020 & 2033
- Table 76: Global Orange Industry Volume Kiloton Forecast, by Consumption Analysis 2020 & 2033
- Table 77: Global Orange Industry Revenue Million Forecast, by Import Market Analysis (Value & Volume) 2020 & 2033
- Table 78: Global Orange Industry Volume Kiloton Forecast, by Import Market Analysis (Value & Volume) 2020 & 2033
- Table 79: Global Orange Industry Revenue Million Forecast, by Export Market Analysis (Value & Volume) 2020 & 2033
- Table 80: Global Orange Industry Volume Kiloton Forecast, by Export Market Analysis (Value & Volume) 2020 & 2033
- Table 81: Global Orange Industry Revenue Million Forecast, by Price Trend Analysis 2020 & 2033
- Table 82: Global Orange Industry Volume Kiloton Forecast, by Price Trend Analysis 2020 & 2033
- Table 83: Global Orange Industry Revenue Million Forecast, by Country 2020 & 2033
- Table 84: Global Orange Industry Volume Kiloton Forecast, by Country 2020 & 2033
- Table 85: Global Orange Industry Revenue Million Forecast, by Production Analysis 2020 & 2033
- Table 86: Global Orange Industry Volume Kiloton Forecast, by Production Analysis 2020 & 2033
- Table 87: Global Orange Industry Revenue Million Forecast, by Consumption Analysis 2020 & 2033
- Table 88: Global Orange Industry Volume Kiloton Forecast, by Consumption Analysis 2020 & 2033
- Table 89: Global Orange Industry Revenue Million Forecast, by Import Market Analysis (Value & Volume) 2020 & 2033
- Table 90: Global Orange Industry Volume Kiloton Forecast, by Import Market Analysis (Value & Volume) 2020 & 2033
- Table 91: Global Orange Industry Revenue Million Forecast, by Export Market Analysis (Value & Volume) 2020 & 2033
- Table 92: Global Orange Industry Volume Kiloton Forecast, by Export Market Analysis (Value & Volume) 2020 & 2033
- Table 93: Global Orange Industry Revenue Million Forecast, by Price Trend Analysis 2020 & 2033
- Table 94: Global Orange Industry Volume Kiloton Forecast, by Price Trend Analysis 2020 & 2033
- Table 95: Global Orange Industry Revenue Million Forecast, by Country 2020 & 2033
- Table 96: Global Orange Industry Volume Kiloton Forecast, by Country 2020 & 2033
- Table 97: Global Orange Industry Revenue Million Forecast, by Production Analysis 2020 & 2033
- Table 98: Global Orange Industry Volume Kiloton Forecast, by Production Analysis 2020 & 2033
- Table 99: Global Orange Industry Revenue Million Forecast, by Consumption Analysis 2020 & 2033
- Table 100: Global Orange Industry Volume Kiloton Forecast, by Consumption Analysis 2020 & 2033
- Table 101: Global Orange Industry Revenue Million Forecast, by Import Market Analysis (Value & Volume) 2020 & 2033
- Table 102: Global Orange Industry Volume Kiloton Forecast, by Import Market Analysis (Value & Volume) 2020 & 2033
- Table 103: Global Orange Industry Revenue Million Forecast, by Export Market Analysis (Value & Volume) 2020 & 2033
- Table 104: Global Orange Industry Volume Kiloton Forecast, by Export Market Analysis (Value & Volume) 2020 & 2033
- Table 105: Global Orange Industry Revenue Million Forecast, by Price Trend Analysis 2020 & 2033
- Table 106: Global Orange Industry Volume Kiloton Forecast, by Price Trend Analysis 2020 & 2033
- Table 107: Global Orange Industry Revenue Million Forecast, by Country 2020 & 2033
- Table 108: Global Orange Industry Volume Kiloton Forecast, by Country 2020 & 2033
- Table 109: Global Orange Industry Revenue Million Forecast, by Production Analysis 2020 & 2033
- Table 110: Global Orange Industry Volume Kiloton Forecast, by Production Analysis 2020 & 2033
- Table 111: Global Orange Industry Revenue Million Forecast, by Consumption Analysis 2020 & 2033
- Table 112: Global Orange Industry Volume Kiloton Forecast, by Consumption Analysis 2020 & 2033
- Table 113: Global Orange Industry Revenue Million Forecast, by Import Market Analysis (Value & Volume) 2020 & 2033
- Table 114: Global Orange Industry Volume Kiloton Forecast, by Import Market Analysis (Value & Volume) 2020 & 2033
- Table 115: Global Orange Industry Revenue Million Forecast, by Export Market Analysis (Value & Volume) 2020 & 2033
- Table 116: Global Orange Industry Volume Kiloton Forecast, by Export Market Analysis (Value & Volume) 2020 & 2033
- Table 117: Global Orange Industry Revenue Million Forecast, by Price Trend Analysis 2020 & 2033
- Table 118: Global Orange Industry Volume Kiloton Forecast, by Price Trend Analysis 2020 & 2033
- Table 119: Global Orange Industry Revenue Million Forecast, by Country 2020 & 2033
- Table 120: Global Orange Industry Volume Kiloton Forecast, by Country 2020 & 2033
- Table 121: Global Orange Industry Revenue Million Forecast, by Production Analysis 2020 & 2033
- Table 122: Global Orange Industry Volume Kiloton Forecast, by Production Analysis 2020 & 2033
- Table 123: Global Orange Industry Revenue Million Forecast, by Consumption Analysis 2020 & 2033
- Table 124: Global Orange Industry Volume Kiloton Forecast, by Consumption Analysis 2020 & 2033
- Table 125: Global Orange Industry Revenue Million Forecast, by Import Market Analysis (Value & Volume) 2020 & 2033
- Table 126: Global Orange Industry Volume Kiloton Forecast, by Import Market Analysis (Value & Volume) 2020 & 2033
- Table 127: Global Orange Industry Revenue Million Forecast, by Export Market Analysis (Value & Volume) 2020 & 2033
- Table 128: Global Orange Industry Volume Kiloton Forecast, by Export Market Analysis (Value & Volume) 2020 & 2033
- Table 129: Global Orange Industry Revenue Million Forecast, by Price Trend Analysis 2020 & 2033
- Table 130: Global Orange Industry Volume Kiloton Forecast, by Price Trend Analysis 2020 & 2033
- Table 131: Global Orange Industry Revenue Million Forecast, by Country 2020 & 2033
- Table 132: Global Orange Industry Volume Kiloton Forecast, by Country 2020 & 2033
Frequently Asked Questions
1. What is the projected Compound Annual Growth Rate (CAGR) of the Orange Industry?
The projected CAGR is approximately 4.53%.
2. Which companies are prominent players in the Orange Industry?
Key companies in the market include The Coca-Cola Company , PepsiCo , Minute Maid, Tropicana Products, Inc. , Florida's Natural Growers.
3. What are the main segments of the Orange Industry?
The market segments include Production Analysis, Consumption Analysis, Import Market Analysis (Value & Volume), Export Market Analysis (Value & Volume), Price Trend Analysis.
4. Can you provide details about the market size?
The market size is estimated to be USD 3.84 Million as of 2022.
5. What are some drivers contributing to market growth?
Rising Consumption of Cashew Nuts as a Healthy Snack; Increasing Government initiatives; Growing Cashew Nut Imports in The United States.
6. What are the notable trends driving market growth?
Growing Seasonal Consumption of Orange.
7. Are there any restraints impacting market growth?
Hazardous Climatic Condition Hinders Cashew Production; Stringent Regulations Related To Food Quality Standards.
8. Can you provide examples of recent developments in the market?
November 2022: Arunachal Pradesh Agriculture Marketing Board exported the first 6 metric tons of oranges consignment to the UAE and Qatar in collaboration with the Agricultural and Processed Food Products Export Development Authority, the central government, and the Dubai-based Lulu Group International. The oranges will be launched at the Lulu Group's hypermarkets in the UAE and Qatar.
9. What pricing options are available for accessing the report?
Pricing options include single-user, multi-user, and enterprise licenses priced at USD 4750, USD 5250, and USD 8750 respectively.
10. Is the market size provided in terms of value or volume?
The market size is provided in terms of value, measured in Million and volume, measured in Kiloton.
11. Are there any specific market keywords associated with the report?
Yes, the market keyword associated with the report is "Orange Industry," which aids in identifying and referencing the specific market segment covered.
12. How do I determine which pricing option suits my needs best?
The pricing options vary based on user requirements and access needs. Individual users may opt for single-user licenses, while businesses requiring broader access may choose multi-user or enterprise licenses for cost-effective access to the report.
13. Are there any additional resources or data provided in the Orange Industry report?
While the report offers comprehensive insights, it's advisable to review the specific contents or supplementary materials provided to ascertain if additional resources or data are available.
14. How can I stay updated on further developments or reports in the Orange Industry?
To stay informed about further developments, trends, and reports in the Orange Industry, consider subscribing to industry newsletters, following relevant companies and organizations, or regularly checking reputable industry news sources and publications.
Methodology
Step 1 - Identification of Relevant Samples Size from Population Database


Step 2 - Approaches for Defining Global Market Size (Value, Volume* & Price*)

Note*: In applicable scenarios
Step 3 - Data Sources
Primary Research
- Web Analytics
- Survey Reports
- Research Institute
- Latest Research Reports
- Opinion Leaders
Secondary Research
- Annual Reports
- White Paper
- Latest Press Release
- Industry Association
- Paid Database
- Investor Presentations

Step 4 - Data Triangulation
Involves using different sources of information in order to increase the validity of a study
These sources are likely to be stakeholders in a program - participants, other researchers, program staff, other community members, and so on.
Then we put all data in single framework & apply various statistical tools to find out the dynamic on the market.
During the analysis stage, feedback from the stakeholder groups would be compared to determine areas of agreement as well as areas of divergence