

Key Insights
The Phthalic Anhydride Derivatives market is projected to reach $4.88 billion by 2024, with a Compound Annual Growth Rate (CAGR) of 6.6% from 2024 to 2033. Key growth drivers include robust demand from the construction sector (infrastructure development), automotive industry (lightweight vehicle production), and electrical & electronics sector (consumer electronics manufacturing). The unsaturated polyester resins segment, a major derivative, benefits from widespread use in fiberglass reinforced plastics (FRP) for construction and automotive applications. Environmental concerns and regulatory scrutiny surrounding certain phthalate esters, however, pose a restraint, fostering innovation in safer alternatives. The market is segmented by derivatives (unsaturated polyester resins, alkyd resins, plasticizers, and others) and end-user industries (construction, automotive, electrical & electronics, aerospace, and others). Asia-Pacific, particularly China and India, presents significant growth opportunities due to rapid industrialization. North America and Europe remain substantial contributors, driven by ongoing construction and automotive production.
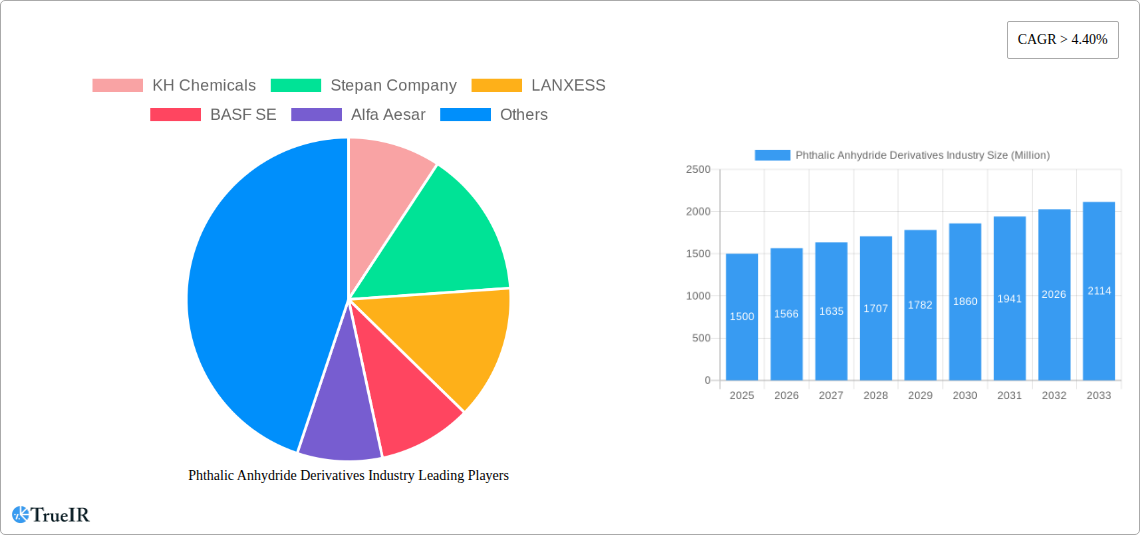
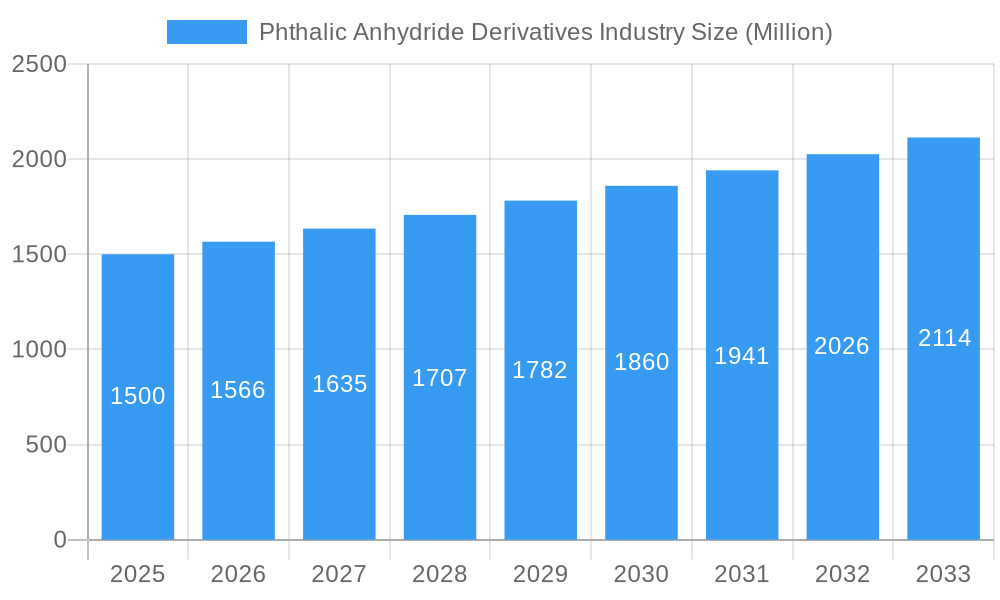
Phthalic Anhydride Derivatives Industry Market Size (In Billion)
The competitive landscape features major global players such as BASF SE, LANXESS, and Stepan Company, alongside regional manufacturers. Strategies include product innovation, market expansion, and mergers and acquisitions. Future market dynamics will be influenced by the development of bio-based phthalic anhydride derivatives and the adoption of sustainable manufacturing processes. Stringent phthalate regulations will drive continuous innovation and adaptation. The forecast period anticipates a gradual transition to environmentally friendly alternatives, with overall market growth moderated by regulatory developments and sustainability initiatives.
Phthalic Anhydride Derivatives Industry Company Market Share
Phthalic Anhydride Derivatives Industry Market Report: 2019-2033
This comprehensive report provides a detailed analysis of the global Phthalic Anhydride Derivatives industry, covering market size, growth trends, competitive landscape, and future outlook. The study period spans from 2019 to 2033, with 2025 serving as the base and estimated year. The report offers invaluable insights for industry stakeholders, including manufacturers, investors, and researchers, seeking to navigate this dynamic market. The global market size in 2025 is estimated at $XX Million and is projected to reach $XX Million by 2033, exhibiting a CAGR of xx% during the forecast period (2025-2033).
Phthalic Anhydride Derivatives Industry Market Structure & Competitive Landscape
The Phthalic Anhydride Derivatives market exhibits a moderately concentrated structure, with key players such as BASF SE, LANXESS, and Stepan Company holding significant market share. The Herfindahl-Hirschman Index (HHI) for 2025 is estimated at xx, indicating a moderately concentrated market. Innovation is a crucial driver, with companies continuously developing new derivatives with enhanced properties and applications. Regulatory changes, particularly concerning environmental concerns and safety regulations, significantly impact the industry. Product substitutes, such as bio-based alternatives, present a growing challenge.
The market is segmented by end-user industry, with the construction, automotive, and electrical & electronics sectors being the major consumers. Mergers and acquisitions (M&A) activity has been moderate in recent years, with xx major deals recorded between 2019 and 2024, totaling approximately $xx Million in value. This activity is largely driven by companies seeking to expand their product portfolios and geographical reach.
- Market Concentration: HHI of xx in 2025.
- Innovation Drivers: Development of high-performance derivatives, sustainable alternatives.
- Regulatory Impacts: Stringent environmental regulations, safety standards.
- Product Substitutes: Bio-based alternatives, other polymers.
- End-User Segmentation: Construction (xx%), Automotive (xx%), Electrical & Electronics (xx%), Others (xx%).
- M&A Trends: xx major deals between 2019-2024, totaling $xx Million.
Phthalic Anhydride Derivatives Industry Market Trends & Opportunities
The Phthalic Anhydride Derivatives market is experiencing robust growth, fueled by increasing demand from various end-use sectors. The construction industry’s expansion, particularly in developing economies, is a significant driver. Technological advancements, such as the development of more efficient production processes and improved derivative formulations, are enhancing market penetration. Consumer preferences for durable, high-performance materials are further bolstering market demand. Competitive dynamics are characterized by both price competition and innovation-driven differentiation. The market is witnessing a shift towards sustainable and environmentally friendly derivatives, creating new opportunities for businesses that can cater to this growing demand. The market size is projected to increase from $XX Million in 2025 to $XX Million by 2033.
Dominant Markets & Segments in Phthalic Anhydride Derivatives Industry
The Asia-Pacific region dominates the global Phthalic Anhydride Derivatives market, driven by robust economic growth and increasing infrastructure development. Within this region, China and India are the leading national markets. Among the derivative segments, unsaturated polyester resins hold the largest market share, followed by alkyd resins and plasticizers.
- Leading Region: Asia-Pacific
- Leading Countries: China, India
- Dominant Derivative Segment: Unsaturated Polyester Resins
- Key Growth Drivers (Unsaturated Polyester Resins): Expanding construction sector, rising demand for fiberglass reinforced plastics.
- Key Growth Drivers (Alkyd Resins): Growth in the coatings and paints industry, demand for durable finishes.
- Key Growth Drivers (Plasticizers): Demand from the plastics and packaging industries.
- Key Growth Drivers (Construction End-use): Infrastructure development, rising urbanization.
- Key Growth Drivers (Automotive End-use): Growth in vehicle production, demand for lightweight materials.
Phthalic Anhydride Derivatives Industry Product Analysis
Recent innovations in Phthalic Anhydride Derivatives focus on enhancing performance characteristics such as durability, flexibility, and sustainability. New derivatives with improved UV resistance, heat stability, and biodegradability are gaining traction. The market is witnessing the emergence of specialized derivatives tailored to specific applications, enhancing their competitive advantages.
Key Drivers, Barriers & Challenges in Phthalic Anhydride Derivatives Industry
Key Drivers: Increasing demand from various end-use sectors (construction, automotive, electronics), technological advancements in production and formulation, government support for infrastructure projects.
Challenges: Fluctuations in raw material prices, stringent environmental regulations increasing production costs, intense competition from substitutes, supply chain disruptions (xx% impact on production in 2022 due to supply chain bottlenecks).
Growth Drivers in the Phthalic Anhydride Derivatives Industry Market
The key drivers for growth include expanding construction and automotive sectors, increasing demand for durable and high-performance materials, and the development of new applications in electronics and other industries. Technological advancements that enhance the properties of phthalic anhydride derivatives also play a significant role.
Challenges Impacting Phthalic Anhydride Derivatives Industry Growth
Challenges include volatile raw material prices, stringent environmental regulations impacting production costs, and intense competition from substitute materials. Supply chain disruptions and geopolitical instability also pose significant risks.
Key Players Shaping the Phthalic Anhydride Derivatives Industry Market
- KH Chemicals
- Stepan Company
- LANXESS
- BASF SE
- Alfa Aesar
- PENPET Petrochemical Trading GmbH
- JFE Chemical Corporation
- I G Petrochemicals Ltd
- Polynt SpA
- Thirumalai Chemicals Ltd
- Tokyo Chemical Industry
- S I Group Inc
- Koppers Inc
- Perstorp
- The Chemical Company
Significant Phthalic Anhydride Derivatives Industry Industry Milestones
- 2020: BASF SE launched a new, sustainable phthalate-free plasticizer.
- 2021: Stepan Company acquired a smaller competitor, expanding its market share.
- 2022: New regulations on phthalate use implemented in the EU.
- 2023: LANXESS announced investment in a new production facility for high-performance derivatives.
Future Outlook for Phthalic Anhydride Derivatives Industry Market
The Phthalic Anhydride Derivatives market is poised for continued growth, driven by strong demand from key end-use sectors and ongoing innovation in product development. Strategic partnerships, investments in new technologies, and expansion into emerging markets will be crucial for success in this competitive landscape. The focus on sustainable and environmentally friendly derivatives will shape the future trajectory of the market.
Phthalic Anhydride Derivatives Industry Segmentation
-
1. Derivatives
- 1.1. Unsaturated Polyester Resins
- 1.2. Alkyd Resin
- 1.3. Plasticizer
- 1.4. Other
-
2. End-user Industry
- 2.1. Construction
- 2.2. Automotive
- 2.3. Electrical and Electronics
- 2.4. Aerospace
- 2.5. Others
Phthalic Anhydride Derivatives Industry Segmentation By Geography
-
1. Asia Pacific
- 1.1. China
- 1.2. India
- 1.3. Japan
- 1.4. South Korea
- 1.5. Rest of Asia Pacific
-
2. North America
- 2.1. United States
- 2.2. Canada
- 2.3. Mexico
-
3. Europe
- 3.1. Germany
- 3.2. United Kingdom
- 3.3. France
- 3.4. Italy
- 3.5. Rest of Europe
-
4. South America
- 4.1. Brazil
- 4.2. Argentina
- 4.3. Rest of South America
-
5. Middle East and Africa
- 5.1. Saudi Arabia
- 5.2. South Africa
- 5.3. Rest of Middle East and Africa
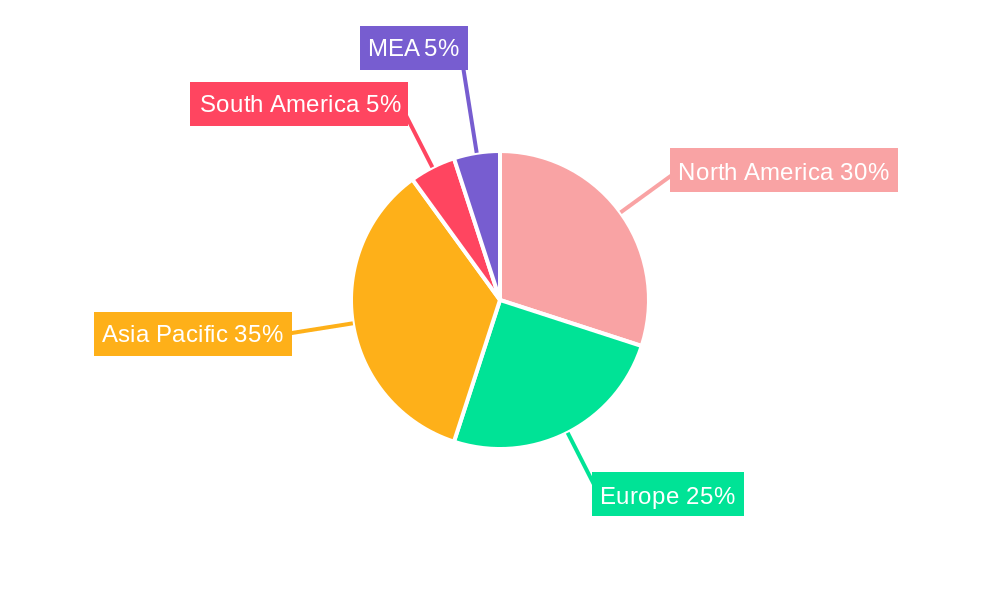
Phthalic Anhydride Derivatives Industry Regional Market Share
Geographic Coverage of Phthalic Anhydride Derivatives Industry
Phthalic Anhydride Derivatives Industry REPORT HIGHLIGHTS
| Aspects | Details |
|---|---|
| Study Period | 2020-2034 |
| Base Year | 2025 |
| Estimated Year | 2026 |
| Forecast Period | 2026-2034 |
| Historical Period | 2020-2025 |
| Growth Rate | CAGR of 6.6% from 2020-2034 |
| Segmentation |
|
Table of Contents
- 1. Introduction
- 1.1. Research Scope
- 1.2. Market Segmentation
- 1.3. Research Objective
- 1.4. Definitions and Assumptions
- 2. Executive Summary
- 2.1. Market Snapshot
- 3. Market Dynamics
- 3.1. Market Drivers
- 3.2. Market Restrains
- 3.3. Market Trends
- 3.4. Market Opportunities
- 4. Market Factor Analysis
- 4.1. Porters Five Forces
- 4.1.1. Bargaining Power of Suppliers
- 4.1.2. Bargaining Power of Buyers
- 4.1.3. Threat of New Entrants
- 4.1.4. Threat of Substitutes
- 4.1.5. Competitive Rivalry
- 4.2. PESTEL analysis
- 4.3. BCG Analysis
- 4.3.1. Stars (High Growth, High Market Share)
- 4.3.2. Cash Cows (Low Growth, High Market Share)
- 4.3.3. Question Mark (High Growth, Low Market Share)
- 4.3.4. Dogs (Low Growth, Low Market Share)
- 4.4. Ansoff Matrix Analysis
- 4.5. Supply Chain Analysis
- 4.6. Regulatory Landscape
- 4.7. Current Market Potential and Opportunity Assessment (TAM–SAM–SOM Framework)
- 4.8. TIR Analyst Note
- 4.1. Porters Five Forces
- 5. Market Analysis, Insights and Forecast 2021-2033
- 5.1. Market Analysis, Insights and Forecast - by Derivatives
- 5.1.1. Unsaturated Polyester Resins
- 5.1.2. Alkyd Resin
- 5.1.3. Plasticizer
- 5.1.4. Other
- 5.2. Market Analysis, Insights and Forecast - by End-user Industry
- 5.2.1. Construction
- 5.2.2. Automotive
- 5.2.3. Electrical and Electronics
- 5.2.4. Aerospace
- 5.2.5. Others
- 5.3. Market Analysis, Insights and Forecast - by Region
- 5.3.1. Asia Pacific
- 5.3.2. North America
- 5.3.3. Europe
- 5.3.4. South America
- 5.3.5. Middle East and Africa
- 5.1. Market Analysis, Insights and Forecast - by Derivatives
- 6. Global Phthalic Anhydride Derivatives Industry Analysis, Insights and Forecast, 2021-2033
- 6.1. Market Analysis, Insights and Forecast - by Derivatives
- 6.1.1. Unsaturated Polyester Resins
- 6.1.2. Alkyd Resin
- 6.1.3. Plasticizer
- 6.1.4. Other
- 6.2. Market Analysis, Insights and Forecast - by End-user Industry
- 6.2.1. Construction
- 6.2.2. Automotive
- 6.2.3. Electrical and Electronics
- 6.2.4. Aerospace
- 6.2.5. Others
- 6.1. Market Analysis, Insights and Forecast - by Derivatives
- 7. Asia Pacific Phthalic Anhydride Derivatives Industry Analysis, Insights and Forecast, 2020-2032
- 7.1. Market Analysis, Insights and Forecast - by Derivatives
- 7.1.1. Unsaturated Polyester Resins
- 7.1.2. Alkyd Resin
- 7.1.3. Plasticizer
- 7.1.4. Other
- 7.2. Market Analysis, Insights and Forecast - by End-user Industry
- 7.2.1. Construction
- 7.2.2. Automotive
- 7.2.3. Electrical and Electronics
- 7.2.4. Aerospace
- 7.2.5. Others
- 7.1. Market Analysis, Insights and Forecast - by Derivatives
- 8. North America Phthalic Anhydride Derivatives Industry Analysis, Insights and Forecast, 2020-2032
- 8.1. Market Analysis, Insights and Forecast - by Derivatives
- 8.1.1. Unsaturated Polyester Resins
- 8.1.2. Alkyd Resin
- 8.1.3. Plasticizer
- 8.1.4. Other
- 8.2. Market Analysis, Insights and Forecast - by End-user Industry
- 8.2.1. Construction
- 8.2.2. Automotive
- 8.2.3. Electrical and Electronics
- 8.2.4. Aerospace
- 8.2.5. Others
- 8.1. Market Analysis, Insights and Forecast - by Derivatives
- 9. Europe Phthalic Anhydride Derivatives Industry Analysis, Insights and Forecast, 2020-2032
- 9.1. Market Analysis, Insights and Forecast - by Derivatives
- 9.1.1. Unsaturated Polyester Resins
- 9.1.2. Alkyd Resin
- 9.1.3. Plasticizer
- 9.1.4. Other
- 9.2. Market Analysis, Insights and Forecast - by End-user Industry
- 9.2.1. Construction
- 9.2.2. Automotive
- 9.2.3. Electrical and Electronics
- 9.2.4. Aerospace
- 9.2.5. Others
- 9.1. Market Analysis, Insights and Forecast - by Derivatives
- 10. South America Phthalic Anhydride Derivatives Industry Analysis, Insights and Forecast, 2020-2032
- 10.1. Market Analysis, Insights and Forecast - by Derivatives
- 10.1.1. Unsaturated Polyester Resins
- 10.1.2. Alkyd Resin
- 10.1.3. Plasticizer
- 10.1.4. Other
- 10.2. Market Analysis, Insights and Forecast - by End-user Industry
- 10.2.1. Construction
- 10.2.2. Automotive
- 10.2.3. Electrical and Electronics
- 10.2.4. Aerospace
- 10.2.5. Others
- 10.1. Market Analysis, Insights and Forecast - by Derivatives
- 11. Middle East and Africa Phthalic Anhydride Derivatives Industry Analysis, Insights and Forecast, 2020-2032
- 11.1. Market Analysis, Insights and Forecast - by Derivatives
- 11.1.1. Unsaturated Polyester Resins
- 11.1.2. Alkyd Resin
- 11.1.3. Plasticizer
- 11.1.4. Other
- 11.2. Market Analysis, Insights and Forecast - by End-user Industry
- 11.2.1. Construction
- 11.2.2. Automotive
- 11.2.3. Electrical and Electronics
- 11.2.4. Aerospace
- 11.2.5. Others
- 11.1. Market Analysis, Insights and Forecast - by Derivatives
- 12. Competitive Analysis
- 12.1. Company Profiles
- 12.1.1 KH Chemicals
- 12.1.1.1. Company Overview
- 12.1.1.2. Products
- 12.1.1.3. Company Financials
- 12.1.1.4. SWOT Analysis
- 12.1.2 Stepan Company
- 12.1.2.1. Company Overview
- 12.1.2.2. Products
- 12.1.2.3. Company Financials
- 12.1.2.4. SWOT Analysis
- 12.1.3 LANXESS
- 12.1.3.1. Company Overview
- 12.1.3.2. Products
- 12.1.3.3. Company Financials
- 12.1.3.4. SWOT Analysis
- 12.1.4 BASF SE
- 12.1.4.1. Company Overview
- 12.1.4.2. Products
- 12.1.4.3. Company Financials
- 12.1.4.4. SWOT Analysis
- 12.1.5 Alfa Aesar
- 12.1.5.1. Company Overview
- 12.1.5.2. Products
- 12.1.5.3. Company Financials
- 12.1.5.4. SWOT Analysis
- 12.1.6 PENPET Petrochemical Trading GmbH
- 12.1.6.1. Company Overview
- 12.1.6.2. Products
- 12.1.6.3. Company Financials
- 12.1.6.4. SWOT Analysis
- 12.1.7 JFE Chemical Corporation
- 12.1.7.1. Company Overview
- 12.1.7.2. Products
- 12.1.7.3. Company Financials
- 12.1.7.4. SWOT Analysis
- 12.1.8 I G Petrochemicals Ltd
- 12.1.8.1. Company Overview
- 12.1.8.2. Products
- 12.1.8.3. Company Financials
- 12.1.8.4. SWOT Analysis
- 12.1.9 Polynt SpA
- 12.1.9.1. Company Overview
- 12.1.9.2. Products
- 12.1.9.3. Company Financials
- 12.1.9.4. SWOT Analysis
- 12.1.10 Thirumalai Chemicals Ltd
- 12.1.10.1. Company Overview
- 12.1.10.2. Products
- 12.1.10.3. Company Financials
- 12.1.10.4. SWOT Analysis
- 12.1.11 Tokyo Chemical Industry
- 12.1.11.1. Company Overview
- 12.1.11.2. Products
- 12.1.11.3. Company Financials
- 12.1.11.4. SWOT Analysis
- 12.1.12 S I Group Inc
- 12.1.12.1. Company Overview
- 12.1.12.2. Products
- 12.1.12.3. Company Financials
- 12.1.12.4. SWOT Analysis
- 12.1.13 Koppers Inc
- 12.1.13.1. Company Overview
- 12.1.13.2. Products
- 12.1.13.3. Company Financials
- 12.1.13.4. SWOT Analysis
- 12.1.14 Perstorp
- 12.1.14.1. Company Overview
- 12.1.14.2. Products
- 12.1.14.3. Company Financials
- 12.1.14.4. SWOT Analysis
- 12.1.15 The Chemical Company
- 12.1.15.1. Company Overview
- 12.1.15.2. Products
- 12.1.15.3. Company Financials
- 12.1.15.4. SWOT Analysis
- 12.1.1 KH Chemicals
- 12.2. Market Entropy
- 12.2.1 Company's Key Areas Served
- 12.2.2 Recent Developments
- 12.3. Company Market Share Analysis 2025
- 12.3.1 Top 5 Companies Market Share Analysis
- 12.3.2 Top 3 Companies Market Share Analysis
- 12.4. List of Potential Customers
- 13. Research Methodology
List of Figures
- Figure 1: Global Phthalic Anhydride Derivatives Industry Revenue Breakdown (billion, %) by Region 2025 & 2033
- Figure 2: Global Phthalic Anhydride Derivatives Industry Volume Breakdown (K Tons, %) by Region 2025 & 2033
- Figure 3: Asia Pacific Phthalic Anhydride Derivatives Industry Revenue (billion), by Derivatives 2025 & 2033
- Figure 4: Asia Pacific Phthalic Anhydride Derivatives Industry Volume (K Tons), by Derivatives 2025 & 2033
- Figure 5: Asia Pacific Phthalic Anhydride Derivatives Industry Revenue Share (%), by Derivatives 2025 & 2033
- Figure 6: Asia Pacific Phthalic Anhydride Derivatives Industry Volume Share (%), by Derivatives 2025 & 2033
- Figure 7: Asia Pacific Phthalic Anhydride Derivatives Industry Revenue (billion), by End-user Industry 2025 & 2033
- Figure 8: Asia Pacific Phthalic Anhydride Derivatives Industry Volume (K Tons), by End-user Industry 2025 & 2033
- Figure 9: Asia Pacific Phthalic Anhydride Derivatives Industry Revenue Share (%), by End-user Industry 2025 & 2033
- Figure 10: Asia Pacific Phthalic Anhydride Derivatives Industry Volume Share (%), by End-user Industry 2025 & 2033
- Figure 11: Asia Pacific Phthalic Anhydride Derivatives Industry Revenue (billion), by Country 2025 & 2033
- Figure 12: Asia Pacific Phthalic Anhydride Derivatives Industry Volume (K Tons), by Country 2025 & 2033
- Figure 13: Asia Pacific Phthalic Anhydride Derivatives Industry Revenue Share (%), by Country 2025 & 2033
- Figure 14: Asia Pacific Phthalic Anhydride Derivatives Industry Volume Share (%), by Country 2025 & 2033
- Figure 15: North America Phthalic Anhydride Derivatives Industry Revenue (billion), by Derivatives 2025 & 2033
- Figure 16: North America Phthalic Anhydride Derivatives Industry Volume (K Tons), by Derivatives 2025 & 2033
- Figure 17: North America Phthalic Anhydride Derivatives Industry Revenue Share (%), by Derivatives 2025 & 2033
- Figure 18: North America Phthalic Anhydride Derivatives Industry Volume Share (%), by Derivatives 2025 & 2033
- Figure 19: North America Phthalic Anhydride Derivatives Industry Revenue (billion), by End-user Industry 2025 & 2033
- Figure 20: North America Phthalic Anhydride Derivatives Industry Volume (K Tons), by End-user Industry 2025 & 2033
- Figure 21: North America Phthalic Anhydride Derivatives Industry Revenue Share (%), by End-user Industry 2025 & 2033
- Figure 22: North America Phthalic Anhydride Derivatives Industry Volume Share (%), by End-user Industry 2025 & 2033
- Figure 23: North America Phthalic Anhydride Derivatives Industry Revenue (billion), by Country 2025 & 2033
- Figure 24: North America Phthalic Anhydride Derivatives Industry Volume (K Tons), by Country 2025 & 2033
- Figure 25: North America Phthalic Anhydride Derivatives Industry Revenue Share (%), by Country 2025 & 2033
- Figure 26: North America Phthalic Anhydride Derivatives Industry Volume Share (%), by Country 2025 & 2033
- Figure 27: Europe Phthalic Anhydride Derivatives Industry Revenue (billion), by Derivatives 2025 & 2033
- Figure 28: Europe Phthalic Anhydride Derivatives Industry Volume (K Tons), by Derivatives 2025 & 2033
- Figure 29: Europe Phthalic Anhydride Derivatives Industry Revenue Share (%), by Derivatives 2025 & 2033
- Figure 30: Europe Phthalic Anhydride Derivatives Industry Volume Share (%), by Derivatives 2025 & 2033
- Figure 31: Europe Phthalic Anhydride Derivatives Industry Revenue (billion), by End-user Industry 2025 & 2033
- Figure 32: Europe Phthalic Anhydride Derivatives Industry Volume (K Tons), by End-user Industry 2025 & 2033
- Figure 33: Europe Phthalic Anhydride Derivatives Industry Revenue Share (%), by End-user Industry 2025 & 2033
- Figure 34: Europe Phthalic Anhydride Derivatives Industry Volume Share (%), by End-user Industry 2025 & 2033
- Figure 35: Europe Phthalic Anhydride Derivatives Industry Revenue (billion), by Country 2025 & 2033
- Figure 36: Europe Phthalic Anhydride Derivatives Industry Volume (K Tons), by Country 2025 & 2033
- Figure 37: Europe Phthalic Anhydride Derivatives Industry Revenue Share (%), by Country 2025 & 2033
- Figure 38: Europe Phthalic Anhydride Derivatives Industry Volume Share (%), by Country 2025 & 2033
- Figure 39: South America Phthalic Anhydride Derivatives Industry Revenue (billion), by Derivatives 2025 & 2033
- Figure 40: South America Phthalic Anhydride Derivatives Industry Volume (K Tons), by Derivatives 2025 & 2033
- Figure 41: South America Phthalic Anhydride Derivatives Industry Revenue Share (%), by Derivatives 2025 & 2033
- Figure 42: South America Phthalic Anhydride Derivatives Industry Volume Share (%), by Derivatives 2025 & 2033
- Figure 43: South America Phthalic Anhydride Derivatives Industry Revenue (billion), by End-user Industry 2025 & 2033
- Figure 44: South America Phthalic Anhydride Derivatives Industry Volume (K Tons), by End-user Industry 2025 & 2033
- Figure 45: South America Phthalic Anhydride Derivatives Industry Revenue Share (%), by End-user Industry 2025 & 2033
- Figure 46: South America Phthalic Anhydride Derivatives Industry Volume Share (%), by End-user Industry 2025 & 2033
- Figure 47: South America Phthalic Anhydride Derivatives Industry Revenue (billion), by Country 2025 & 2033
- Figure 48: South America Phthalic Anhydride Derivatives Industry Volume (K Tons), by Country 2025 & 2033
- Figure 49: South America Phthalic Anhydride Derivatives Industry Revenue Share (%), by Country 2025 & 2033
- Figure 50: South America Phthalic Anhydride Derivatives Industry Volume Share (%), by Country 2025 & 2033
- Figure 51: Middle East and Africa Phthalic Anhydride Derivatives Industry Revenue (billion), by Derivatives 2025 & 2033
- Figure 52: Middle East and Africa Phthalic Anhydride Derivatives Industry Volume (K Tons), by Derivatives 2025 & 2033
- Figure 53: Middle East and Africa Phthalic Anhydride Derivatives Industry Revenue Share (%), by Derivatives 2025 & 2033
- Figure 54: Middle East and Africa Phthalic Anhydride Derivatives Industry Volume Share (%), by Derivatives 2025 & 2033
- Figure 55: Middle East and Africa Phthalic Anhydride Derivatives Industry Revenue (billion), by End-user Industry 2025 & 2033
- Figure 56: Middle East and Africa Phthalic Anhydride Derivatives Industry Volume (K Tons), by End-user Industry 2025 & 2033
- Figure 57: Middle East and Africa Phthalic Anhydride Derivatives Industry Revenue Share (%), by End-user Industry 2025 & 2033
- Figure 58: Middle East and Africa Phthalic Anhydride Derivatives Industry Volume Share (%), by End-user Industry 2025 & 2033
- Figure 59: Middle East and Africa Phthalic Anhydride Derivatives Industry Revenue (billion), by Country 2025 & 2033
- Figure 60: Middle East and Africa Phthalic Anhydride Derivatives Industry Volume (K Tons), by Country 2025 & 2033
- Figure 61: Middle East and Africa Phthalic Anhydride Derivatives Industry Revenue Share (%), by Country 2025 & 2033
- Figure 62: Middle East and Africa Phthalic Anhydride Derivatives Industry Volume Share (%), by Country 2025 & 2033
List of Tables
- Table 1: Global Phthalic Anhydride Derivatives Industry Revenue billion Forecast, by Derivatives 2020 & 2033
- Table 2: Global Phthalic Anhydride Derivatives Industry Volume K Tons Forecast, by Derivatives 2020 & 2033
- Table 3: Global Phthalic Anhydride Derivatives Industry Revenue billion Forecast, by End-user Industry 2020 & 2033
- Table 4: Global Phthalic Anhydride Derivatives Industry Volume K Tons Forecast, by End-user Industry 2020 & 2033
- Table 5: Global Phthalic Anhydride Derivatives Industry Revenue billion Forecast, by Region 2020 & 2033
- Table 6: Global Phthalic Anhydride Derivatives Industry Volume K Tons Forecast, by Region 2020 & 2033
- Table 7: Global Phthalic Anhydride Derivatives Industry Revenue billion Forecast, by Derivatives 2020 & 2033
- Table 8: Global Phthalic Anhydride Derivatives Industry Volume K Tons Forecast, by Derivatives 2020 & 2033
- Table 9: Global Phthalic Anhydride Derivatives Industry Revenue billion Forecast, by End-user Industry 2020 & 2033
- Table 10: Global Phthalic Anhydride Derivatives Industry Volume K Tons Forecast, by End-user Industry 2020 & 2033
- Table 11: Global Phthalic Anhydride Derivatives Industry Revenue billion Forecast, by Country 2020 & 2033
- Table 12: Global Phthalic Anhydride Derivatives Industry Volume K Tons Forecast, by Country 2020 & 2033
- Table 13: China Phthalic Anhydride Derivatives Industry Revenue (billion) Forecast, by Application 2020 & 2033
- Table 14: China Phthalic Anhydride Derivatives Industry Volume (K Tons) Forecast, by Application 2020 & 2033
- Table 15: India Phthalic Anhydride Derivatives Industry Revenue (billion) Forecast, by Application 2020 & 2033
- Table 16: India Phthalic Anhydride Derivatives Industry Volume (K Tons) Forecast, by Application 2020 & 2033
- Table 17: Japan Phthalic Anhydride Derivatives Industry Revenue (billion) Forecast, by Application 2020 & 2033
- Table 18: Japan Phthalic Anhydride Derivatives Industry Volume (K Tons) Forecast, by Application 2020 & 2033
- Table 19: South Korea Phthalic Anhydride Derivatives Industry Revenue (billion) Forecast, by Application 2020 & 2033
- Table 20: South Korea Phthalic Anhydride Derivatives Industry Volume (K Tons) Forecast, by Application 2020 & 2033
- Table 21: Rest of Asia Pacific Phthalic Anhydride Derivatives Industry Revenue (billion) Forecast, by Application 2020 & 2033
- Table 22: Rest of Asia Pacific Phthalic Anhydride Derivatives Industry Volume (K Tons) Forecast, by Application 2020 & 2033
- Table 23: Global Phthalic Anhydride Derivatives Industry Revenue billion Forecast, by Derivatives 2020 & 2033
- Table 24: Global Phthalic Anhydride Derivatives Industry Volume K Tons Forecast, by Derivatives 2020 & 2033
- Table 25: Global Phthalic Anhydride Derivatives Industry Revenue billion Forecast, by End-user Industry 2020 & 2033
- Table 26: Global Phthalic Anhydride Derivatives Industry Volume K Tons Forecast, by End-user Industry 2020 & 2033
- Table 27: Global Phthalic Anhydride Derivatives Industry Revenue billion Forecast, by Country 2020 & 2033
- Table 28: Global Phthalic Anhydride Derivatives Industry Volume K Tons Forecast, by Country 2020 & 2033
- Table 29: United States Phthalic Anhydride Derivatives Industry Revenue (billion) Forecast, by Application 2020 & 2033
- Table 30: United States Phthalic Anhydride Derivatives Industry Volume (K Tons) Forecast, by Application 2020 & 2033
- Table 31: Canada Phthalic Anhydride Derivatives Industry Revenue (billion) Forecast, by Application 2020 & 2033
- Table 32: Canada Phthalic Anhydride Derivatives Industry Volume (K Tons) Forecast, by Application 2020 & 2033
- Table 33: Mexico Phthalic Anhydride Derivatives Industry Revenue (billion) Forecast, by Application 2020 & 2033
- Table 34: Mexico Phthalic Anhydride Derivatives Industry Volume (K Tons) Forecast, by Application 2020 & 2033
- Table 35: Global Phthalic Anhydride Derivatives Industry Revenue billion Forecast, by Derivatives 2020 & 2033
- Table 36: Global Phthalic Anhydride Derivatives Industry Volume K Tons Forecast, by Derivatives 2020 & 2033
- Table 37: Global Phthalic Anhydride Derivatives Industry Revenue billion Forecast, by End-user Industry 2020 & 2033
- Table 38: Global Phthalic Anhydride Derivatives Industry Volume K Tons Forecast, by End-user Industry 2020 & 2033
- Table 39: Global Phthalic Anhydride Derivatives Industry Revenue billion Forecast, by Country 2020 & 2033
- Table 40: Global Phthalic Anhydride Derivatives Industry Volume K Tons Forecast, by Country 2020 & 2033
- Table 41: Germany Phthalic Anhydride Derivatives Industry Revenue (billion) Forecast, by Application 2020 & 2033
- Table 42: Germany Phthalic Anhydride Derivatives Industry Volume (K Tons) Forecast, by Application 2020 & 2033
- Table 43: United Kingdom Phthalic Anhydride Derivatives Industry Revenue (billion) Forecast, by Application 2020 & 2033
- Table 44: United Kingdom Phthalic Anhydride Derivatives Industry Volume (K Tons) Forecast, by Application 2020 & 2033
- Table 45: France Phthalic Anhydride Derivatives Industry Revenue (billion) Forecast, by Application 2020 & 2033
- Table 46: France Phthalic Anhydride Derivatives Industry Volume (K Tons) Forecast, by Application 2020 & 2033
- Table 47: Italy Phthalic Anhydride Derivatives Industry Revenue (billion) Forecast, by Application 2020 & 2033
- Table 48: Italy Phthalic Anhydride Derivatives Industry Volume (K Tons) Forecast, by Application 2020 & 2033
- Table 49: Rest of Europe Phthalic Anhydride Derivatives Industry Revenue (billion) Forecast, by Application 2020 & 2033
- Table 50: Rest of Europe Phthalic Anhydride Derivatives Industry Volume (K Tons) Forecast, by Application 2020 & 2033
- Table 51: Global Phthalic Anhydride Derivatives Industry Revenue billion Forecast, by Derivatives 2020 & 2033
- Table 52: Global Phthalic Anhydride Derivatives Industry Volume K Tons Forecast, by Derivatives 2020 & 2033
- Table 53: Global Phthalic Anhydride Derivatives Industry Revenue billion Forecast, by End-user Industry 2020 & 2033
- Table 54: Global Phthalic Anhydride Derivatives Industry Volume K Tons Forecast, by End-user Industry 2020 & 2033
- Table 55: Global Phthalic Anhydride Derivatives Industry Revenue billion Forecast, by Country 2020 & 2033
- Table 56: Global Phthalic Anhydride Derivatives Industry Volume K Tons Forecast, by Country 2020 & 2033
- Table 57: Brazil Phthalic Anhydride Derivatives Industry Revenue (billion) Forecast, by Application 2020 & 2033
- Table 58: Brazil Phthalic Anhydride Derivatives Industry Volume (K Tons) Forecast, by Application 2020 & 2033
- Table 59: Argentina Phthalic Anhydride Derivatives Industry Revenue (billion) Forecast, by Application 2020 & 2033
- Table 60: Argentina Phthalic Anhydride Derivatives Industry Volume (K Tons) Forecast, by Application 2020 & 2033
- Table 61: Rest of South America Phthalic Anhydride Derivatives Industry Revenue (billion) Forecast, by Application 2020 & 2033
- Table 62: Rest of South America Phthalic Anhydride Derivatives Industry Volume (K Tons) Forecast, by Application 2020 & 2033
- Table 63: Global Phthalic Anhydride Derivatives Industry Revenue billion Forecast, by Derivatives 2020 & 2033
- Table 64: Global Phthalic Anhydride Derivatives Industry Volume K Tons Forecast, by Derivatives 2020 & 2033
- Table 65: Global Phthalic Anhydride Derivatives Industry Revenue billion Forecast, by End-user Industry 2020 & 2033
- Table 66: Global Phthalic Anhydride Derivatives Industry Volume K Tons Forecast, by End-user Industry 2020 & 2033
- Table 67: Global Phthalic Anhydride Derivatives Industry Revenue billion Forecast, by Country 2020 & 2033
- Table 68: Global Phthalic Anhydride Derivatives Industry Volume K Tons Forecast, by Country 2020 & 2033
- Table 69: Saudi Arabia Phthalic Anhydride Derivatives Industry Revenue (billion) Forecast, by Application 2020 & 2033
- Table 70: Saudi Arabia Phthalic Anhydride Derivatives Industry Volume (K Tons) Forecast, by Application 2020 & 2033
- Table 71: South Africa Phthalic Anhydride Derivatives Industry Revenue (billion) Forecast, by Application 2020 & 2033
- Table 72: South Africa Phthalic Anhydride Derivatives Industry Volume (K Tons) Forecast, by Application 2020 & 2033
- Table 73: Rest of Middle East and Africa Phthalic Anhydride Derivatives Industry Revenue (billion) Forecast, by Application 2020 & 2033
- Table 74: Rest of Middle East and Africa Phthalic Anhydride Derivatives Industry Volume (K Tons) Forecast, by Application 2020 & 2033
Frequently Asked Questions
1. What is the projected Compound Annual Growth Rate (CAGR) of the Phthalic Anhydride Derivatives Industry?
The projected CAGR is approximately 6.6%.
2. Which companies are prominent players in the Phthalic Anhydride Derivatives Industry?
Key companies in the market include KH Chemicals, Stepan Company, LANXESS, BASF SE, Alfa Aesar, PENPET Petrochemical Trading GmbH, JFE Chemical Corporation, I G Petrochemicals Ltd, Polynt SpA, Thirumalai Chemicals Ltd, Tokyo Chemical Industry, S I Group Inc, Koppers Inc, Perstorp, The Chemical Company.
3. What are the main segments of the Phthalic Anhydride Derivatives Industry?
The market segments include Derivatives, End-user Industry.
4. Can you provide details about the market size?
The market size is estimated to be USD 4.88 billion as of 2022.
5. What are some drivers contributing to market growth?
; Increasing Consumption of Plastics in Construction Sector; Other Drivers.
6. What are the notable trends driving market growth?
Construction Sector to Dominate the Market.
7. Are there any restraints impacting market growth?
; Toxicity related to Phthalic Anhydride; Unfavorable Conditions Arising Due to COVID-19 Outbreak.
8. Can you provide examples of recent developments in the market?
N/A
9. What pricing options are available for accessing the report?
Pricing options include single-user, multi-user, and enterprise licenses priced at USD 4750, USD 5250, and USD 8750 respectively.
10. Is the market size provided in terms of value or volume?
The market size is provided in terms of value, measured in billion and volume, measured in K Tons.
11. Are there any specific market keywords associated with the report?
Yes, the market keyword associated with the report is "Phthalic Anhydride Derivatives Industry," which aids in identifying and referencing the specific market segment covered.
12. How do I determine which pricing option suits my needs best?
The pricing options vary based on user requirements and access needs. Individual users may opt for single-user licenses, while businesses requiring broader access may choose multi-user or enterprise licenses for cost-effective access to the report.
13. Are there any additional resources or data provided in the Phthalic Anhydride Derivatives Industry report?
While the report offers comprehensive insights, it's advisable to review the specific contents or supplementary materials provided to ascertain if additional resources or data are available.
14. How can I stay updated on further developments or reports in the Phthalic Anhydride Derivatives Industry?
To stay informed about further developments, trends, and reports in the Phthalic Anhydride Derivatives Industry, consider subscribing to industry newsletters, following relevant companies and organizations, or regularly checking reputable industry news sources and publications.
Methodology
Step 1 - Identification of Relevant Samples Size from Population Database


Step 2 - Approaches for Defining Global Market Size (Value, Volume* & Price*)

Note*: In applicable scenarios
Step 3 - Data Sources
Primary Research
- Web Analytics
- Survey Reports
- Research Institute
- Latest Research Reports
- Opinion Leaders
Secondary Research
- Annual Reports
- White Paper
- Latest Press Release
- Industry Association
- Paid Database
- Investor Presentations

Step 4 - Data Triangulation
Involves using different sources of information in order to increase the validity of a study
These sources are likely to be stakeholders in a program - participants, other researchers, program staff, other community members, and so on.
Then we put all data in single framework & apply various statistical tools to find out the dynamic on the market.
During the analysis stage, feedback from the stakeholder groups would be compared to determine areas of agreement as well as areas of divergence