

Key Insights
The global polyether amine market, valued at $9.05 billion in 2025, is poised for significant expansion, projecting a compound annual growth rate (CAGR) of 13.56% from 2025 to 2033. This robust growth trajectory is underpinned by escalating demand for high-performance coatings across key sectors including automotive, construction, and electronics. Polyether amines' inherent advantages, such as superior adhesion, flexibility, and chemical resistance, make them indispensable for applications in polyurea coatings and adhesives. The industry is also witnessing a positive influence from the embrace of sustainable manufacturing practices and the emergence of bio-based polyether amine alternatives. Despite potential headwinds from raw material cost volatility and regulatory compliance, continuous product innovation and widening application frontiers ensure a favorable market outlook. The Asia-Pacific region is anticipated to be a primary growth engine, driven by rapid industrialization and infrastructure development in economies such as China and India. Market segmentation highlights strong demand across various amine types (monoamine, diamine, triamine) and applications, notably polyurea, fuel additives, composites, epoxy coatings, and adhesives/sealants. The competitive environment features a blend of multinational chemical corporations and specialized regional entities, fostering a market characterized by both competitive pricing and strategic product differentiation.
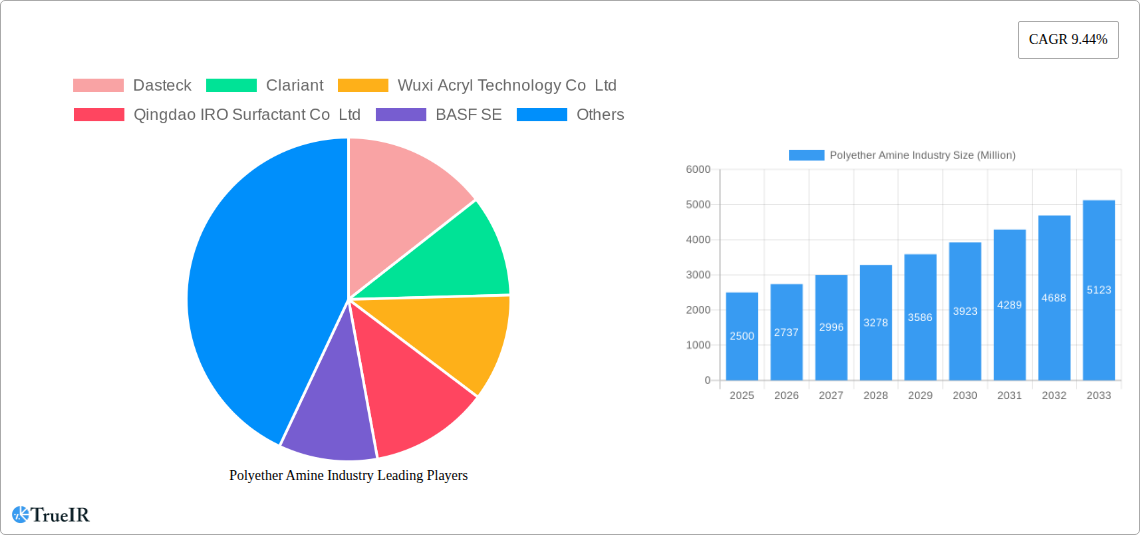
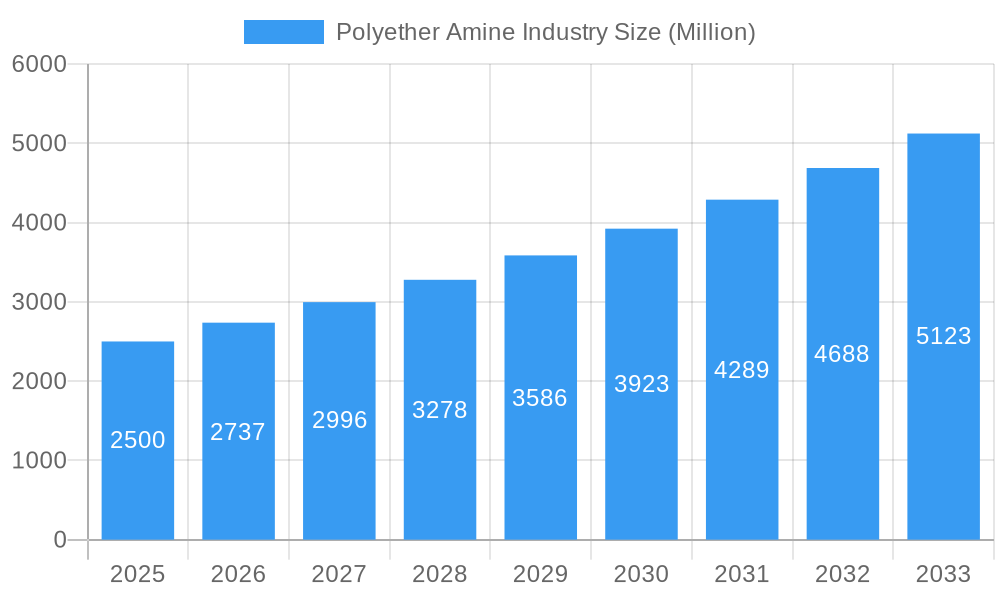
Polyether Amine Industry Market Size (In Billion)
The forecast period (2025-2033) signals sustained market expansion, with growth rates subject to economic dynamics and technological advancements. The polyurea coatings segment is expected to remain a dominant revenue driver, propelled by the increasing need for durable and protective coating solutions. The fuel additives segment is projected for moderate growth, influenced by stringent emission standards and the pursuit of improved fuel efficiency. The adhesives and sealants sector will also experience considerable growth, closely mirroring the expansion of construction and manufacturing activities. To sustain competitive advantage, industry players are prioritizing research and development for innovative polyether amine formulations, targeting niche applications and deeper penetration into existing markets. This strategic focus on innovation and market expansion will be paramount for sustained success in this dynamic and evolving market.
Polyether Amine Industry Company Market Share
Polyether Amine Industry Market Report: 2019-2033
This comprehensive report provides a detailed analysis of the global polyether amine industry, offering invaluable insights for industry stakeholders, investors, and researchers. Covering the period from 2019 to 2033, with a focus on 2025, this report delves into market dynamics, competitive landscapes, and future growth potential. Expect precise market sizing, robust segmentation, and in-depth analysis of key players, driving a clear understanding of this dynamic market.
Polyether Amine Industry Market Structure & Competitive Landscape
The global polyether amine market exhibits a moderately consolidated structure, with several major players holding significant market share. The Herfindahl-Hirschman Index (HHI) is estimated at xx in 2025, indicating a moderately competitive landscape. Innovation plays a crucial role, with companies investing heavily in R&D to develop novel polyether amines with enhanced properties and applications. Regulatory frameworks, particularly concerning environmental regulations and safety standards, significantly influence market dynamics. Product substitutes, such as other types of amines and alternative curing agents, pose a degree of competitive pressure.
The market is segmented by various end-use applications, including polyurea coatings, fuel additives, composites, epoxy coatings, adhesives & sealants, and other applications. M&A activity has been moderate in recent years, with a total transaction value of approximately xx Million in the period 2019-2024. Key drivers behind M&A include expanding product portfolios, geographical reach, and technological capabilities.
- Market Concentration: Moderately consolidated, with an estimated HHI of xx in 2025.
- Innovation Drivers: R&D investments in novel polyether amines with improved properties.
- Regulatory Impacts: Stringent environmental and safety regulations impacting production and usage.
- Product Substitutes: Competition from alternative amines and curing agents.
- End-User Segmentation: Diverse applications across various industries.
- M&A Trends: Moderate activity, focused on portfolio expansion and geographical reach.
Polyether Amine Industry Market Trends & Opportunities
The global polyether amine market is projected to witness robust growth during the forecast period (2025-2033), with a compound annual growth rate (CAGR) estimated at xx%. This growth is driven by several factors, including increasing demand from key end-use sectors such as construction, automotive, and aerospace. Technological advancements in polyether amine synthesis and formulation are leading to the development of higher-performance products with improved properties like enhanced adhesion, durability, and flexibility. This fuels market expansion across diverse applications. Furthermore, changing consumer preferences towards sustainable and environmentally friendly materials are influencing product development and market demand. The competitive landscape remains dynamic, with ongoing innovations and strategic partnerships shaping market share and competitive dynamics. Market penetration rates vary significantly across different regions and applications, reflecting varying degrees of adoption and market maturity.
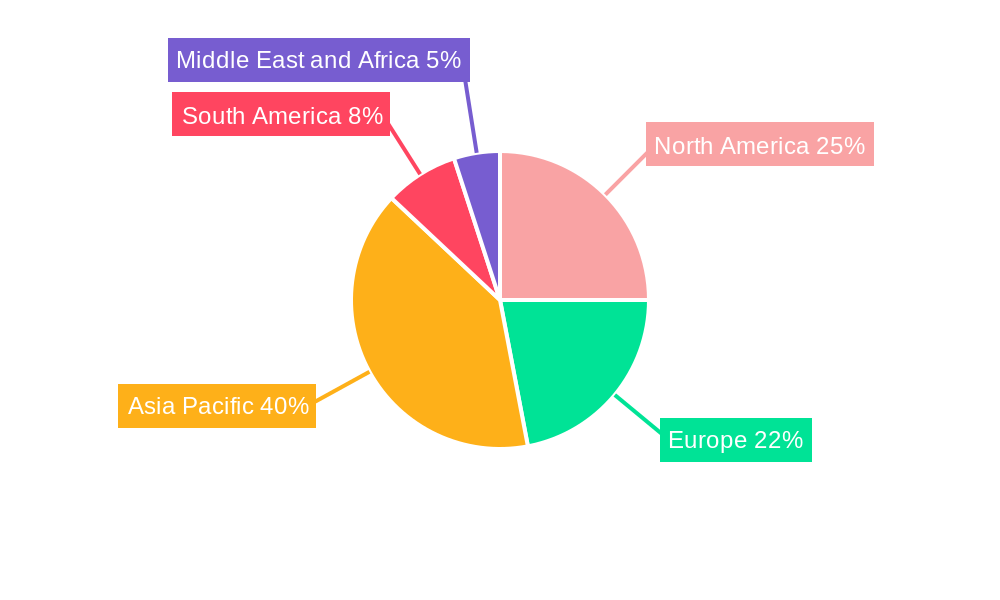
Dominant Markets & Segments in Polyether Amine Industry
The Asia-Pacific region is expected to dominate the global polyether amine market throughout the forecast period, driven by robust infrastructure development, rapid industrialization, and increasing demand from various end-use sectors. Within this region, China and India are key contributors to market growth.
- Leading Region: Asia-Pacific (China and India are key contributors).
- Type Segmentation:
- Diamine segment holds the largest market share due to its widespread applications.
- Monoamine and triamine segments are also experiencing considerable growth.
- Application Segmentation:
- Polyurea coatings dominate the application segment due to its high demand in construction and infrastructure.
- Fuel additives and epoxy coatings are also significant application areas with substantial growth potential.
Key Growth Drivers:
- Rapid infrastructure development in Asia-Pacific.
- Expanding automotive and aerospace industries globally.
- Increasing demand for high-performance coatings and adhesives.
- Government initiatives promoting sustainable materials in various sectors.
Polyether Amine Industry Product Analysis
Recent innovations in polyether amine technology have focused on developing products with improved properties, such as higher reactivity, better adhesion, and enhanced thermal stability. These advancements have expanded the applications of polyether amines into new areas, including advanced composites and high-performance coatings. Competition is driven by providing superior performance, cost-effectiveness, and sustainability.
Key Drivers, Barriers & Challenges in Polyether Amine Industry
Key Drivers:
- Growing demand from construction, automotive, and aerospace industries.
- Increasing adoption of polyurea coatings for diverse applications.
- Technological advancements leading to higher-performance products.
Challenges and Restraints:
- Fluctuations in raw material prices.
- Stringent environmental regulations and safety standards.
- Intense competition from substitute materials. This pressure is estimated to reduce market growth by approximately xx% by 2033.
Growth Drivers in the Polyether Amine Industry Market
The polyether amine market is driven by several factors, including increasing demand from various industries and the development of innovative applications. The growth in construction activities, automotive production, and the aerospace industry fuels the demand for high-performance coatings, adhesives, and other materials using polyether amines. Technological advancements leading to more efficient and environmentally friendly production processes further bolster market growth. Favorable government policies and initiatives supporting the use of sustainable materials also contribute to market expansion.
Challenges Impacting Polyether Amine Industry Growth
The industry faces several challenges, including fluctuations in raw material costs and stringent environmental regulations. Supply chain disruptions can lead to production delays and increased costs. Intense competition from substitute materials and the need to constantly innovate to meet evolving market demands are also significant challenges.
Key Players Shaping the Polyether Amine Industry Market
- Dasteck
- Clariant
- Wuxi Acryl Technology Co Ltd
- Qingdao IRO Surfactant Co Ltd
- BASF SE
- Huntsman International LLC
- Shanghai Chenhua International Trade Co Ltd
- Chia Tai New Materials (Zibo Zhengda Polyurethane Co Ltd )
Significant Polyether Amine Industry Industry Milestones
- June 2022: BASF announced expansion of production capacity at its Geismar site in North America, focusing on specialty amines and the Baxxodur brand. This expansion is expected to significantly increase supply and market share.
- March 2022: Brenntag partnered with BASF SE to become the exclusive distributor for its polyetheramines and Baxxodur portfolio in the US and Canada, significantly enhancing BASF's market reach.
Future Outlook for Polyether Amine Industry Market
The polyether amine market is poised for continued growth driven by increasing demand from various sectors and ongoing technological advancements. Strategic partnerships, capacity expansions, and the development of innovative applications will drive market expansion. The focus on sustainable and environmentally friendly solutions will also play a significant role in shaping the future of the industry, offering significant opportunities for growth and innovation.
Polyether Amine Industry Segmentation
-
1. Type
- 1.1. Monoamine
- 1.2. Diamine
- 1.3. Triamine
-
2. Application
- 2.1. Polyurea
- 2.2. Fuel Additives
- 2.3. Composites
- 2.4. Epoxy Coatings
- 2.5. Adhesives and Sealants
- 2.6. Other Applications
Polyether Amine Industry Segmentation By Geography
-
1. Asia Pacific
- 1.1. China
- 1.2. India
- 1.3. Japan
- 1.4. South Korea
- 1.5. Rest of Asia Pacific
-
2. North America
- 2.1. United States
- 2.2. Canada
- 2.3. Mexico
-
3. Europe
- 3.1. Germany
- 3.2. United Kingdom
- 3.3. Italy
- 3.4. France
- 3.5. Rest of Europe
-
4. South America
- 4.1. Brazil
- 4.2. Argentina
- 4.3. Rest of South America
-
5. Middle East and Africa
- 5.1. Saudi Arabia
- 5.2. South Africa
- 5.3. Rest of Middle East and Africa
Polyether Amine Industry Regional Market Share
Geographic Coverage of Polyether Amine Industry
Polyether Amine Industry REPORT HIGHLIGHTS
| Aspects | Details |
|---|---|
| Study Period | 2020-2034 |
| Base Year | 2025 |
| Estimated Year | 2026 |
| Forecast Period | 2026-2034 |
| Historical Period | 2020-2025 |
| Growth Rate | CAGR of 13.56% from 2020-2034 |
| Segmentation |
|
Table of Contents
- 1. Introduction
- 1.1. Research Scope
- 1.2. Market Segmentation
- 1.3. Research Objective
- 1.4. Definitions and Assumptions
- 2. Executive Summary
- 2.1. Market Snapshot
- 3. Market Dynamics
- 3.1. Market Drivers
- 3.2. Market Restrains
- 3.3. Market Trends
- 3.4. Market Opportunities
- 4. Market Factor Analysis
- 4.1. Porters Five Forces
- 4.1.1. Bargaining Power of Suppliers
- 4.1.2. Bargaining Power of Buyers
- 4.1.3. Threat of New Entrants
- 4.1.4. Threat of Substitutes
- 4.1.5. Competitive Rivalry
- 4.2. PESTEL analysis
- 4.3. BCG Analysis
- 4.3.1. Stars (High Growth, High Market Share)
- 4.3.2. Cash Cows (Low Growth, High Market Share)
- 4.3.3. Question Mark (High Growth, Low Market Share)
- 4.3.4. Dogs (Low Growth, Low Market Share)
- 4.4. Ansoff Matrix Analysis
- 4.5. Supply Chain Analysis
- 4.6. Regulatory Landscape
- 4.7. Current Market Potential and Opportunity Assessment (TAM–SAM–SOM Framework)
- 4.8. TIR Analyst Note
- 4.1. Porters Five Forces
- 5. Market Analysis, Insights and Forecast 2021-2033
- 5.1. Market Analysis, Insights and Forecast - by Type
- 5.1.1. Monoamine
- 5.1.2. Diamine
- 5.1.3. Triamine
- 5.2. Market Analysis, Insights and Forecast - by Application
- 5.2.1. Polyurea
- 5.2.2. Fuel Additives
- 5.2.3. Composites
- 5.2.4. Epoxy Coatings
- 5.2.5. Adhesives and Sealants
- 5.2.6. Other Applications
- 5.3. Market Analysis, Insights and Forecast - by Region
- 5.3.1. Asia Pacific
- 5.3.2. North America
- 5.3.3. Europe
- 5.3.4. South America
- 5.3.5. Middle East and Africa
- 5.1. Market Analysis, Insights and Forecast - by Type
- 6. Global Polyether Amine Industry Analysis, Insights and Forecast, 2021-2033
- 6.1. Market Analysis, Insights and Forecast - by Type
- 6.1.1. Monoamine
- 6.1.2. Diamine
- 6.1.3. Triamine
- 6.2. Market Analysis, Insights and Forecast - by Application
- 6.2.1. Polyurea
- 6.2.2. Fuel Additives
- 6.2.3. Composites
- 6.2.4. Epoxy Coatings
- 6.2.5. Adhesives and Sealants
- 6.2.6. Other Applications
- 6.1. Market Analysis, Insights and Forecast - by Type
- 7. Asia Pacific Polyether Amine Industry Analysis, Insights and Forecast, 2020-2032
- 7.1. Market Analysis, Insights and Forecast - by Type
- 7.1.1. Monoamine
- 7.1.2. Diamine
- 7.1.3. Triamine
- 7.2. Market Analysis, Insights and Forecast - by Application
- 7.2.1. Polyurea
- 7.2.2. Fuel Additives
- 7.2.3. Composites
- 7.2.4. Epoxy Coatings
- 7.2.5. Adhesives and Sealants
- 7.2.6. Other Applications
- 7.1. Market Analysis, Insights and Forecast - by Type
- 8. North America Polyether Amine Industry Analysis, Insights and Forecast, 2020-2032
- 8.1. Market Analysis, Insights and Forecast - by Type
- 8.1.1. Monoamine
- 8.1.2. Diamine
- 8.1.3. Triamine
- 8.2. Market Analysis, Insights and Forecast - by Application
- 8.2.1. Polyurea
- 8.2.2. Fuel Additives
- 8.2.3. Composites
- 8.2.4. Epoxy Coatings
- 8.2.5. Adhesives and Sealants
- 8.2.6. Other Applications
- 8.1. Market Analysis, Insights and Forecast - by Type
- 9. Europe Polyether Amine Industry Analysis, Insights and Forecast, 2020-2032
- 9.1. Market Analysis, Insights and Forecast - by Type
- 9.1.1. Monoamine
- 9.1.2. Diamine
- 9.1.3. Triamine
- 9.2. Market Analysis, Insights and Forecast - by Application
- 9.2.1. Polyurea
- 9.2.2. Fuel Additives
- 9.2.3. Composites
- 9.2.4. Epoxy Coatings
- 9.2.5. Adhesives and Sealants
- 9.2.6. Other Applications
- 9.1. Market Analysis, Insights and Forecast - by Type
- 10. South America Polyether Amine Industry Analysis, Insights and Forecast, 2020-2032
- 10.1. Market Analysis, Insights and Forecast - by Type
- 10.1.1. Monoamine
- 10.1.2. Diamine
- 10.1.3. Triamine
- 10.2. Market Analysis, Insights and Forecast - by Application
- 10.2.1. Polyurea
- 10.2.2. Fuel Additives
- 10.2.3. Composites
- 10.2.4. Epoxy Coatings
- 10.2.5. Adhesives and Sealants
- 10.2.6. Other Applications
- 10.1. Market Analysis, Insights and Forecast - by Type
- 11. Middle East and Africa Polyether Amine Industry Analysis, Insights and Forecast, 2020-2032
- 11.1. Market Analysis, Insights and Forecast - by Type
- 11.1.1. Monoamine
- 11.1.2. Diamine
- 11.1.3. Triamine
- 11.2. Market Analysis, Insights and Forecast - by Application
- 11.2.1. Polyurea
- 11.2.2. Fuel Additives
- 11.2.3. Composites
- 11.2.4. Epoxy Coatings
- 11.2.5. Adhesives and Sealants
- 11.2.6. Other Applications
- 11.1. Market Analysis, Insights and Forecast - by Type
- 12. Competitive Analysis
- 12.1. Company Profiles
- 12.1.1 Dasteck
- 12.1.1.1. Company Overview
- 12.1.1.2. Products
- 12.1.1.3. Company Financials
- 12.1.1.4. SWOT Analysis
- 12.1.2 Clariant
- 12.1.2.1. Company Overview
- 12.1.2.2. Products
- 12.1.2.3. Company Financials
- 12.1.2.4. SWOT Analysis
- 12.1.3 Wuxi Acryl Technology Co Ltd
- 12.1.3.1. Company Overview
- 12.1.3.2. Products
- 12.1.3.3. Company Financials
- 12.1.3.4. SWOT Analysis
- 12.1.4 Qingdao IRO Surfactant Co Ltd
- 12.1.4.1. Company Overview
- 12.1.4.2. Products
- 12.1.4.3. Company Financials
- 12.1.4.4. SWOT Analysis
- 12.1.5 BASF SE
- 12.1.5.1. Company Overview
- 12.1.5.2. Products
- 12.1.5.3. Company Financials
- 12.1.5.4. SWOT Analysis
- 12.1.6 Huntsman International LLC
- 12.1.6.1. Company Overview
- 12.1.6.2. Products
- 12.1.6.3. Company Financials
- 12.1.6.4. SWOT Analysis
- 12.1.7 Shanghai Chenhua International Trade Co Ltd
- 12.1.7.1. Company Overview
- 12.1.7.2. Products
- 12.1.7.3. Company Financials
- 12.1.7.4. SWOT Analysis
- 12.1.8 Chia Tai New Materials (Zibo Zhengda Polyurethane Co Ltd )
- 12.1.8.1. Company Overview
- 12.1.8.2. Products
- 12.1.8.3. Company Financials
- 12.1.8.4. SWOT Analysis
- 12.1.1 Dasteck
- 12.2. Market Entropy
- 12.2.1 Company's Key Areas Served
- 12.2.2 Recent Developments
- 12.3. Company Market Share Analysis 2025
- 12.3.1 Top 5 Companies Market Share Analysis
- 12.3.2 Top 3 Companies Market Share Analysis
- 12.4. List of Potential Customers
- 13. Research Methodology
List of Figures
- Figure 1: Global Polyether Amine Industry Revenue Breakdown (billion, %) by Region 2025 & 2033
- Figure 2: Global Polyether Amine Industry Volume Breakdown (kilotons, %) by Region 2025 & 2033
- Figure 3: Asia Pacific Polyether Amine Industry Revenue (billion), by Type 2025 & 2033
- Figure 4: Asia Pacific Polyether Amine Industry Volume (kilotons), by Type 2025 & 2033
- Figure 5: Asia Pacific Polyether Amine Industry Revenue Share (%), by Type 2025 & 2033
- Figure 6: Asia Pacific Polyether Amine Industry Volume Share (%), by Type 2025 & 2033
- Figure 7: Asia Pacific Polyether Amine Industry Revenue (billion), by Application 2025 & 2033
- Figure 8: Asia Pacific Polyether Amine Industry Volume (kilotons), by Application 2025 & 2033
- Figure 9: Asia Pacific Polyether Amine Industry Revenue Share (%), by Application 2025 & 2033
- Figure 10: Asia Pacific Polyether Amine Industry Volume Share (%), by Application 2025 & 2033
- Figure 11: Asia Pacific Polyether Amine Industry Revenue (billion), by Country 2025 & 2033
- Figure 12: Asia Pacific Polyether Amine Industry Volume (kilotons), by Country 2025 & 2033
- Figure 13: Asia Pacific Polyether Amine Industry Revenue Share (%), by Country 2025 & 2033
- Figure 14: Asia Pacific Polyether Amine Industry Volume Share (%), by Country 2025 & 2033
- Figure 15: North America Polyether Amine Industry Revenue (billion), by Type 2025 & 2033
- Figure 16: North America Polyether Amine Industry Volume (kilotons), by Type 2025 & 2033
- Figure 17: North America Polyether Amine Industry Revenue Share (%), by Type 2025 & 2033
- Figure 18: North America Polyether Amine Industry Volume Share (%), by Type 2025 & 2033
- Figure 19: North America Polyether Amine Industry Revenue (billion), by Application 2025 & 2033
- Figure 20: North America Polyether Amine Industry Volume (kilotons), by Application 2025 & 2033
- Figure 21: North America Polyether Amine Industry Revenue Share (%), by Application 2025 & 2033
- Figure 22: North America Polyether Amine Industry Volume Share (%), by Application 2025 & 2033
- Figure 23: North America Polyether Amine Industry Revenue (billion), by Country 2025 & 2033
- Figure 24: North America Polyether Amine Industry Volume (kilotons), by Country 2025 & 2033
- Figure 25: North America Polyether Amine Industry Revenue Share (%), by Country 2025 & 2033
- Figure 26: North America Polyether Amine Industry Volume Share (%), by Country 2025 & 2033
- Figure 27: Europe Polyether Amine Industry Revenue (billion), by Type 2025 & 2033
- Figure 28: Europe Polyether Amine Industry Volume (kilotons), by Type 2025 & 2033
- Figure 29: Europe Polyether Amine Industry Revenue Share (%), by Type 2025 & 2033
- Figure 30: Europe Polyether Amine Industry Volume Share (%), by Type 2025 & 2033
- Figure 31: Europe Polyether Amine Industry Revenue (billion), by Application 2025 & 2033
- Figure 32: Europe Polyether Amine Industry Volume (kilotons), by Application 2025 & 2033
- Figure 33: Europe Polyether Amine Industry Revenue Share (%), by Application 2025 & 2033
- Figure 34: Europe Polyether Amine Industry Volume Share (%), by Application 2025 & 2033
- Figure 35: Europe Polyether Amine Industry Revenue (billion), by Country 2025 & 2033
- Figure 36: Europe Polyether Amine Industry Volume (kilotons), by Country 2025 & 2033
- Figure 37: Europe Polyether Amine Industry Revenue Share (%), by Country 2025 & 2033
- Figure 38: Europe Polyether Amine Industry Volume Share (%), by Country 2025 & 2033
- Figure 39: South America Polyether Amine Industry Revenue (billion), by Type 2025 & 2033
- Figure 40: South America Polyether Amine Industry Volume (kilotons), by Type 2025 & 2033
- Figure 41: South America Polyether Amine Industry Revenue Share (%), by Type 2025 & 2033
- Figure 42: South America Polyether Amine Industry Volume Share (%), by Type 2025 & 2033
- Figure 43: South America Polyether Amine Industry Revenue (billion), by Application 2025 & 2033
- Figure 44: South America Polyether Amine Industry Volume (kilotons), by Application 2025 & 2033
- Figure 45: South America Polyether Amine Industry Revenue Share (%), by Application 2025 & 2033
- Figure 46: South America Polyether Amine Industry Volume Share (%), by Application 2025 & 2033
- Figure 47: South America Polyether Amine Industry Revenue (billion), by Country 2025 & 2033
- Figure 48: South America Polyether Amine Industry Volume (kilotons), by Country 2025 & 2033
- Figure 49: South America Polyether Amine Industry Revenue Share (%), by Country 2025 & 2033
- Figure 50: South America Polyether Amine Industry Volume Share (%), by Country 2025 & 2033
- Figure 51: Middle East and Africa Polyether Amine Industry Revenue (billion), by Type 2025 & 2033
- Figure 52: Middle East and Africa Polyether Amine Industry Volume (kilotons), by Type 2025 & 2033
- Figure 53: Middle East and Africa Polyether Amine Industry Revenue Share (%), by Type 2025 & 2033
- Figure 54: Middle East and Africa Polyether Amine Industry Volume Share (%), by Type 2025 & 2033
- Figure 55: Middle East and Africa Polyether Amine Industry Revenue (billion), by Application 2025 & 2033
- Figure 56: Middle East and Africa Polyether Amine Industry Volume (kilotons), by Application 2025 & 2033
- Figure 57: Middle East and Africa Polyether Amine Industry Revenue Share (%), by Application 2025 & 2033
- Figure 58: Middle East and Africa Polyether Amine Industry Volume Share (%), by Application 2025 & 2033
- Figure 59: Middle East and Africa Polyether Amine Industry Revenue (billion), by Country 2025 & 2033
- Figure 60: Middle East and Africa Polyether Amine Industry Volume (kilotons), by Country 2025 & 2033
- Figure 61: Middle East and Africa Polyether Amine Industry Revenue Share (%), by Country 2025 & 2033
- Figure 62: Middle East and Africa Polyether Amine Industry Volume Share (%), by Country 2025 & 2033
List of Tables
- Table 1: Global Polyether Amine Industry Revenue billion Forecast, by Type 2020 & 2033
- Table 2: Global Polyether Amine Industry Volume kilotons Forecast, by Type 2020 & 2033
- Table 3: Global Polyether Amine Industry Revenue billion Forecast, by Application 2020 & 2033
- Table 4: Global Polyether Amine Industry Volume kilotons Forecast, by Application 2020 & 2033
- Table 5: Global Polyether Amine Industry Revenue billion Forecast, by Region 2020 & 2033
- Table 6: Global Polyether Amine Industry Volume kilotons Forecast, by Region 2020 & 2033
- Table 7: Global Polyether Amine Industry Revenue billion Forecast, by Type 2020 & 2033
- Table 8: Global Polyether Amine Industry Volume kilotons Forecast, by Type 2020 & 2033
- Table 9: Global Polyether Amine Industry Revenue billion Forecast, by Application 2020 & 2033
- Table 10: Global Polyether Amine Industry Volume kilotons Forecast, by Application 2020 & 2033
- Table 11: Global Polyether Amine Industry Revenue billion Forecast, by Country 2020 & 2033
- Table 12: Global Polyether Amine Industry Volume kilotons Forecast, by Country 2020 & 2033
- Table 13: China Polyether Amine Industry Revenue (billion) Forecast, by Application 2020 & 2033
- Table 14: China Polyether Amine Industry Volume (kilotons) Forecast, by Application 2020 & 2033
- Table 15: India Polyether Amine Industry Revenue (billion) Forecast, by Application 2020 & 2033
- Table 16: India Polyether Amine Industry Volume (kilotons) Forecast, by Application 2020 & 2033
- Table 17: Japan Polyether Amine Industry Revenue (billion) Forecast, by Application 2020 & 2033
- Table 18: Japan Polyether Amine Industry Volume (kilotons) Forecast, by Application 2020 & 2033
- Table 19: South Korea Polyether Amine Industry Revenue (billion) Forecast, by Application 2020 & 2033
- Table 20: South Korea Polyether Amine Industry Volume (kilotons) Forecast, by Application 2020 & 2033
- Table 21: Rest of Asia Pacific Polyether Amine Industry Revenue (billion) Forecast, by Application 2020 & 2033
- Table 22: Rest of Asia Pacific Polyether Amine Industry Volume (kilotons) Forecast, by Application 2020 & 2033
- Table 23: Global Polyether Amine Industry Revenue billion Forecast, by Type 2020 & 2033
- Table 24: Global Polyether Amine Industry Volume kilotons Forecast, by Type 2020 & 2033
- Table 25: Global Polyether Amine Industry Revenue billion Forecast, by Application 2020 & 2033
- Table 26: Global Polyether Amine Industry Volume kilotons Forecast, by Application 2020 & 2033
- Table 27: Global Polyether Amine Industry Revenue billion Forecast, by Country 2020 & 2033
- Table 28: Global Polyether Amine Industry Volume kilotons Forecast, by Country 2020 & 2033
- Table 29: United States Polyether Amine Industry Revenue (billion) Forecast, by Application 2020 & 2033
- Table 30: United States Polyether Amine Industry Volume (kilotons) Forecast, by Application 2020 & 2033
- Table 31: Canada Polyether Amine Industry Revenue (billion) Forecast, by Application 2020 & 2033
- Table 32: Canada Polyether Amine Industry Volume (kilotons) Forecast, by Application 2020 & 2033
- Table 33: Mexico Polyether Amine Industry Revenue (billion) Forecast, by Application 2020 & 2033
- Table 34: Mexico Polyether Amine Industry Volume (kilotons) Forecast, by Application 2020 & 2033
- Table 35: Global Polyether Amine Industry Revenue billion Forecast, by Type 2020 & 2033
- Table 36: Global Polyether Amine Industry Volume kilotons Forecast, by Type 2020 & 2033
- Table 37: Global Polyether Amine Industry Revenue billion Forecast, by Application 2020 & 2033
- Table 38: Global Polyether Amine Industry Volume kilotons Forecast, by Application 2020 & 2033
- Table 39: Global Polyether Amine Industry Revenue billion Forecast, by Country 2020 & 2033
- Table 40: Global Polyether Amine Industry Volume kilotons Forecast, by Country 2020 & 2033
- Table 41: Germany Polyether Amine Industry Revenue (billion) Forecast, by Application 2020 & 2033
- Table 42: Germany Polyether Amine Industry Volume (kilotons) Forecast, by Application 2020 & 2033
- Table 43: United Kingdom Polyether Amine Industry Revenue (billion) Forecast, by Application 2020 & 2033
- Table 44: United Kingdom Polyether Amine Industry Volume (kilotons) Forecast, by Application 2020 & 2033
- Table 45: Italy Polyether Amine Industry Revenue (billion) Forecast, by Application 2020 & 2033
- Table 46: Italy Polyether Amine Industry Volume (kilotons) Forecast, by Application 2020 & 2033
- Table 47: France Polyether Amine Industry Revenue (billion) Forecast, by Application 2020 & 2033
- Table 48: France Polyether Amine Industry Volume (kilotons) Forecast, by Application 2020 & 2033
- Table 49: Rest of Europe Polyether Amine Industry Revenue (billion) Forecast, by Application 2020 & 2033
- Table 50: Rest of Europe Polyether Amine Industry Volume (kilotons) Forecast, by Application 2020 & 2033
- Table 51: Global Polyether Amine Industry Revenue billion Forecast, by Type 2020 & 2033
- Table 52: Global Polyether Amine Industry Volume kilotons Forecast, by Type 2020 & 2033
- Table 53: Global Polyether Amine Industry Revenue billion Forecast, by Application 2020 & 2033
- Table 54: Global Polyether Amine Industry Volume kilotons Forecast, by Application 2020 & 2033
- Table 55: Global Polyether Amine Industry Revenue billion Forecast, by Country 2020 & 2033
- Table 56: Global Polyether Amine Industry Volume kilotons Forecast, by Country 2020 & 2033
- Table 57: Brazil Polyether Amine Industry Revenue (billion) Forecast, by Application 2020 & 2033
- Table 58: Brazil Polyether Amine Industry Volume (kilotons) Forecast, by Application 2020 & 2033
- Table 59: Argentina Polyether Amine Industry Revenue (billion) Forecast, by Application 2020 & 2033
- Table 60: Argentina Polyether Amine Industry Volume (kilotons) Forecast, by Application 2020 & 2033
- Table 61: Rest of South America Polyether Amine Industry Revenue (billion) Forecast, by Application 2020 & 2033
- Table 62: Rest of South America Polyether Amine Industry Volume (kilotons) Forecast, by Application 2020 & 2033
- Table 63: Global Polyether Amine Industry Revenue billion Forecast, by Type 2020 & 2033
- Table 64: Global Polyether Amine Industry Volume kilotons Forecast, by Type 2020 & 2033
- Table 65: Global Polyether Amine Industry Revenue billion Forecast, by Application 2020 & 2033
- Table 66: Global Polyether Amine Industry Volume kilotons Forecast, by Application 2020 & 2033
- Table 67: Global Polyether Amine Industry Revenue billion Forecast, by Country 2020 & 2033
- Table 68: Global Polyether Amine Industry Volume kilotons Forecast, by Country 2020 & 2033
- Table 69: Saudi Arabia Polyether Amine Industry Revenue (billion) Forecast, by Application 2020 & 2033
- Table 70: Saudi Arabia Polyether Amine Industry Volume (kilotons) Forecast, by Application 2020 & 2033
- Table 71: South Africa Polyether Amine Industry Revenue (billion) Forecast, by Application 2020 & 2033
- Table 72: South Africa Polyether Amine Industry Volume (kilotons) Forecast, by Application 2020 & 2033
- Table 73: Rest of Middle East and Africa Polyether Amine Industry Revenue (billion) Forecast, by Application 2020 & 2033
- Table 74: Rest of Middle East and Africa Polyether Amine Industry Volume (kilotons) Forecast, by Application 2020 & 2033
Frequently Asked Questions
1. What is the projected Compound Annual Growth Rate (CAGR) of the Polyether Amine Industry?
The projected CAGR is approximately 13.56%.
2. Which companies are prominent players in the Polyether Amine Industry?
Key companies in the market include Dasteck, Clariant, Wuxi Acryl Technology Co Ltd , Qingdao IRO Surfactant Co Ltd, BASF SE, Huntsman International LLC, Shanghai Chenhua International Trade Co Ltd, Chia Tai New Materials (Zibo Zhengda Polyurethane Co Ltd ).
3. What are the main segments of the Polyether Amine Industry?
The market segments include Type, Application.
4. Can you provide details about the market size?
The market size is estimated to be USD 9.05 billion as of 2022.
5. What are some drivers contributing to market growth?
Increasing Demand from Construction Industry; Growing Trend of Eco-friendly and Renewable Energy Generation; Other Drivers.
6. What are the notable trends driving market growth?
Increasing Demand from Composite Application.
7. Are there any restraints impacting market growth?
Environmental Concern Due to Excessive Use of Polyetheramines; Other Restraints.
8. Can you provide examples of recent developments in the market?
June 2022: BASF made an announcement about the ongoing expansion of production capacity at the Geismar site in North America, with the aim of being on-stream by mid-2023. This expansion will focus on key specialty amines and will enable the production of more polyetheramines marketed under the Baxxodur brand.
9. What pricing options are available for accessing the report?
Pricing options include single-user, multi-user, and enterprise licenses priced at USD 4750, USD 5250, and USD 8750 respectively.
10. Is the market size provided in terms of value or volume?
The market size is provided in terms of value, measured in billion and volume, measured in kilotons.
11. Are there any specific market keywords associated with the report?
Yes, the market keyword associated with the report is "Polyether Amine Industry," which aids in identifying and referencing the specific market segment covered.
12. How do I determine which pricing option suits my needs best?
The pricing options vary based on user requirements and access needs. Individual users may opt for single-user licenses, while businesses requiring broader access may choose multi-user or enterprise licenses for cost-effective access to the report.
13. Are there any additional resources or data provided in the Polyether Amine Industry report?
While the report offers comprehensive insights, it's advisable to review the specific contents or supplementary materials provided to ascertain if additional resources or data are available.
14. How can I stay updated on further developments or reports in the Polyether Amine Industry?
To stay informed about further developments, trends, and reports in the Polyether Amine Industry, consider subscribing to industry newsletters, following relevant companies and organizations, or regularly checking reputable industry news sources and publications.
Methodology
Step 1 - Identification of Relevant Samples Size from Population Database


Step 2 - Approaches for Defining Global Market Size (Value, Volume* & Price*)

Note*: In applicable scenarios
Step 3 - Data Sources
Primary Research
- Web Analytics
- Survey Reports
- Research Institute
- Latest Research Reports
- Opinion Leaders
Secondary Research
- Annual Reports
- White Paper
- Latest Press Release
- Industry Association
- Paid Database
- Investor Presentations

Step 4 - Data Triangulation
Involves using different sources of information in order to increase the validity of a study
These sources are likely to be stakeholders in a program - participants, other researchers, program staff, other community members, and so on.
Then we put all data in single framework & apply various statistical tools to find out the dynamic on the market.
During the analysis stage, feedback from the stakeholder groups would be compared to determine areas of agreement as well as areas of divergence